Vol. 34, No. 04, pp. 1035 – 1042, October – December, 2017 dx.doi.org/10.1590/0104-6632.20170344s20150779
* To whom correspondence should be addressed
EFFECT OF DISSOLUTION KINETICS ON
FLOTATION RESPONSE OF CALCITE WITH
OLEATE
D. G. Horta
1,*, M. B. M. Monte
2and L. S. Leal-Filho
31Mining Engineering Department, Science and Technology Institute, Federal University of Alfenas (Unifal-MG), Poços de Caldas-MG, Brazil. *E-mail: [email protected]; Telephone: +55 35 36974713,
2Center for Mineral Technology (CETEM), Rio de Janeiro-RJ, Brazil. E-mail: [email protected] ,Telephone: + 55 21 3865 728 3Vale TechnologicalInstitute (VTI), Ouro Preto-MG, Brazil. E-mail: [email protected], Telephone: +55 31 35527360
(Submitted: December 1, 2015; Revised: April 19, 2016; Accepted: June 2, 2016).
Abstract – Phosphate flotation performance can be influenced by the dissolution kinetics of the minerals that compose
the ore. The purpose of this work was to investigate the effect of dissolution kinetics on flotation response with oleate (collector) of calcites from different origins and genesis. The calcite samples were first purified and characterized by x-ray Fluorescence (XRF) and the Rietveld method applied to x-ray Diffractometry data (RXD). Experiments of calcite dissolution and microflotationwere performed at pH 8 and pH 10.The pH effect on the calcite dissolution and flotation indicates the possible influence of the carbonate/bicarbonate ions provided by the CO2 present in the air. In addition, the flotation response is greater as the dissolution increases, making more Ca2+ ions available to interact with collector molecules. This result corroborates the surface precipitation mechanism proposed foroleate adsorption on the calcite surface.
Keywords: calcite, dissolution, flotation, sodium oleate
INTRODUCTION
Phosphate rock beneficiation provides apatite
concentrates that are mostly applied in fertilizer production. Carbonates such as calcite (CaCO3) and dolomite (CaMgCO3) are present as impurities in phosphate rock.
The marketable phosphate concentrate must display P2O5
content ≤ 30%, CaO/P2O5 < 1.6, MgO/P2O5 < 0.022 and
MgO<1% (Abouzeid, 2008; Sis and Chander, 2003a,
2003b). Flotation is applied in most of the phosphate
beneficiation plants with the objective of separating apatite
from carbonates (Abouzeid, 2008;Cao et al., 2015; Sis and Chander, 2003a).
The success of flotation depends on the range of
chemical reagents added to the system in order to control
the surface characteristics of minerals, determining the degree of selectivity. Long chain anionic reagents such
as fatty acids and alkyl sarcosinates, sulfosuccinates and
sulfosuccinamates have been used as collectors for both mineral types, carbonates and apatite. For some ores,
the direct flotation route, in which apatite is floated and
carbonates are depressed, is employed. Alternatively, the
carbonates can be floated and apatite depressed by means of the reverse flotation route. In both cases, it is necessary
to use selective depressants for carbonates, such as corn
starch or apatite, as phosphoric acid (Abdel-Khalek, 2000; Cao et al., 2015; Finkelstein, 1989; Hanna and
Somasundaran, 1976; Leal-Filho et al., 2010).
Industrial practice and laboratory investigations have
provided strong evidence that a flotation strategy which
of Chemical
is suitable to concentrate one specific phosphate ore can completely fail to concentrate others (Abdel-Khalek,
2000; Leal-Filho et al., 2010). Variances in mineralogical
composition are not sufficient to explain the dissimilar flotation response of phosphate ores from different
origins. As apatite and carbonates are sparingly soluble
minerals,their degree of dissolution might affect the flotation performance (Amankonah et al., 1985; Horta,
2013; Lu et al., 1998).
Few studies on the scope of mineral processing are
dedicated to investigating the influence of dissolution on the flotation response of salt-type minerals. Amankonah
et al. (1985), for instance, reported that, although apatite
solubility is different from calcite solubility in pure water, an intermediated value is reached as the reaction takes place
in the supernatant of the other mineral. This behaviour was related to formation of a third phase with characteristics of both calcite and apatite, called “capatite”.
Lu et al. (1998) studied oleate adsorption isotherms onto an apatite surface and compared their results with
the literature information about adsorption on fluorite and
calcite at pH 9.5. It was observed that, when the oleate concentration is greater than 2x10⁻⁵moldm-3, the adsorption order is: calcite (solubility product (KSP)= 4.6x10⁻⁹) >
fluorite (KSP= 5.0x10⁻¹¹) > apatite (K
SP = 6.3x10 -126).
Therefore, oleate adsorption takes place, preferentially, on
the more soluble minerals.
However, the solubility product is a thermodynamic parameter of the equilibrium condition, which probably
does not take place during the flotation process.
Accordingly, it is important to evaluate the dissolution
kinetics of sparingly soluble minerals in order to predict
their behaviour in real systems. Horta et al. (2016) observed
that the apatite flotation response with oleate increases
with the mineral dissolution rate.
The literature regarding calcite dissolution is very vast in the areas of geochemistry and oceanography due to
its importance for the understanding of subjects such as
the impact of CO2 on climate, carbonate accumulation in natural water sediments, global geochemistry cycles and acid rain (Berner, 1978; Morse, 1986; Morse and Arvidson, 2002; Peng et al., 2015; Plummer, 1976).
The main reactions that describe calcite dissolution in an open system, CaCO3-H2O-CO2, involve (Plummer et al., 1979):
Water ionization
H2O(l) H+
(aq) + OH
-(aq) (pKPS = -14.0)
Carbonate dissolution
CaCO3(s) Ca2+
(aq) + CO3
2-(aq (pKPS = -8.4)
CaCO3(s) + H+
(aq) Ca
2+
(aq) + HCO3
-(aq) (pKPS = 1.9)
Carbonic acid/carbonic gas system
CO2(g) CO2(aq)
CO2(aq) + H2O(l) H2CO3(aq) (pKPS = -1.5)
H2CO3(aq) HCO3 -(aq) + H
+
(aq) (pKPS = -6.4)
HCO3
-(aq) CO3
2-(aq) + H +
(aq) (pKPS = -10.3)
The calcite dissolution kinetic is mainly influenced by
pH, temperature, pCO2, degree of solution saturation by Ca2+ e CO
3
2- ions, surface morphology and concentration
of different species such as Mg2+ (Morse and Berner, 1979; Plummer et al., 1979).
The synergic effect of pH and pCO2 on calcite dissolution can be described as follows. (1) At pH < 3.5, the dissolution rate is controlled by the H+ions transport
from the bulk to the calcite/solution interface and the reverse flow of Ca2+ and HCO
3
2- ions. In this region, the
dissolution rate is independent of the pCO2. (2) At 3.5 <
pH < 5.5, there is a transition between the kinetic control
related to the H+ion transport and the superficial reactions,
in which the influence of pCO2 is significant. (3) The region
of pH > 5.5 is characterized by superficial reactions control
(Berner and Morse, 1974; Morse and Berner, 1979; Peng et al., 2015; Plummer et al., 1979).
The objective of this study was to correlate the dissolution kinetics of calcites from different origins and genesis with their flotation response with sodium oleate. The results are intended to help understand why different flotation strategies are applied to separate apatite from calcite in phosphate ores from different deposits (igneous,
sedimentary and metamorphic) around the world.
MATERIALS AND METHODS
Calcite samples
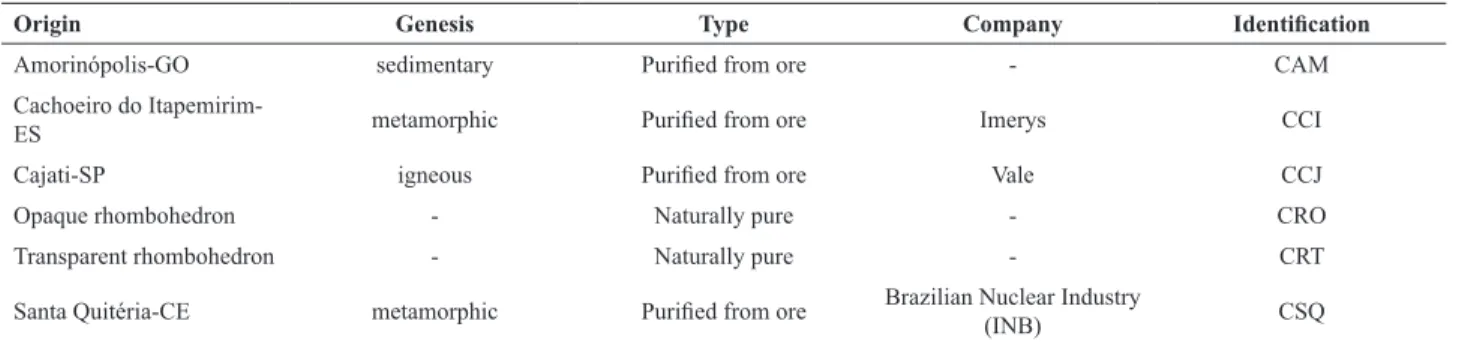
Calcite samples from different origins and genesis (Table 1) were first purified and characterized, and then submitted to dissolution and flotation experiments.
Most of the calcite samples (CAM, CCI, CCJ and CSQ)
were purified from phosphate ores that are exploited by different mining groups. The exceptions are the opaque
and transparent calcite rhombohedra that are collection stones, which presented adequate purity to be used in the experiments (Table 1).
Calcite purification and characterization
The first purification step comprised the removal of
magnetic minerals by means of magnetic separation. The
ore samples were first submitted to a 6.0x10⁻² T magnetic
field (Inbras, HFP RE-Ø15’’x12 magnetic separator)
(1)
(2)
(3)
(4)
in order to remove magnetite (Fe3O4) particles, then to 1.2x10⁻¹ T (Inbras, RE-05/04-1 magnetic separator) to remove hematite (Fe2O3) and phlogopite (KMg3(AlSi3O10) (F,OH)2) particles.
Afterwards, calcite (density = 2.71 g cm-3) was separated from apatite (3.3 g cm-3), dolomite (2.86-3.10 g cm-3) and silicates (2.6 g cm-3) by means of heavy media separation using bromoform (CHBr3), whose density is 2.98 g cm-3. When it was necessary to reduce the bromoform density, it was diluted with ethyl alcohol (C2H6O). Each heavy media concentration step was carried out by centrifuging (FANEN, Excelsa II centrifuge) 1–5 g of ore with 25 cm3
of heavy liquid at 1.500 rpm for five minutes. Next, the sunken and floated products were thoroughly washed with
water and ethyl alcohol, and dried at 40ºC.
The heavy media separation product, containing
mainly calcite, was finally submitted to Frantz magnetic separation (Barreiro Frantz equipment) in a magnetic field
of 0.6–1.5 Tto remove composite particles. The lateral and frontal inclinations used in the Frantz equipment were 15º and 18º, respectively.
The chemical composition of calcites was determined by means of XRF(Axios Advanced Equipment, PANalytical). The Rietveld method applied to XRD data was used in order to quantify the content of calcite and impurities (apatite, dolomite and silicates). The XRD data acquisition conditions (Empyrean equipment, PANalytical)
were: Cu radiation with wavelength (γ)= 1.54 Å; automatic
divergence slit with irradiated area = 15 mm; step = 0.013
and 2ϴ = 8 to 140o.
Calcites were also submitted to Weight Loss (WL) analyses by calcination under 1,050ºC for one hour. In addition, they were characterized by their physical properties: surface area, porosity and density. Surface area and porosity were determined by mercury porosimetry (Auto Pore IV, Micromeritics equipment). The density was measured by helium pycnometry (AccuPyc II 1340, Micromeritics equipment).
Dissolution experiments
Calcite dissolution experiments were carried out in the automated chemical reactor Atlas Potassium (Syrris). The equipment allows the control and measurement of pH and
temperature, besides controlling stirring and the flow of
the addition of one gas. The dissolution is carried out in a 250 cm3 reactor. The reaction control is executed by means of the Atlas software. The experiments were conducted in CO2-free solutions. Removal of CO2 was achieved by adding N2-gas into the reaction vessel ten minutes before
dissolution (Sjöberg and Rickard, 1983, 1984). Ultrapure water (resistivity of 18.3 MΩ cm at 25oC) was used in all experiments.
The dissolution tests were carried out by means of three steps. (1) First, the water temperature (150 cm3) was
adjusted to 25oC. (2) The water pH was then adjusted to pH 8 or pH 10 by adding sodium hydroxide (NaOH) solutions at 0.005 and 0.010 mol dm3 respectively. Concurrently to
the pH adjustment, N2 was bubbled (100 ± 0.1 cm3 min -1) into the reaction vessel. (3) Finally, 1.5 g of calcite
(particle size between 103 and 43 µm) was introduced into
the reaction vessel, and dissolution took place.
The calcite dissolution experiments were accomplished by means of pH-Stat methodology, which is based on continuous addition (6.7x10⁻³ cm3 s-1) of an acidic solution (HCl) to counteract the carbonate dissolution. This way, as
time progresses, the solution pH is kept close to constant,as
is the composition of the remaining solution (Berner, 1978; Plummer, 1976; Morse, 1974; Morse, 1986; Morse and Arvidson, 2002). The HCl solution concentrations used were 0.010 mol dm-3 and 0.005 mol dm-3 for pH 8 and 10 respectively.
The dissolution curves consist of the variation of the accumulated amount of dissolved Ca2+ ions as a function of time (t). The quantity of dissolved Ca2+ ions, nCa2+ (mol cm-2) in a determined time (t) was calculated by means of Equation 8.
in which Vac (dm3) is the volume of accumulated added acidic solution, Cac (moldm-3) is the acidic solution concentration, and m is the mass of dissolved mineral. The number 2 in the denominator of Equation 8 corrects the stoichiometric relation between Ca2+ and H+ ions (Berner, 1978; Morse, 1986; Morse, 1974; Morse and Arvidson, 2002; Plummer,
Table 1. Characteristics of the calcite samples.
Origin Genesis Type Company Identification
Amorinópolis-GO sedimentary Purified from ore - CAM
Cachoeiro do
Itapemirim-ES metamorphic Purified from ore Imerys CCI
Cajati-SP igneous Purified from ore Vale CCJ
Opaque rhombohedron - Naturally pure - CRO
Transparent rhombohedron - Naturally pure - CRT
Santa Quitéria-CE metamorphic Purified from ore Brazilian Nuclear Industry
(INB) CSQ
2
2
+
=
V C
ac acnCa
Am
1976). In addition, the quantity of dissolved Ca2+ ions was normalized by the calcite surface area (cm2 g-1) in order to allow comparison between calcite samples.
Flotation experiments
The flotation response of the calcite samples was determined by means of microflotation experiments with
sodium oleate as the collector, at pH 8 and pH 10. The sodium oleate concentration of 7.11x10⁻⁶ mol dm-3 was selected based on the premise that neither very high
nor very low recoveries were convenient for the sake of comparing the flotation response of materials. The
sodium oleate solutions were made with ultra-pure water
(R = 18.2 MΩ cm at 25ºC). The solution temperatures were adjusted to 25oC before any experiments by using
a water bath. Microflotation was conducted in a modified
Hallimond tube with 32.2 mm diameter and 92.2 mm height. Agitation of 22.9 s-1was promoted by a mechanical stirring system coupled with a rotational speed controller.
Three microflotation experiments were conducted with
each apatite sample.
Flotation experiments were carried out by mixing 1.00 g of mineral (particle size between 103 µm and 43 µm) with 0.06 dm3 of sodium oleate solution at the desired pH (8 or 10). After one minute of conditioning, N2 was introduced (0.8 cm3 s-1) into the system and flotation was accomplished within a time span of one minute.
For CCJ and CCI, experiments were also conducted after bubbling (for ten minutes) gaseous mixtures of CO2 in N2 at different concentrations (0, 400 and 800 ppm) into
the microflotation cell before flotation.
RESULTS AND DISCUSSION
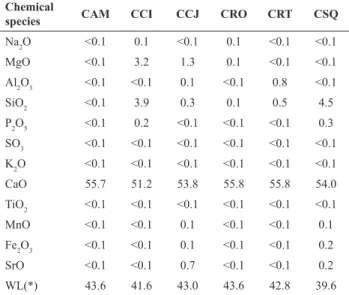
According to the calcite XRF analysis (Table 2), CAM and CRO present the greatest degree of purity since the
content of all analysed contaminants is ≤ 0.1%. The CCI
and CSQ exhibit traces of apatite, indicated by the presence
of 0.2% and 0.3% of P2O5, respectively. The existence of
MgO in CCI (3.2%) and CCJ (1.3%) might indicate the
presence of dolomite or the substitution of calcium by magnesium in the calcite lattice (magnesium calcite).
Significant content of SiO2 is observed in CCI (3.9%) and CSQ (4.5%), which is related to the presence of quartz.
The calcite mineralogical composition was determined by Rietveld semi-quantitative analysis (Table 3). The studied calcites can be organized according to a decreasing
order of purity: CAM, CRO, CRT, (~100%) > CSQ (98%) > CCJ (97%) >> CCI (91%). The main contaminants are
quartz and dolomite, which is in agreement with the XRF results (Table 2).
The calcites’ physical properties are presented in Table
4, in which it is observed that the density varied between 2.732 and 2.766 g cm-3. These values are slightly greater
than the theoretical value (2.72 g cm-3) reported by Klein and Dutrow (2011), probably due to the presence of traces of apatite and dolomite that are heavier minerals. All studied calcites presented similar porosity that varied
from 2.78% to 3.76%. Regarding the surface area, it
varied between 210 cm2 g-1 and 510 cm2 g-1. However, no relationship between area and mineral genesis was found.
All dissolution curves (accumulated Ca2+ ions = f(time))
exhibited an exponential profile, which is reported in many works (Morse, 1986; Morse and Berner, 1979; Plummer,
1976; Plummer et al., 1978; Plummer et al., 1979). This
Table 2. Calcite chemical composition (XRF analysis).
Chemical
species CAM CCI CCJ CRO CRT CSQ
Na2O <0.1 0.1 <0.1 0.1 <0.1 <0.1
MgO <0.1 3.2 1.3 0.1 <0.1 <0.1
Al2O3 <0.1 <0.1 0.1 <0.1 0.8 <0.1
SiO2 <0.1 3.9 0.3 0.1 0.5 4.5
P2O5 <0.1 0.2 <0.1 <0.1 <0.1 0.3
SO3 <0.1 <0.1 <0.1 <0.1 <0.1 <0.1
K2O <0.1 <0.1 <0.1 <0.1 <0.1 <0.1
CaO 55.7 51.2 53.8 55.8 55.8 54.0
TiO2 <0.1 <0.1 <0.1 <0.1 <0.1 <0.1
MnO <0.1 <0.1 0.1 <0.1 <0.1 0.1
Fe2O3 <0.1 <0.1 0.1 <0.1 <0.1 0.2
SrO <0.1 <0.1 0.7 <0.1 <0.1 0.2
WL(*) 43.6 41.6 43.0 43.6 42.8 39.6
(*) WL = Weight loss
Table 3. Calcite mineralogical composition (Rietveld method).
Calcite Mineralogical composition
Calcite (%) Impurities
CAM 99 Quartz
CCI 91 Dolomite, Quartz
CCJ 97 Dolomite, Quartz
CRO >99 Not detected
CRT >99 Not detected
CSQ 98 Quartz
Table 4. Physical properties of calcites.
Calcite Density (g cm-3)
Surface area (cm2 g-1)
Porosity
(%)
CAM 2.737 ± 0.007 260 3.35
CCJ 2.756 ± 0.010 310 2.78
CCI 2.766 ± 0.005 260 2.99
CRO 2.742 ± 0.002 510 3.55
CRT 2.732 ± 0.004 340 3.76
profile agrees with a first order reaction in relation to Ca2+ ions. Upon starting the reaction, the dissolved amount of Ca2+ ions increases linearly with the reaction time. After a determined period, the dissolution rate decreases until solution saturation is reached.
The dissolution curves were adjusted to Equation 9,
which allowed calculation of the maximum amount of dissolved Ca2+ ions (Ca2+
MAX) as well as the kinetic constant
(k).
The Ca2+
MAX informs the quantity of Ca
2+ ions that
dissolved after the reaction reached the steady state. The
kinetic constant expresses how fast the steady state is
reached. In addition, the initial dissolution rate (Ri) was
calculated by adjusting the first minutes of dissolution to
a straight line. The relevancy of this parameter is based
on the fact that it represents the microflotation experiment period (two minutesfor conditioning and flotation).
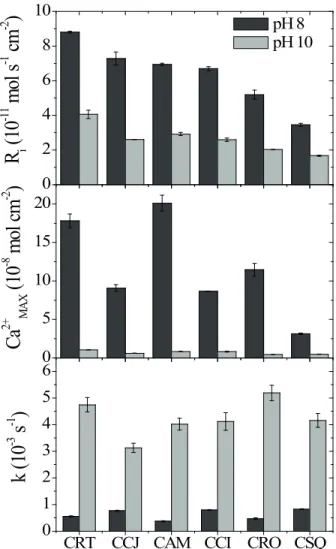
The calcite samples from different origins presented
dissimilar performance in dissolution experiments,as observed in Figure1. For CCJ, for instance,Ri decreased 3-fold (from 7.3x10⁻¹¹ to 2.6x10⁻¹¹ mol cm-2 s-1) and Ca2+
MAX declined 15-fold (from 90.8x10
-9 to 6.1x10⁻⁹ mol
cm-2) as the pH increased from 8 to 10. Therefore, at pH 8 dissolution is faster and provides more Ca2+ ions to the
solution at the steady state. Correspondingly, the kinetic
constant increased with the pH, which indicates that the steady state is attained faster as the medium becomes more basic (Figure 1). Therefore, all results corroborate the fact
that calcite dissolution decreases significantly when the pH
increases from 8 to 10.
The values of log (Ri) varied from -10.1 to -10.8, which is in agreement with the results in the literature (Morse and
Arvidson, 2002; Plummer et al., 1978; Sjöbergand Rickard,
1983, 1984). The logarithmic scale was not used in this
work in order to observe clear differences in dissolution
parameters for the compared calcites.
The floatability of different calcites at pH 8 and 10is
exhibited in Figure 2. It is observed that, independent of
the origin, floatability at pH 10 is greater than at pH 8 for
all studied calcites.Regardless of the pH, the metamorphic
calcite (CSQ) presented the lowest flotation performance
with sodium oleate.
By comparing dissolution and flotation results at different pH, it can be seen that although the kinetic
parameters indicate that there are more Ca2+ ions available to interact with oleate molecules at pH 8 than at pH 10,
the flotation performance at pH 10 is superior to that at
pH 8 for all the calcites. The oleate (RCOO-) molecule concentration does not vary with pH at pH > 7.8 (Guan,
2009). Thus, the influence of oleate concentration cannot
explain the observed behaviour.
Literature provides evidence that the acid-oleate dimer (RCOO)22- and ion-molecular complex (RCOO)
2H - play
0 2 4 6 8 10
R
i(
10
-11
mo
l s
-1
cm
-2
)
pH 8pH 10
CRT CCJ CAM CCI CRO CSQ
0 1 2 3 4 5 6
Calcite
k (
10
-3
s
-1)
0 5 10 15 20
Ca
2+ MA
X
(
10
-8
mo
l c
m
-2
)
Figure 1. Calcite dissolution parameters: Initial rate (Ri), maximum quantity of dissolved Ca2+ ions (Ca2+
MAX) and kinetic constant (k).
CRT CAM CCI CRO CCJ CSQ
0 20 40 60 80 100
F
(%)
Calcite
pH 8 pH 10
Figure 2. Calcite microflotation response with sodium oleate
(7.11x10⁻⁶mol dm-3).
(
)
2+
=
2+1
−
−kt MAX0 200 400 600 800 20
30 40 50 60
F
(%)
[CO
2] / ppm
CCHCCJ
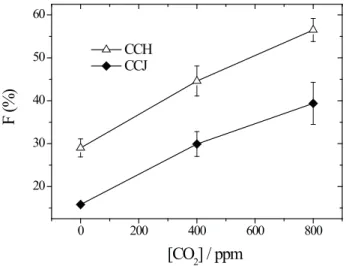
Figure 3. Calcite floatability with sodium oleate (7.11x10⁻⁶mol L-1) at pH 8 under different CO
2 concentrations.
4
8
12
16
20
2
3
4
0
20
40
60
80
100
0,4
0,6
0,8
1,0
2
3
4
5
6
7
8
9
0
20
40
60
80
100
CRT
CCJ CAM CCI
CRO
CSQ
Ca
2+MAX(10
-8mol cm
-2)
CRT
CAM CCI CRO
CSQ
CCJ
F
pH
10
(%
)
R
i(10
-11mol s
-1cm
-2)
Ca
2+MAX
(10
-8
mol cm
-2)
CSQ CCJ CROCCI
CAM CRT
CSQ CRO
CCJ CCI
CAM
R
i(10
-11mol s
-1cm
-2)
F p
H
8
(
%
)
CRT
Figure 4. Floatability (F) as a function of the dissolution parameters Ri (initial rate) and Ca2+
MAX (maximum amount of dissolved calcium
an important role in the adsorption of oleate on sparingly soluble minerals (Free and Miller, 1996; Lu et al., 1998; Pugh and Stenius, 1985). Lu et al. (1998) observed that the oleate adsorption on apatite is greater at pH 9.5 than at pH 8.0 by using FTIR measurements. It was proposed that chemisorption dominates at pH 9.5; however, at pH 8.0 (RCOO)2H– adsorption and precipitation of calcium
dioleate onto the mineral surface takes place.
Nevertheless,the flotation response of calcite at pH 8 and 10 was evaluated in this work considering the possible influence of the CO2 present in the air and the
carbonate/bicarbonate system species. With the objective of understanding this influence, it is necessary to consider that the microflotation experiments were conducted in an
environment with air CO2 concentration varying from 400
to 500 ppm. Therefore, the flotation solution was fed by
carbonate/bicarbonate ions from the air and from the calcite dissolution. Conversely, since the dissolution experiments were carried out in the absence of CO2, the carbonate/ bicarbonate ions were provided by calcite dissolution only.
The flotation response with sodium oleate (7.11x10⁻⁶ mol dm-3) at pH 8 for CCJ and CCI in the presence of CO
2 is
illustrated in Figure 3. It is observed that calcite floatability
increases with the CO2 concentration. This result is in agreement with many studies in the literature (Bernerand Morse, 1974; Morse and Berner, 1979; Plummer at al., 1978; Plummer et al., 1979).
Therefore, it is evident that the carbonate/bicarbonate ions furnished not only by the calcite dissolution, but also from the CO2 present in the air, can influence the calcite
flotation performance. Nevertheless, it is observed that the floatability of CCI is higher than that of CCJ under all
studied conditions (Figure 3), which is in agreement with the tendency found in Figure 2.
The influence of dissolution on the flotation response of calcite samples from different origins was analysed by means of linear associations between floatability and dissolution parameters (Figure 4). The most significant correlations are those obtained between floatability and the
parameters Ri and Ca2+
MAX at both studied pH values (8 and 10).
The calcite floatability increases with Ri at pH 8 (R = 0.62) and pH 10 (R = 0.66), indicating that the calcite, which
dissolves quicker, exhibits higher flotation performance.
Floatability also enhances as Ca2+
MAX increases at pH 8 (R = 0.63) and pH 10 (R = 0.70), suggesting that the higher the maximum amount of Ca2+ ions dissolved at the steady
state, the higher the floatability. Nevertheless, k seems not to be linearly related with calcite floatability (R = -0.23 at
pH 8 and R = -0.38 at pH 10).This result agrees with the
work of Horta et al. (2016), who found that by comparing apatite samples from different origins the floatability
increases with Ri and Ca2+
MAX. The results indicate that
the flotation performance is improved by an increase in
the quantity of Ca2+ ions that are available to interact with oleate molecules.
The found results (Figure 4) support the surface precipitation mechanism of oleate adsorption onto the solid/liquid interface. This mechanism states that calcium oleate is formed due to the interaction between dissolved Ca2+ ions and RCOO- (oleate ions) near the calcite surface,according to the reaction presented in Equation 10.
2RCOO- + Ca2+ = (RCOO) 2Ca
Thecalcium oleate then precipitates at the calcite surface, covering the particles, which promotes hydrophobicity and
consequent flotation (Hanna and Somasundaran, 1976; Finkelstein, 1989; Lu et al., 1998; Young and Miller, 2000).
CONCLUSIONS
The flotation response of calcites was observed to
be higher at pH 10 than at pH 8, although the mineral dissolution presented a greater initial rate at pH 8 when compared with pH 10. This result indicatesa possible
influence ofthe carbonate/bicarbonate ions provided by the air on the calcite flotation performance. This statement is supported by previous microflotation results conducted
after the introduction of CO2 into the flotation cell.
By comparing calcites of different origins and genesis, it was found that the flotation performance with sodium
oleate increases as the quantity of dissolved Ca2+ ions grows. This result emphasizes the relevance of the surface precipitation mechanism in the adsorption of fatty acid molecules on the calcite surface.
ACKNOWLEDGEMENTS
The authors are grateful to the Vale Company that
financially supported this research by means of the AMIRA P260F project. We are also grateful to PANalytical Laboratory in which the x-ray Diffraction analyses were
accomplished and to Professor Dr. Carlos O. Paiva-Santos and Dra Selma Gutierrez Antonio, who assisted with the Rietveld analyses.
REFERENCES
Abdel-Khalek, N. S. A. Evaluation of flotation strategies for sedimentary phosphates with siliceous and carbonates gangues. Minerals Engineering, 13, p. 789-793 (2000). Abouzeid, A. Z. M. Physical and thermal treatment of
phosphate ores – An overview. International Journal of Mineral Processing, 85, p. 59-84 (2008).
Amankonah J. O.; Somasundaran, P. and Ananthapadmanabhan, K. P. Effects of dissolved
mineral species on the dissolution/precipitation characteristics of calcite and apatite. Colloids and Surfaces, 15, p. 295-307 (1985).
Arvidson, R. S.; Ertan, I. E.; Amonette, J. E. and Luttge A. Variation in calcite dissolution rates: A fundamental problem?. Cheochimica et Cosmochimica Acta, 67, p. 1623-1634 (2002).
Berner, R. A. Rate control of mineral dissolution under earth surface conditions. American Journal of Science, 278, p. 1235-1252 (1978).
Berner, R. A. and Morse, J. W. Dissolution kinetics of
calcium carbonate in sea water IV: Theory of calcite dissolution. American Journal of Science, 174, p. 108-134 (1974).
Cao, Q.; Cheng, J.; Wen, S.; Li, C.; Bai, S. and Liu, D.
A mixed collector system for phosphate flotation.
Minerals Engineering, 78, p. 114-121 (2015).
Finkelstein, N. P. Review of the interactions in flotation
of sparingly soluble calcium minerals with anionic collectors. Trans. Inst. Min. Metall., Sect. C, 988, p. 157-78 (1989).
Free, M. L.; Miller, J. D. The significance of collector colloid adsorption phenomena in the fluorite/oleate flotation system as revealed by FTIR/IRS and solution
chemistry analysis. International Journal of Mineral Processing, 48, p. 197-216 (1996).
Hanna, H. S. and Somasundaran, P. Flotation of salt-type minerals, In: Fuerstenau, M.C. Flotation: Gaudin
Memorial Volume. New York: American Institute
of Mining, Metallurgical, and Petroleum Engineers, p.197-272 (1976).
Horta, D.G., Efeito da Cristalinidade e da cinética de
dissolução no desempenho da flotação de apatitas e
Calcitas. PhD diss., University of Sao Paulo (2013). Horta, D. G.; Leal Filho, L. S. Separation between
phosphates and carbonates. Melbourne: AMIRA P260F, November (Progress report), p. 59-73 (2012). Klein, C. and Dutrow, B. Mineral Science. 23rd ed. Jay
O’Callaghan, United States of America (2011).
Horta, D. G.; de Mello Monte, M. B.; Leal Filho, e L. S.
The effect of dissolution kinetics on flotation response
of apatite with sodium oleate. International Journal of Mineral Processing, 146, p. 97–104 (2016).
Leal Filho, L. S.; Martins, M. and Horta, D. G. Concentration
of igneous phosphate ores via froth flotation: Challenges
and developments. In: International Mineral Processing Congress, 25, Brisbane, p. 3-13 (2010).
Lu, Y.; Drelich, J. and Miller, D. Oleate adsorption at
an apatite surface studied by ex-situ FTIR internal
reflection spectroscopy. Journal of Colloid and Interface
Science, 202, p. 462-476 (1998).
Morse, J. W. Dissolution kinetics of calcium carbonate in sea water V: Effects of natural inhibitors and the
position of the chemical lysocline. American Journal of Science, 274, p. 338-347 (1974).
Morse, J. W. The surface chemistry of calcium carbonate minerals in natural waters: An overview. Marine Chemistry, 20, p. 91-112 (1986).
Morse, J. W. and Arvidson, R. S. The dissolution kinetics of major sedimentary carbonate minerals. Earth-Science
Reviews, 58, p. 51-84 (2002).
Morse, J. W. and Berner, R. A. Chemistry of calcium carbonate in the deep oceans. In: Jenne, E. A. Chemical Modeling in Aqueous System. England: American Chemical Society, Cap. 21, p. 499-535 (1979).
Peng, C.; Crawshaw, J. P.; Maitland, G. C. and Trusler, J. P. M. Kinetics of calcite dissolution in CO2-saturated water at temperatures between (323 and 273) K and pressures up to 13.8 MPa. Chemical Geology, 403, p. 74-85 (2015).
Plummer, L. N. The dissolution of calcite in CO2-saturated solutions at 25oC and 1 atmosphere total pressure. Geochimica et Cosmochimica Acta, 40, p. 191-202 (1976).
Plummer, L. N.; Wigley, T. M. L. and Parkhurst, D. L. The kinetics of calcite dissolution in CO2-water systems at 5oC to 60oC and 0 to 1 atm CO
2. American Journal of Science, 278, p. 179-216 (1978).
Plummer, L. N.; ParKhurst, D. L. and Wigley, T. M. L.
Critical review of the kinetics of calcite dissolution
and precipitation. In: Jenne, E. A. Chemical Modeling in Aqueous System. England: American Chemical Society, Cap. 25, p. 537-573 (1979).
Pugh, G. B.; Holmgren, A.; Forsling, W. Solution chemistry
studies and flotation behaviors of apatite, calcite and fluorite minerals with sodium oleate collector.
International Journal of Mineral Processing, 15, p. 193-218 (1985).
Sis, H. and Chander, S. Reagents used in the flotation of
phosphate ores: A critical review. Minerals Engineering, 16, p. 577-585 (2003a).
Sis, H. and Chander, S. Improving froth characteristics
and flotation recovery of phosphate ores with nonionic
surfactants. Minerals Engineering, 16, p. 587-595 (2003b).
Sjöberg, E. L.; Rickard, D. The influence of experimental
design on the rate of calcite dissolution. Geochimica et Cosmochimica Acta, 47, p. 2281-2285 (1983).
Sjöberg, E. L.; Rickard, D. Calcite dissolution kinetics:
Surface specitation and the origin of the variable pH dependence. Chemical Geology, 42, p. 119-136 (1984).
Young, C.A., Miller, J.D., Effect of temperature on oleate