Hair cell alteration prevalence rates in students of a school in
Distrito Federal
Abstract
Valéria Gomes da Silva1, André Luiz Lopes Sampaio2, Carlos Augusto Costa Pires de Oliveira3, Pedro Luiz Tauil4, Glaucia Magalhães Brito Jansen5
1 MSc (Speech and Hearing Therapist).
2 PhD (Associate MD in the Cochlear Implant Department of the University of Brasilia, Brazil). 3 PhD (Professor of the University of Brasilia, Brazil).
4 PhD (Professor in the Graduate Program on Tropical Medicine of the Medical School of the University of Brasilia). 5 Graduate student, Audiology (Speech and Hearing Therapist).
Send correspondence to: Valéria Gomes da Silva. Quadra 301, conj. 8, apto. 1003. Residencial Casa Bella. Águas Claras - DF. Brazil. CEP: 71902-180. Paper submited to the BJORL-SGP (Publishing Management System - Brazilian Journal of Otorhinolaryngology) on February 26, 2012;
and accepted on March 31, 2012. cod. 9059.
E
xposure to loud music is increasing among young people, and so could be the number of hearing impairment cases in this population. Otoacoustic emission tests are sensitive in capturing the effects of exposure to noise, and allow the detection of early cochlear disorders.Objective: This study aims to look into the prevalence rates of injuries to outer hair cells in a population of students through otoacoustic emission testing.
Materials and Method: One-hundred and thirty-four subjects were submitted to transient evoked and distortion product otoacoustic emission tests. Subjects were assessed on a “pass/fail” scale. This is a cross-sectional descriptive study on prevalence rates.
Results: More than four fifths (80.6%) of the 134 subjects had altered transient otoacoustic emissions, most of whom were males; 97.8% had altered distortion product otoacoustic emissions and 79.9% had altered test results in both transient evoked and distortion product OAEs; most were males; 94.0% reported they used earphones; and 82.8% stated they frequented places where loud music was played.
Conclusion: The high prevalence rates of altered test results seem to indicate the presence of early cochlear disorders in the studied subjects. A significant number of subjects reported exposure to loud music, a habit that may be conducive to the onset of cochlear disorders.
ORIGINAL ARTICLE Braz J Otorhinolaryngol.
2012;78(4):91-7.
BJORL
.orgKeywords:
adolescent health, hair cells, auditory, outer,
INTRODUCTION
A lot has been said in the media about hearing and possible cases of hearing loss in young people connected to exposure to noise.
Young people are increasingly exposed to noise. What many may not know is that even sporadic exposure to noise can produce significant harm and alter a person’s physical and mental welfare1.
The human hearing apparatus is extremely vulner-able to noise. In high intensity levels, noise may impair hearing and one’s general health status2.
Among the agents noxious to hearing, noise is considered a significant factor in the increasing rates of hearing impairment and one of the main causes for sen-sorineural hearing loss in adults3-5. Young populations are
still being studied.
The idea that hearing loss by exposure to noise is connected only to adults (the elderly) or that it is specific to occupational circumstances must be reviewed. The audiograms of young people with hearing loss share the same characteristics of audiograms of people with noise-induced hearing loss6,7.
The use of earphones is widespread, especially among young people who use them for entertainment and leisure. Other practices appreciated by young people such as listening to loud music, wearing cell phone or MP3 player earbuds, going often to music concerts, clubs, and gyms may be harming their auditory health. These activities may be pleasurable, but are deemed noxious to hearing when performed without moderation8.
Assessment and monitoring of hearing loss is usu-ally done through pure-tone audiometry. However, oto-acoustic emissions (OAEs) are more sensitive for adverse events related to exposure to noise and allow the early detection of cochlear alteration before pure-tone audiom-etry. OAEs enable the specific assessment of outer hair cell function. OAE tests are non-invasive, sensitive for cochlear status, and do not introduce discomfort or risks to the patient: they are easy to perform, painless, widely applicable2,9-11.
Considering the effects of noise upon the cochlea and the preventive character of evoked otoacoustic emis-sions in auditory monitoring, this study was carried out to assess outer hair cell function through the examination of otoacoustic emissions in a group of students from Distrito Federal to find the prevalence rates of altered test results in the sample.
MATERIALS AND METHODS
This cross-sectional descriptive study on prevalence rates was approved by the Ethics Committee and given permit nº 060/2008.
A sample of 144 middle school students of both genders from a private school in Distrito Federal was randomly selected between April and May of 2010. Ten individuals were excluded for middle ear alterations. Therefore, the data collected reflect the reality of 134 sub-jects, 56 males and 78 females with ages ranging between 14 and 19 years.
The enrollment criteria included: absence of otologi-cal complaints and symptoms; no history of hearing loss; not taking ototoxic medication; not using hearing aids; not having middle or outer ear problems such as ear wax and infection. A questionnaire was given to study prospects to find out where subjects stood on matters pertaining to enrollment criteria, their hearing habits, ear diseases, hearing loss and others.
Data collection took place at the student’s school. Their ear canals were inspected for ear wax and other find-ings that could interfere with test procedures. Subjects were then submitted to transient evoked and distortion product OAE tests on a portable MAICO device model ERO-SCAN made in 2006. Tests were done in a quiet environment and right ears were tested first.
Transient evoked OAE testing considered normal or “Pass” results when amplitudes were equal to or greater than -12 and signal to noise ratios were equal to or greater than 6 dB on all six tested frequencies (1.5 kHz-4 kHz). Distortion product OAE testing considered normal or “Pass” results when amplitudes were equal to or greater than -5 and signal to noise ratios were equal to or greater than 6 dB on all six tested frequencies (2 kHz-12 kHz). The results of both TEOAE and DPOAE were analyzed together and results were categorized as “FAIL” when alteration on at least one ear was seen on either of the tests.
The variables studied for statistical analysis pur-poses were signal amplitude, signal to noise ratio, gender, and ear side. Results were reported in the form of mean, minimum and maximum values, standard deviation, and absolute values (n).
The possible differences in the mean ages of subjects of each gender were investigated using Student’s t-test. The chi-square test (Fisher’s exact test) was used to analyze the prevalence rates seen in TEOAE and DPOAE tests for criterion “pass/fail” for gender and both ears.
The correlation between prevalence of failed results for signal amplitude on each ear and frequency analyzed on TEOAEs was assessed through Pearson’s correlation. The same test was used to analyze the signal to noise ratio on DPOAEs.
T h e a s s o c i a t i o n b e t w e e n p r e v a l e n c e o f failed results on both tests (TEOAE and DPOAE) and gender was analyzed using the chi-square test (Fisher’s exact test). The same test was used to assess the association between gender and exposure to loud music. Statistical significance level was set at 5% (p = 0.05). All tests were bicaudal.
I n o r d e r t o a l l o w t h e s t u d y o f p r e v a -lence rates, the size of the sample was calculated for a 95% confidence interval, and the estimated preva-lence for OHC alteration of 90% resulted in a sample of 121 subjects.
RESULTS
The analysis of TEOAE results revealed that only 19.4% (26) participants passed the test with both ears; 29.9% (40) passed only with their left ears; 29.1% (39) passed with their right ears; 80.6% (108) failed on both ears; 70.1% (94) failed on their left ears; and 70.9% (95) failed on their right ears.
Considering gender, TEOAE results showed that 28.2% (22) of the females enrolled in the study passed the test and 71.8% (56) failed. In the male group, 7.1% (4) passed and 92.9% (52) failed. In the entire group of subjects, 80.6% (108) failed the TEOAE test.
Statistically significant difference was found for vari-able gender and presence of altered TEOAE test results. The percentage of males failing the test was significantly greater than the percentage of females (p = 0.003).
Statistically significant difference was found when the distribution of signal amplitude on TEOAE was ana-lyzed for gender. Female participants had greater levels of signal amplitude than their male counterparts (p < 0.001) (Figure 1).
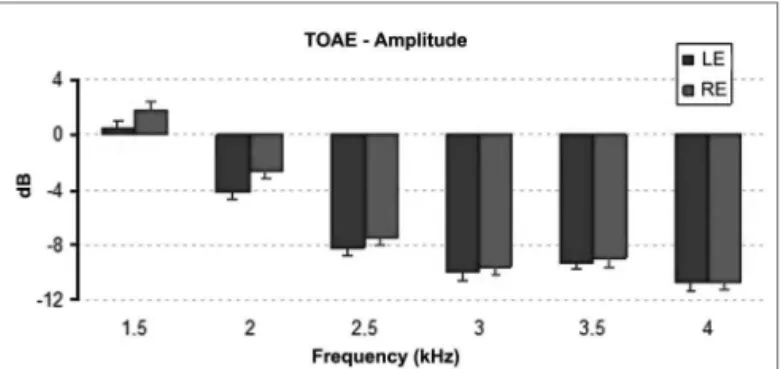
ANOVA for repeated measurements revealed statistically significant differences between mean signal amplitudes of right and left ear TEOAE results (p = 0.009). On average, the amplitudes recorded for right ears were greater than the values for left ears (Figure 2).
Figure 1. Mean and standard deviation values of the TOAE amplitu
-des recorded for each gender in each frequency. F: Female; M: Male.
ANOVA Test, p < 0.001.
Figure 2. Mean and standard deviation values of the TOAE amplitudes recorded for each ear in each frequency. LE: Left Ear; RE: Right Ear.
ANOVA test, p = 0.009.
The distribution of signal to noise ratios on TEOAE tests elicited statistically significant differences between genders. Female participants had higher signal to noise ratios than males (p < 0.001) (Figure 3). Statistically sig-nificant difference was also seen between the signal to noise ratios recorded for right and left ears (p = 0.022). Right ears had significantly higher mean signal to noise ratios (Figure 4).
Figure 3. Mean and standard deviation values of the signal/noise ratio of the TOAE recorded for each gender in each frequency. S/N: signal/
noise ratio; F: Female; M: Male. ANOVA test, p < 0.001.
The analysis of percent failed TEOAE test results for signal amplitude on each frequency and for each ear revealed a positive linear correlation between frequency and percent failed test results on left ears (p = 0.004) and right ears (p = 0.003), stressing a trend in which the higher the frequency the higher the percentage of failed tests. Likewise, the assessment of signal to noise ratios also revealed a relationship between frequency and percent failed tests on both ears. On left (p = 0.042) and right ears (p = 0.001) a trend of increased number of failed tests was observed as frequencies were increased.
The “pass/fail” analysis of distortion product oto-acoustic emission tests showed that 2.2% (3) participants passed on both ears; 8.2% (11) passed on left ears; and 7.5% (10) passed on right ears. However, 97.8% (131) failed on both ears; 91.8% (123) failed on left ears; and 92.5% (124) on right ears.
The analysis of gender and DPOAE test results revealed that none of the male participants passed and only 3.8% (3) females passed. Among the failed DPOAE tests, 97.8% (131) of the participants failed in at least one ear. There was no statistically significant difference between genders and presence of altered DPOAE test results (p = 0.256).
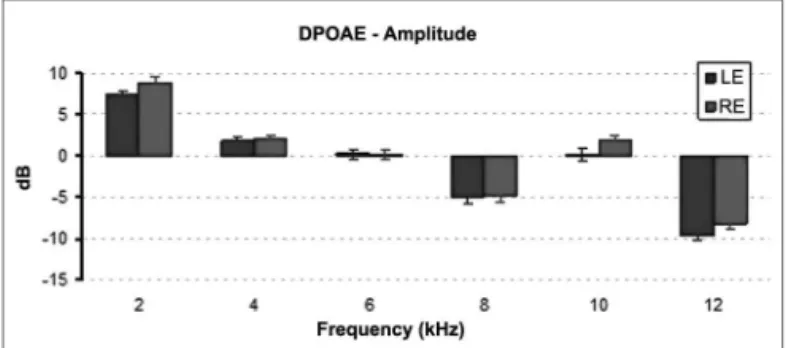
The analysis of signal amplitudes for each fre-quency showed that the lower values for left ears were found in the 8 kHz and 12 kHz bands. The signal to noise ratios for left ears were within normal stan-dards, except for the 12 kHz band. Right ears showed similar results when mean amplitudes and signal to noise ratios for each frequency were analyzed. Lower amplitude values were also observed in the 8 kHz and 12 kHz bands and in the 12 kHz for signal to noise ratios. On right ears, amplitude and signal to noise ratios at 12 kHz were altered.
Statistically significant difference was found when the distribution of signal amplitudes on DPOAE between genders was compared. Females had higher signal ampli-tude than males (p < 0.007) (Figure 5).
Statistically significant difference was also found in the DPOAE mean signal amplitudes of right and left ears (p = 0.017). The mean signal amplitudes recorded on right ears were significantly higher than the values see on left ears (Figure 6).
Figure 5. Mean and standard deviation values of the DPOAE amplitu
-des recorded for each gender in each frequency. F: Female; M: Male.
ANOVA Test, p < 0.007.
Figure 6. Mean and standard deviation values of the DPOAE amplitudes
recorded for each ear in each frequency. LE: Left Ear; RE: Right Ear.
ANOVA test, p = 0.017.
The distribution of signal to noise ratios on DPOAE tests elicited statistically significant differences when genders were compared. Female subjects had higher sig-nal to noise ratios than males (p < 0.013) (Figure 7). No statistically significant difference was found between ears (p = 0.499) (Figure 8).
Figure 7. Mean and standard deviation values of the signal/noise ratio of the TOAE recorded for each gender in each frequency. S/N: signal/
noise ratio; F: Female; M: Male. ANOVA test, p < 0.013.
Figure 8. Mean and standard deviation values of the signal/noise ratio of the TOAE recorded for each ear in each frequency. S/N: signal/noise
The analysis of DPOAE failed tests and signal amplitude on each frequency and ear side showed a statistically significant correlation between frequency and failed tests on left ears (p = 0.008) and right ears (p = 0.003), revealing that the higher the frequency the greater the number of failed tests. The same trend was observed in the analysis of signal to noise ratios. Both right and left ears had more failed tests in higher frequen-cies.
The combined analysis of transient evoked and distortion product otoacoustic emissions resulted in the following: 79.9% of the 134 (107) failed both on TEOAE and DPOAE tests in at least one ear. In the fe-male group (78), 29.5% (23) passed and 70.5% (55) failed. In the male group (56), 7.1% (4) passed and 92.9% (52) failed.
The possible association between gender and failed test results was tested. The chi-square test revealed that more males failed the test than females (p = 0.002).
In terms of exposure to loud music, 94.0% of the 134 (126) wear earphones and 82.8% (111) reported they frequented places where loud music was played. There was no statistically significant correlation between gender and use of earphones (p = 0.278), gender and frequenting places where loud music is played (p = 0.163), or use of earphones and frequenting places where loud music is played (p = 625).
DISCUSSION
Some authors have made reference to the sensitivity of TEOAEs in detecting subtle cochlear alterations from exposure to noise2,12,13. The presence of TEOAEs suggests
that most thresholds is within normal standards and, con-versely, their absence may indicate OHC involvement14.
Our subjects are young and assumedly have normal hearing, thus the sensitivity of TEOAE assessment was a considerable factor.
A lower number of alterations was expected. Given that the subjects were not assessed through audiometry and assuming their hearing thresholds are normal, the percentages found showed that the absence of TEOAEs may occur even in patients with supposedly normal hear-ing thresholds.
Other studies have found higher percentages of nor-mal results than ours, but the assessment criteria adopted by their authors was less strict as they took only the signal to noise ratio into account15.
Amplitude records in the TEOAE test signal of both ears had negative values for the most part. Conse-quently, the mean amplitude values in both ears were also negative in almost all frequencies, except for the 1,500 kHz band.
The consistently negative values observed in TEOAE test signal amplitudes were inferred to be a characteris-tic of the energy of the TEOAE spectrum measured by the device used in this study, given the recommended amplitude minimum negative value of -12 dBNPS. Other authors have also observed negative amplitude values in TEOAE tests15,16.
TEOAE amplitude may vary as a function of age, gender, and ear side. It may also be affected by the level of external ambient noise or internal (individual) noise, and stimulation sound pressure levels. The higher the age the lower the response amplitude; in neonates amplitude values reach about 20 dB, 10 dB in young adults, and 6 dB in elderly subjects17. This aspect was not considered
in this study, as subjects were within closer age ranges. A correlation between increases in frequency and decreases in signal amplitudes was observed in this and in another study15. The decrease in TEOAE amplitudes at
higher frequencies may be related to middle ear filtering properties and short latencies seen in higher frequencies, which hamper recording through the device’s micro-phone18.
No other references with the same analysis criteria or with negative TEOAE amplitudes were found in the literature. Thus, the description of the findings of this study may serve as a source of data for other studies in which the total energy of the signal amplitude spectrum is analyzed or in which the same OAE measurement de-vice is used.
The comparison of the mean amplitude values seen in TEOAE signal tests for right and left ears revealed that higher amplitude values were recorded in right ears and female subjects, a finding consistent with the literature17.
Some authors have discussed that higher right ear TEOAE amplitudes may be related to the impact of spontaneous otoacoustic emissions; SOAEs are generally bilateral, but when they manifest unilaterally they are more frequently seen in right ears17,19. However, in the references
included in this study, asymmetric TEOAE measurements is not mentioned. In general terms, TEOAEs behaved sym-metrically in both ears2,14,20-22.
In this paper, the values recorded in signal to noise ratios were positive for most frequencies. As seen in TEOAE amplitudes, the signal to noise ratios were different at 4 kHz in both ears. Lower signal to noise ratios were observed at 4 kHz, supporting the idea that it is difficult to record TEOAEs in higher frequencies due to middle ear properties and the shorter latencies seen in these frequencies18.
DPOAEs also showed a high number of failed tests. The prevalence rate of altered distortion product otoacous-tic emissions in right ears was 92.5% and 91.8% in left ears, leading to a combined total of 97.8% of failed results.
Another study performed on subjects exposed to loud music after sports activity revealed a higher percent-age of normal results (75%) than ours (2.2%). However, the assessment was not as precisely described23.
A study done on adolescents revealed a significant percentage of altered results (63%)24. The rates reported
in this study were higher than the rates reported in other studies, and significant differences were also seen in the findings of this study when compared to others cited herein, possibly due to methodological differences.
It has also been considered that this difference may be due to the use of stricter criteria and the assessment of high frequencies in this study, given that more altered results were seen at 12 kHz. However, this finding may indicate earlier cochlear disorder.
TEOAE mean amplitudes were reduced as frequen-cies were reduced, as also seen in other studies15,25. Other
authors have reported difficulty recording high frequencies in TEOAEs18. It is believed that in the case of DPOAEs there
is a correlation between short latency at high frequencies and difficulty capturing DPOAEs through the otoacoustic emission analyzer’s microphone.
In this study, the mean amplitudes in right ears were significantly greater than the values seen in left ears as. As seen on TEOAE amplitudes, when left and right ears were analyzed the DPOAE amplitudes at 8 and 12 kHz were significantly lower than the amplitudes seen in other frequencies.
The idea that lower amplitudes could be indicative of early cochlear involvement was considered, once lower signal amplitudes and signal to noise ratios occur at higher frequencies. And it may be considered that such cochlear areas may be affected by noise26. Despite the lack of other
justifications for this fact, this data cannot be considered by itself. Further studies need to be carried out to look into records of DPOAE absolute amplitudes in subjects using high frequencies (above 8 kHz).
Mean signal to noise ratios were higher in frequen-cies below 12 kHz, except for the 8 kHz band. In both ears, mean signal to noise ratios were lower at 12 kHz (4.1 on left ears and 4.5 on right ears).
Therefore, this finding may be related to the onset of early cochlear involvement in adolescents, given that
another study27 also found that higher frequencies were
more affected by the deleterious impact of exposure to noise.
As done on TEOAEs, the prevalence of failed results on DPOAEs was analyzed for ear side and gender in con-nection to the verification of two parameters: signal ampli-tude and signal to noise ratios in all six frequency bands. Frequency is a more specific parameter in DPOAEs, and cochlear function can be assessed from the basal to the apical turn of the cochlea. Response at lower frequencies is harder to measure due to the presence of ambient and internal noise, as seen by the lower signal to noise ratio at 2 kHz. These emissions provide for more accurate informa-tion at higher frequencies (above 2 kHz). Responses at 8 kHz are generally not good. In this scenario, a loudspeaker with more voltage - and thus more distortion - is needed17.
This study observed decreased responses at 8 kHz, pos-sibly due to the reasons mentioned above.
The combined TEOAE and DPOAE test results showed a surprisingly high number of “Fail” ratings (79.9%), with little variation between ears. The analysis of the data in this study revealed that the percent occur-rence of alterations in both TEOAE and DPOAE tests may vary significantly. It is assumed that this variability may be connected to methodological aspects, to the parameters used, and the criteria selected for analysis.
The supposed alterations on outer hair cells found in the TEOAE and DPOAE tests are not sufficient to change audiometric thresholds; injuries in up to 30% of the outer hair cells with preserved inner hair cells may occur before any hearing loss is detected19,28.
Therefore, OAEs are effective in assessing early cochlear function (OHC) in subjects exposed to noise without a diagnosis of hearing loss. It is recommended that this test be added to the clinical routine to aid in the diagnosis of cochlear alteration in subjects exposed to noise, as is the case of individuals exposed to loud music.
In this study, the results related to exposure of adolescents to loud music suggest that the youth seems to be unworried about the harmful effects of loud music as confirmed by the high prevalence of exposure to loud music.
Almost all adolescents reported they had the habit of wearing earphones and frequenting places where loud music was played. One hundred and twenty-six (94.0%) individuals said they wore earphones and 111 (82.8%) reported going to places where loud music was played. Another study described lower rates of individuals wear-ing earphones (76%) when compared to subjects gowear-ing to places where loud music was played (91%)24.
factor in cases of hearing loss29. The results reported in this
study may reflect the lack of awareness among the youth on the issues related to noise and its effects.
This study looked into only the habits of wearing ear-phones and frequenting places where loud music was played. Nonetheless, other studies have analyzed other habits (such as playing sports, musical instruments, working out at gyms etc) connected to young people8,30. However, the habit of listening
to music while wearing earphones is more common among young people. The findings in this study confirm this data and reveal that the number of adolescents wearing earphones is greater than the number of young people frequenting places where loud music is played, as also seen in the literature31,32.
This habit is growing in popularity among adolescents as is the possible risk it poses to hearing.
CONCLUSION
According to the results described in this study, a significant portion of the tested subjects had altered tran-sient evoked and distortion product otoacoustic emissions in at least one of their ears. The amplitudes recorded were higher among females and in right ears in both tests, and failed results were more prevalent among males. Most teens wear earphones and frequent places where loud music is played.
REFERENCES
1. Nudelmann AA, Costa EA, Seligman E, Ibañez RN. PAIR Perda Auditiva Induzida por Ruído. Rio de Janeiro: Revinter; 2001. p.79-84. 2. Barros SMS, Frota S, Atherino CCT, Osterne F. The efficiency of
otoacoustic emissions and pure-tone audiometry in the detection of temporary auditory changes after exposure to high sound pressure levels. Braz J Otorhinolaryngol. 2007;73(5):592-8.
3. Rabinowitz P. Noise-induced hearing loss. Am Fam Physician. 2000;61(9):2749-56.
4. Daniel E. Noise and hearing loss: a review. J Sch Health. 2007;77(5):225-31.
5. Sliwinska-Kowalska M, Kotylo P. Evaluation of individuals with known or suspected noise damage to hearing. Audiol Med. 2007;5(1):54-65. 6. Silveira JAM, Brandão ALA, De Rossi J, Ferreira LLA, Name MAM,
Estefan P, et al. Avaliação da alteração auditiva provocada pelo uso do walkman, por meio da audiometria tonal e das emissões oto-acústicas (produtos de distorção): estudo de 40 orelhas. Rev Bras Otorrinolaringol. 2001;67(5):650-4.
7. Dias A, Cordeiro R, Corrente JE, Gonçalves CGO. Associação entre perda auditiva induzida pelo ruído e zumbidos. Cad Saúde Pública. 2006;22(1):63-8.
8. Wazen SRG, Russo ICP. Estudo da audição e dos hábitos auditi-vos de jovens do Município de Sorocaba - São Paulo. Pró-Fono. 2004;16(1):83-94.
9. Muniz L, Caldas N, Caldas NS, Lewis DR, Dóris R, Lessa F. Estudo das amplitudes das emissões otoacústicas em indivíduos exposto ao ruído de trios elétricos. An Fac Med Univ Fed Pernamb. 2001;46(1):28-31. 10. Marques FP, Costa EA. Exposure to occupational noise: otoacoustic
emissions test alterations. Braz J Otorhinolaryngol. 2006;72(3):362-6. 11. Vasconcelos RM, Serra LSM, Aragão VMF. Transient evoked otoa-custic emissions and distortion product in school children. Braz J Otorhinolaryngol. 2008;74(4):503-7.
12. Barboni M, Geralde AT, Goffi-Gomez MVS, Schultz C, Liberman PHP. Variação teste-reteste da amplitude das emissões otoacústicas transientes evocadas em indivíduos normais. Arq Int Otorrinolaringol. 2006;10(2):119-24.
13. Momensohn-Santos TM, Russo ICP, Assayag FM, Lopes LQ. De-terminação dos limiares tonais por via aérea e por via óssea. In: Momensohn-Santos TM, Russo ICP (orgs). Prática da audiologia clínica. 6ª ed. São Paulo: Cortez; 2007. p.67-95.
14. Fiorini AC, Fischer FM. Expostos e não expostos a ruído ocupacional: estudo dos hábitos sonoros, entalhe audiométrico e teste de emissões otoacústicas evocadas por estímulos transientes. Distúrb Comun. 2004;16(3):371-83.
15. Oliveira TMT, Vieira MM, Azevedo MF. Emissões otoacústicas em trabalhadores normo-ouvintes expostos ao ruído ocupacional. Pró--Fono. 2001;13(1):17-22.
16. Souza DV. Estudo comparativo das emissões otoacústicas evocadas em militares expostos e não expostos ao ruído [dissertação de mes-trado]. Rio de Janeiro: Universidade Veiga de Almeida; 2009. 17. Azevedo MF. Emissões otoacústicas. In: Figueiredo MS. Emissões
Otoacústicas e BERA. São José dos Campos: Pulso; 2003. p.35-83. 18. Lonsbury-Martin BL, Martin GK, Telischi FF. Emissões otoacústicas na
prática clínica. In: Musiek FE e Rintelmann WF. Perspectivas atuais em avaliação auditiva. São Paulo: Manole; 2001. p.163-92.
19. Bevilacqua MC, Martinez MAN, Balen AS Pupo AC, Reis ACMB, Frota S. Tratado de Audiologia. São Paulo: Editora Santos; 2011. p.145-58. 20. Negrão MA, Soares E. Variações nas amplitudes de respostas das
emissões otoacústicas evocadas e suscetibilidade à perda auditiva induzida por ruído - PAIR. Rev CEFAC. 2004;6(4):414-22.
21. Lapsley Miller JA, Marshall L, Heller LM, Hughes LM. Low-level otoa-coustic emissions may predict susceptibility to noise-induced hearing loss. J Acoust Soc Am. 2006;120(1):280-96.
22. Olszewski J, Miłoński J, Olszewski S, Majak J. Hearing threshold shift measured by otoacoustic emissions alter shooting noise exposure in soldiers using hearing protectors. Otolaryngol Head Neck Surg. 2007;136(1):78-81.
23. Côrtes-Andrade IF, Souza AS, Frota SMMC. Estudo das emissões oto-acústicas - produto de distorção durante a prática esportiva associada à exposição à música. Rev CEFAC. 2009;11(4):654-61.
24. Fissore L, Jannelli A, Casaprima V. Exploración auditiva en adolescen-tes mediante el uso de otoemisiones acústicas. Arch Argent Pediatr. 2003;101(6):448-53.
25. Salazar AMB, Fajardo CL, Vera CC, García PM, Solís FF. Compara-ción de emisiones otoacústicas producto de distorsión en indivi-duos expuestos y no expuestos a ruido ocupacional. Cienc Trab. 2003;5(10):24-32.
26. Bezerra MD, Marques RA. Configurações audiométricas em saúde ocupacional. RBPS. 2004;17(2):61-5.
27. Torre P, Howell JC 3rd. Noise levels during aerobics and the poten-tial effects on distortion product otoacoustic emissions. J Commun Disord. 2008;41(6):501-11.
28. Granjeiro RC. Estudo das emissões otoacústicas evocadas transientes e por produto de distorção em indivíduos com zumbido e limiar au-ditivo normal [dissertação]. Brasília: Faculdade de Ciências da Saúde. Universidade de Brasília; 2005. 176p.
29. Pfeiffer M, Rocha RLO, Oliveira FR, Frota S. Intercorrência audiológica em músicos após um show de rock. Rev CEFAC. 2007;9(3):423-9. 30. Lacerda ABM, Gonçalves CGO, Zocoli AMF, Diaz C, Paula K. Hábitos
auditivos e comportamento de adolescentes diante das atividades de lazer ruidosas. Rev CEFAC. 2011;13(2):322-9.
31. Hidecker MJC. Noise-induced hearing loss in school-age children: what do we know? Semin Hear. 2008;29(1):19-28.