Radial frequency stimuli and sine-wave
gratings seem to be processed by
distinct contrast brain mechanisms
1Laboratório de Percepção Visual, Departamento de Psicologia,
Universidade Federal de Pernambuco, Recife, PE, Brasil
2Laboratório de Processamento Visual, Departamento de Psicologia,
CCHLA, Universidade Federal da Paraíba, João Pessoa, PB, Brasil M.L.B. Simas1,
R.M.T.B.L. Nogueira1
and N.A. Santos2
Abstract
An assumption commonly made in the study of visual perception is that the lower the contrast threshold for a given stimulus, the more sensitive and selective will be the mechanism that processes it. On the basis of this consideration, we investigated contrast thresholds for two classes of stimuli: sine-wave gratings and radial frequency stimuli (i.e., j0 targets or stimuli modulated by spherical Bessel functions). Employing a suprathreshold summation method, we measured the selectivity of spatial and radial frequency filters using either sine-wave gratings or j0 target contrast profiles at either 1 or 4 cycles per degree of visual angle (cpd), as the test frequencies. Thus, in a forced-choice trial, observers chose be-tween a background spatial (or radial) frequency alone and the given background stimulus plus the test frequency (1 or 4 cpd sine-wave grating or radial frequency). Contrary to our expecta-tions, the results showed elevated thresholds (i.e., inhibition) for sine-wave gratings and decreased thresholds (i.e., summation) for radial frequencies when background and test frequencies were identical. This was true for both 1- and 4-cpd test frequencies. This finding suggests that sine-wave gratings and radial frequency stimuli are processed by different quasi-linear systems, one work-ing at low luminance and contrast level (sine-wave gratwork-ings) and the other at high luminance and contrast levels (radial frequency stimuli). We think that this interpretation is consistent with distinct foveal only and foveal-parafoveal mechanisms involving striate and/or other higher visual areas (i.e., V2 and V4).
Correspondence
M.L.B. Simas
Laboratório de Percepção Visual LabVis-UFPE, CFCH, UFPE, 9º andar 50670-901 Recife, PE
Brasil
Fax: +55-81-3441-7547 E-mail: [email protected] or [email protected]
Research supported by CNPq (No. 35.1453/1996-2), and FACEPE (No. APQ.309-7.07/90).
Received October 10, 2003 Accepted January 6, 2005
Key words
•Sine-wave gratings •Spatial frequency •Radial frequency •Bessel functions •Multiple channels •Contrast sensitivity
Introduction
In 1960, Kelly (1) proposed the use of images having a concentric configuration for studying visual mechanisms and properties where the contrast is modulated by a Bessel
J0 profile. Since Kelly’s proposal, only few
published reports have addressed the issue of
contrast detection or sensitivity employing this kind of stimulus.
Among the few that did attempt to con-duct experiments with these stimuli are Kelly and Magnuski (2) and Kelly (3). These inves-tigators reported measurements of the
modu-lation transfer function,or the contrast
grat-ings and for J0 targets using psychophysical
methods.
Kelly and Magnuski (2) reported that the human visual system is at least two times less
sensitive to J0 targets when compared to
sine-wave gratings. This indicates that the amount of contrast necessary for the detec-tion of sine-wave gratings is at least two times lower than the amount necessary to
detect J0 targets in its respective most
sensi-tive range. The authors concluded that thresh-olds for sine-wave gratings, or cosine-wave circular targets could predict the responses
to J0 targets. Here we will call these stimuli
radial (spatial) frequencies, use spherical
Bessel function profile modulation, j0, and
name its response curve rCSF (radial (fre-quency) CSF) (4).
Kelly (3), reproduced part of the study of 1975 and also carried out experiments with stabilized images for both sine-wave gratings
and J0 targets. He found that both the CSF
and rCSF had the same trend if their images were stabilized but reproduced previous trends if the images were presented in drift-ing motion. In his conclusion, Kelly reports on a mechanism that detects only “station-ary, stabilized images..., whose existence can be inferred only by means of unchang-ing, high-contrast, achromatic patterns...” (p. 438), and questions its function.
The conclusion of Kelly and Magnuski (2) could imply that detection is mediated by only a single mechanism for sine-wave
grat-ings and J0 targets. On the other hand,
Kelly’s conclusion (3) suggests the exist-ence of a sustained mechanism working at high levels of contrast.
Most of the work carried out in our laboratory has been to investigate mechan-isms that are sensitive to steady stimulus presentations lasting at least 2000 ms. The main objective has been to look for spatial frequency filters that might be active in the detection and recognition of form, be the form sharp and detailed, or blurred and defocused. By filter we mean some sort of
mechanism or channel represented by an assembly of neurons (some sort of neuronal network) that might show quasi-linear re-sponse characteristics, within specific ranges of time, location and spatial configuration, for given sets of visual stimuli. Also, we have been looking for such filters by measuring responses of the human visual system to angular frequency stimuli since 1989 (5), with earlier work beginning in 1985 (6,7).
In the paper by Simas et al. (5) we report results that are compatible with the existence of angular frequency filters and where the visual system is conceived as decomposing the visual information in terms of polar coor-dinates, the angular part being one of the components. The adoption of a polar coordi-nate system for visual system detection im-plies the existence of an orthogonal radial component. Besides Kelly’s work, we found a more recent study (8) that also employed Bessel functions to measure contrast sensi-tivity and to estimate matched channels for radially symmetric patterns. But in this study the main focus was the center of the radial frequency stimulus.
In the present study, we report charac-teristic response functions for radial fre-quency filters at 1 and 4 cycles per degree of visual angle (cpd). We refer to a radial
frequency filter as Fr(R), where r stands for
the radial test frequency (for the given radial
frequency filter) and R refers to the varying
background radial frequency. We used the same method, equipment and subjects as in the previous study to obtain estimations of angular frequency filter responses (5). As a control condition, we also measured the response to spatial frequency filters of 1.0 and 4.0 cpd, using the same equipment, method and subjects. We describe a spatial
frequency filter as Fs(S), with s standing for
the test spatial frequency and S for the
background spatial frequency.
be-tween a stimulus containing either a spatial or a radial frequency and another stimulus at mean luminance in a forced-choice para-digm.
In Experiments 2 and 3 the psychophysi-cal measures for the filter functions were obtained by the use of a suprathreshold summation method adapted and modified from Kulikowski and King-Smith (9) whereby the observer was asked to choose between two targets: one presenting the background frequency alone and the other containing the same background frequency plus the test frequency. Only the contrast of the specific test frequency was varied within each ses-sion.
Based on Kulikowski and King-Smith (9), we expected both spatial and radial fre-quency filters to show strong summation effects whenever test and background fre-quency were the same. We also expected a general summation effect in the neighbor-hood of the test frequency for each of the measured filters.
Experiment 1: CSF and rCSF measurements
This experiment measured absolute thresholds for sine-wave gratings and radial frequency stimuli using the same equipment and procedure as a preliminary standardizing study.
Subjects and Methods
Subjects. Seven students from the Psy-chology Department (20 to 30 years old) were the subjects in this experiment. They had either normal or corrected-to-normal acuity as assessed by an E of Rasquim Eye Chart.
Materials and procedures. A computer controlled a DT-2853 video board through which the visual stimuli were generated ei-ther on an RGBsync standard low contrast resolution TV monitor or on a high-contrast
resolution Sony BVM-1910 RGBsync moni-tor. In each of 60-120 trials, the observer had to correctly choose the test stimulus con-tained in one of two presentation intervals lasting 2000 ms each, with an interstimulus interval (ISI) lasting 1000 ms. The test stimu-lus would be either the spatial or radial frequency stimulus (depending on the meas-ured function, CSF or rCSF, respectively). The other presentation interval would con-tain only a constant homogeneous gray
stimu-lus at mean luminance, i.e., 8.2 cd/m2. After
an error followed by three consecutive cor-rect choices, the test stimulus contrast was lowered by 0.008, or 0.8%, and a maximum level (peak) value of contrast was recorded. After each error, contrast was increased by the same amount. A local minimum contrast level value (valley) was recorded every time an error was preceded by at least three consecutive correct choices. A total of 10 pairs of maximum-minimum were obtained in each experimental session run for each point estimate of the measured curves.
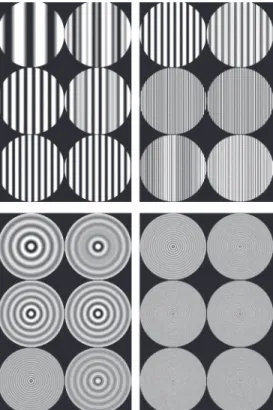
Examples of the stimuli detected during measurements of the CSF or rCSF are shown in Figure 1 (left columns). All stimuli were seen from a distance of 150 cm, subtending 7.25 degrees of visual angle. The other stimulus shown as comparison was the homogeneous gray circle. The spatial or radial frequencies used to obtain point estimates for each curve were 0.2, 0.3, 0.5, 0.8, 1.0, 2.0, 3.0, 4.0, 5.0, 6.0, and 9.0 cpd, each of these run in a separate experimental session, at least two sessions for each point, per observer.
A total of 22 curves were measured; nine for the CSF and 13 for the rCSF, for a total of about 242 experimental sessions of 15-25 min each.
Results
the average of the peaks and valleys obtained across subjects for each given condition. Error bars of the mean are the 99%
confi-dence interval corrected by the Student t-test
distribution for sample size. Maximum sen-sitivity (i.e., corresponding to the minimum contrast threshold) occurred around 2-3 cpd for the CSF and around 0.8-1.0 cpd for the rCSF for both monitors used. Contrast sen-sitivity to sine-wave gratings was about 5
times higher than that for j0 targets at their
respective maximum sensitivity ranges. On the other hand, mean contrast sensi-tivities (obtained with the high-contrast reso-lution monitor) within the range of 0.2-9.0 cpd varied from about 3.9 to 48.6 (arbitrary
units) for sine-wave gratings whereas for j0
targets, within the same range, they varied between 2.8-5.8. Thus, the dynamic con-trast amplitude range was about 14.9 higher for sine-wave gratings, given the same spa-tial frequency range. For the low-contrast resolution monitor this range was about 7.0 times higher for sine-wave gratings.
The results obtained with the Sony BVM-1910 monitor as well as with the standard TV monitor show that the contrast range of the latter monitor, being too high (with low dynamic range), was inadequate to correctly measure absolute thresholds for sine-wave gratings at their peak sensitivity (Figure 2). Figure 1. Example of pairs of
stimuli used to measure F1(S)
(or FSIN01cpd, top, left), F4(S)
(or FSIN04cpd, top right), F1(R)
(or FBES01cpd, bottom left) and F4(R) (or FBES04cpd, bottom
right). For each function we pre-sent three pairs: for FSIN01cpd the pairs are: 0.3 cpd (top), 0.8 cpd (center) and 1.0 cpd (bot-tom); for FSIN04cpd: 1.0 cpd (top), 4.0 cpd (center), and 6.0 cpd (bottom); for FBES01cpd: 0.8 cpd (top), 1.0 cpd (center) and 3.0 cpd (bottom), and for FBES04cpd: 3.0 cpd (top), 4.0 cpd (center) and 6.0 cpd (bot-tom). For each function, on the left are the background fre-quencies only. On the right side are the summed stimuli (i.e., background plus test fre-quency). All stimuli were gener-ated originally to be seen at a distance of 150 cm. cpd = cycles per degree of visual angle.
Contrast sensitivity (arbitrary units)
100,000
10,000
1,000 Contrast sensitivity (arbitrary units) 100,000
10,000
1,000
1 10 1 10
Spatial/radial frequency (cpd) Spatial/radial frequency (cpd)
CSF rCSF
CSF (high) rCSF (high)
Figure 2. Contrast sensitivity for sine-wave gratings and radial fre-quency stimuli. Grand mean of contrast sensitivity values ob-served in the measurement of both CSF (contrast sensitivity function) and rCSF (radial con-trast sensitivity function). These are measurements made on the standard low-contrast reso-lution monitor (A) and on a Sony BVM-1910 RGB-TV-video moni-tor, a high-contrast resolution monitor (B). In A, the CSF maxi-mum sensitivity occurs around 2.0-3.0 cpd whereas that for the
rCSF occurs around 1.0 cpd. In B, CSF maximum sensitivity occurs around 3.0 cpd whereas that for the rCSF occurs around 0.8-1.0 cpd. Error bars are standard errors of the mean at the 99% confidence level interval. All the differences between respective point estimates of each function were statistically significant at P < 0.01 (t-test for correlated samples).
A B
Figure 2 shows the contrast sensitivity values derived from the measured mean contrast threshold amplitudes for both sine-wave gratings and radial frequency stimuli. The respective CSF and rCSF that are gen-erally presented in the literature are the in-verse function of contrast threshold ampli-tudes.
Discussion
We were able to measure the range of maximum sensitivity for sine-wave gratings with the high-resolution monitor. For radial frequency stimuli the trends were similar for both monitors. Following this preliminary study we proceeded to measure the spatial and radial frequency filter.
Experiment 2: Spatial and radial frequency filter measurements of 1 and 4 cpd using the standard TV monitor with low-contrast resolution
Originally, we were only able to run the spatial and radial frequency filter measure-ments using a low-contrast resolution moni-tor (the same used for the angular frequency filter measurements reported by Simas et al., 5). We report these in Experiment 2. Later, we were able to replicate these experiments in part using a higher contrast resolution monitor. These additional measurements are reported in Experiment 3.
Experiments 2 and 3 were run using a suprathreshold summation method, a varia-tion of the method of Kulikowski and King-Smith (9). This was done within a forced-choice procedure (10). In the original study, Kulikowski and King-Smith employed 1/2 of the contrast needed for the test frequency to attain threshold as the background stimulus contrast value. These investigators thought that the test frequency contrast summed with the background frequency contrast, would be sufficient for the test frequency to reach detection threshold, if processed by the same underlying mechanism. This was done instead of the detectable contrast value attributed to the background stimuli that we used in our experiments.
Subjects and Methods
Subjects. Five observers from the UFPE
student population (20-30 years old) partici-pated in this study. They had either normal or corrected-to-normal visual acuity.
Materials and procedures. In these ex-periments, we used both 6 and 42% contrast levels for the background spatial or radial frequency stimuli. These were suprathresh-old contrast levels. The background spatial and radial frequency values were the same as for the measurement of the CSF and rCSF point estimates. The test stimulus was either a 1- or a 4-cpd spatial or radial frequency stimulus depending on the filter being tested.
Thus, for F1(S) and for F4(S) the test
stimu-lus was a 1- or a 4-cpd sine-wave grating,
respectively, whereas for F1(R) and for F4(R)
these were a 1- and a 4-cpd radial frequency stimulus, respectively.
We measured the amount of test fre-quency contrast needed for detection of the test frequency summated to each of the background frequencies. That is, observers had to consistently choose the sum of the test plus the background frequency from the background frequency presented alone. In all trials, the background stimulus had fixed contrasts at either 6 or 42% during all presen-tations. So, on the one hand, when test and background spatial or radial frequencies were identical, discrimination was made based on contrast alone. On the other hand, in any other experimental condition, observers could make discriminations based on contrast as well as on spatial or radial frequency of the background. Nevertheless, according to the original paradigm (9), the strongest contrast summation effect should theoretically occur when the spatial or radial frequencies of test and background stimuli were similar or iden-tical. This should be so due to the selective-ness of the mechanisms processing each stimulus.
Both stimuli were again presented for 2000 ms, having an ISI of 1000 ms and an intertrial interval lasting 3000 ms.
A total of 32 curves (each having 11 point
F1(R), F4(S) or F4(R), where the
back-ground frequency was always at a contrast level of 42%. Thus, we measured 7 curves
for F1(S), 10 curves for F1(R), 9 curves for
F4(S), and 6 curves for F4(R).
Similarly, a total of 15 curves (each having 11 point estimates) were measured with the background set at 6%. Thus, 3
curves were measured for F1(S), 5 curves
were measured for F1(R) and F4(S) and two
curves were measured for F4(R).
Figure 1 shows examples of pairs of stimuli used in the experiments. Observers had to differentiate the background plus test frequency from the background frequency alone. The test stimulus for the various measured filters is the one in the right col-umns for each pair of stimuli. Thus, for
F1(S) we show pairs for points at 0.3 (top),
0.8 (center) and 1.0 (bottom) cpd; for F1(R)
we show 0.8, 1.0, and 3.0 cpd; for F4(S) we
illustrate points at 1.0, 4.0, and 6.0 cpd, and
for F4(R) we present points at 3.0, 4.0, and
6.0 cpd.
About 517 sessions were run to obtain all of these curve estimates, with each session held to measure each point estimate lasting about 15-25 min, depending on the number of trials needed for reaching criterion, i.e., 10 pairs of peaks and valleys, with the number of trials ranging from about 60 to 125.
Results
Point estimates as well as the standard error bars of the mean for the 99% confi-dence interval (corrected for the sample size
by the Student t-test distribution) for each
measured function are shown in Figure 3. For easier identification in the figures, we decided to name the filter curves after each stimulus test: FSIN01cpd, FBES01cpd,
FSIN04cpd, and FBES04cpd for F1(S),
F1(R), F4(S), and F4(R), respectively.
Each point estimate represents contrast summation effects that are the actually ob-tained grand mean (averaged across
sub-jects) of contrast thresholds for detecting contrast of the test frequency in the sum-mated stimuli.
The use of 99% confidence intervals shows most of the significant differences without need for specific tests. Nevertheless, to
illus-trate this point, we carried out a t-test for
correlated samples for points 0.8, 1.0, 2.0, and 3.0 cpd for FBES01cpd in Figure 3A and found a significant difference between 0.8 and 1.0 cpd, P < 0.001 (d.f. = 150, t = 15.067) and between 1.0 and 3.0 cpd, P < 0.001 (d.f. = 147, t = -6.535). We found no significant difference between 1.0 and 2.0 cpd.
We used the absolute threshold contrast values for 1- and 4-cpd sine-wave gratings or radial frequency stimuli as the reference baseline values for the filter measurements. Thus, to better observe the summation
ef-fects we included straight lines inthe grand
mean obtained for detecting the test stimulus used for measuring curve estimates of each filter.
The figures were organized so as to allow direct comparisons between FSIN01cpd and FBES01cpd, as well as between FSIN04cpd and FBES04cpd. Thus, Figure 3A and C compares FSIN01cpd and FBES01cpd with background stimulus contrasts at 42 and 6%, respectively, while Figure 3B and D is the equivalent comparing FSIN04cpd and FBES04cpd.
Summation effects are easily observed with respect to the horizontal lines which indicate absolute thresholds for each of the test frequencies. Points below the absolute threshold line indicate summation effects. If a point value is at the absolute threshold line, it may illustrate independent detection, whereas if it is above it, it shows interdepen-dence and inhibition.
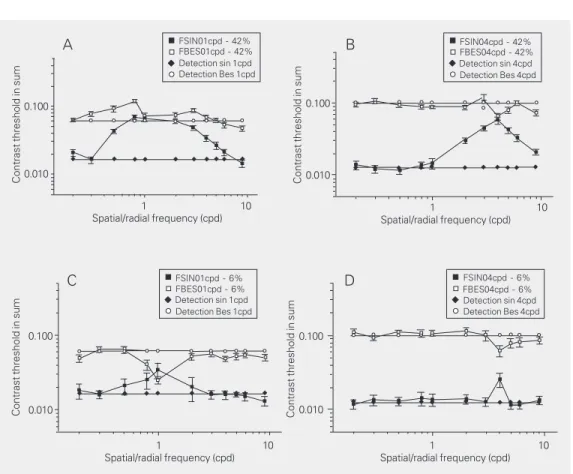
Figure 3. Contrast thresholds of test frequency in the summed stimuli obtained with the standard low-contrast resolution monitor. A, Grand mean of contrast at threshold in sum for the test frequency used to estimate FSIN01cpd and FBES01cpd with background frequency contrast fixed at 42%. Horizontal lines are detection thresholds for the 1.0 cpd sine-wave grating and for the 1.0 cpd radial frequency. Note the difference in trends. While most FSIN01cpd points fell significantly above the 1.0 cpd sine-wave grating absolute detection threshold, point estimates for the FBES01cpd showed small local summation effects at 1.0 cpd radial frequency and inhibitory effects at neighboring frequencies, i.e., at 0.8 and 3.0 cpd. The differences among 1.0, 0.8 and 3.0 cpd were statistically significant. B, Grand mean of contrast at threshold in sum for the test frequency used to estimate FSIN04cpd and FBES04cpd with background frequency contrast fixed at 42%. Horizontal lines are detection thresholds for the 4.0 cpd sine-wave grating and for the 4.0 cpd radial frequency. While all FSIN04cpd point estimates in the neighborhood of the test frequency fell significantly above the 4.0 cpd sine-wave grating absolute detection threshold, point estimates for the FBES04cpd showed a significant summation effect at 4.0 cpd test radial frequency and, again, relative and significant inhibitory effects at neighboring frequencies, i.e., at 3.0 and 6.0 cpd. C, Grand mean of contrast at threshold in sum for the test frequency used to estimate FSIN01cpd and FBES01cpd with background frequency contrast fixed at 6%. While the central point estimates for FSIN01cpd fell above the 1.0 cpd sine-wave grating absolute detection threshold, showing inhibition, point estimates for the FBES01cpd showed significantly larger summation effects with a maximum at 1.0 cpd radial frequency, and still showed significant inhibitory effects at neighboring frequencies, i.e., at 0.5 and 2.0 cpd.
D, Grand mean of contrast at threshold in sum for the test frequency used to estimate FSIN04cpd and FBES04cpd with background frequency contrast fixed at 6%. While most point estimates for FSIN04cpd fell nearby the 4.0 cpd sine-wave grating absolute detection threshold, inhibition was observed at 4 cpd. On the other hand, point estimates for the FBES04cpd showed significant summation effects at 4.0 cpd test radial frequency and at its high frequency neighborhood. For FBES04cpd, the inhibitory effects at neighboring frequencies, i.e., at 3.0 and 6.0-9.0 cpd, are still present. All error bars are standard errors of the mean and corrected for the sample size to be at the 99% level of confidence interval. All inhibitory effects are reported relative to the test frequencies. cpd = cycles per degree of visual angle.
Contrast threshold in sum
Spatial/radial frequency (cpd) Spatial/radial frequency (cpd)
1 10 1 10
0.100
0.010
Contrast threshold in sum
0.100
0.010
Detection sin 4cpd FSIN04cpd - 42% FBES04cpd - 42%
Detection Bes 4cpd Detection sin 1cpd
FSIN01cpd - 42% FBES01cpd - 42%
Detection Bes 1cpd
A B
Contrast threshold in sum
0.100
0.010
Contrast threshold in sum
0.100
0.010
Spatial/radial frequency (cpd)
1 10
Spatial/radial frequency (cpd)
1 10
Detection sin 1cpd FSIN01cpd - 6% FBES01cpd - 6%
Detection Bes 1cpd
Detection sin 4cpd FSIN04cpd - 6% FBES04cpd - 6%
Detection Bes 4cpd
contrast, for FSIN01cpd and FSIN04cpd, we found inhibitory effects at the test fre-quencies, also present at 6% background stimulus contrast.
On the other hand, a tendency to inhibito-ry effects, also found previously for angular frequencies (5,7), appears to be present for radial frequency stimuli in the neighborhood of the test frequency.
We found no summation effects for FSIN01cpd and FSIN04cpd. Inhibition for the latter curves was still present at a 2% background stimulus contrast for at least one subject (i.e., JTF:2).
For all curves, but FSIN04cpd (in the 6% condition), the summation or inhibition ef-fects were larger than 25% as compared to either neighboring or more remote spatial or radial background frequencies.
It is interesting to compare Figure 3B to 3C. There were effects of similar magnitude for FSIN04cpd and FBES04cpd (42% con-dition) and FSIN01cpd and FBES01cpd (6% condition). This is consistent with larger summation/inhibition effects at higher con-trast levels at 4 cpd, and at lower concon-trast levels for 1 cpd.
Since summation effects reflect linearity, Figure 3 shows linear effects for radial fre-quency stimuli only. Clear out-of-linearity-range effects were detected for sine-wave gratings in all measurements.
Discussion
We were able to measure narrow-band filters for sine-wave gratings as well as for radial frequency stimuli. The effects appear to be reversed for the former as compared to the effects observed for the latter. The su-prathreshold contrast present in the back-ground stimuli seems to have caused inhibi-tory effects in the detection of the test sine-wave gratings. We obtained these results even when we lowered the amount of the contrast of the background stimuli to 6%. In the next experiment, we proceeded to
meas-ure such filters using the high-contrast reso-lution monitor.
Experiment 3: Spatial and radial frequency filter measurements of 1 and 4 cpd using the high-contrast resolution monitor
Experiment 3 was a repetition, in part, of Experiment 2 (only using background stimu-lus contrast fixed at 42%) on a monitor having much higher contrast resolution. The method we used is described above and also in detail by Simas and Dodwell (7) and by Simas et al. (5,11).
Subjects and Methods
Subjects. Three subjects having normal or corrected-to-normal visual acuity partici-pated in the study.
Materials and procedures. Except for the fact that these were run on the high-contrast resolution monitor Sony BVM-1910, all the materials and equipment were the same as used for the first set of experiments. By high-contrast resolution we mean that the rate of increase in brightness was very slow for the same given digital steps as entered for a stan-dard TV-RGB-video monitor. In the latter, the steps of increase in brightness are much larger. Thus, a 0.008 or 0.8% step increase implies different rates of increase for the two monitors used. The correct comparison is made if we measure the maximum and the minimum con-trast levels. For the standard TV-RGB-video monitor these are within about 13.7 and 2.7 cd/
m2, respectively, whereas for the Sony
BVM-1910, these are within about 9.6 and 6.9 cd/m2.
The mean luminance was always kept at 8.2
cd/m2.
A total of 12 curves were obtained with the suprathreshold summation procedure for
F1(S), F1(R), F4(S), and F4(R) using the
background stimulus contrast level of 42%. Thus, three curves were measured for each
Results
In Experiment 3 we ran the same condi-tions as in Experiment 2, but using a higher contrast resolution monitor with background contrast at 42% for all conditions.
Thus, Figure 4 shows the curves obtained with the Sony BVM-1910 monitor. All details are similar to the explanations for Experiment 2. Consistent with the lower range of contrast in this monitor, we found for the 42% condi-tion results that were similar to those of the 6% condition in the high-contrast range monitor (standard TV monitor). It is interesting to observe that, again, for the lower contrast range, the larger summation and inhibition effects were obtained in the 1-cpd range rather than around 4 cpd.
Discussion
We were able to repeat the results of Experiment 2 for both sine-wave gratings and radial frequency stimuli. Replication at 1.0 cpd showed larger effects than at the 4.0-cpd range. Nevertheless, for FSIN044.0-cpd and FBES04cpd, the test sine-wave grating at 4.0 cpd was above its absolute threshold when summated with each of the tested background frequencies, whereas the test radial frequency stimulus at 4.0 cpd was below its absolute threshold under similar conditions.
General Discussion
In Experiment 1 (CSF and rCSF
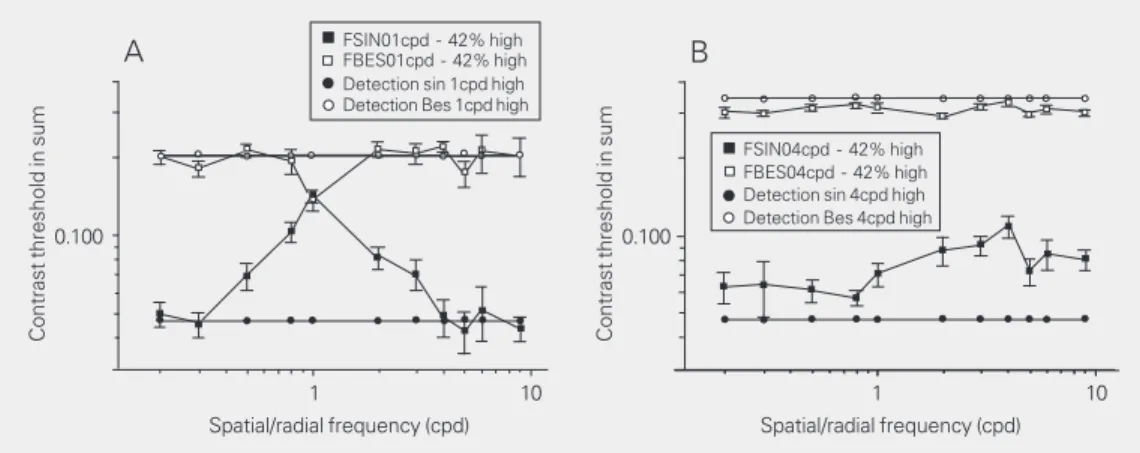
meas-Figure 4. Contrast thresholds of test frequency in the summed stimuli obtained with the high-contrast resolution monitor. A, Grand mean of contrast at threshold in sum for the test frequency used to estimate FSIN01cpd and FBES01cpd. These are measurements using the high-contrast resolution monitor (please, note the higher ordinate values at low luminance). Again the background frequencies had contrast fixed at 42%. Horizontal lines are detection thresholds for the 1.0-cpd sine-wave grating and for the 1.0-cpd radial frequency. Again, observe the difference in trends (refer also to Figure 3A and C). For FSIN01cpd, the test frequency of 1.0 cpd fell significantly above the 1.0-cpd sine-wave grating absolute detection threshold. Neighboring point estimates at 0.5, 0.8, 2.0, and 3.0 cpd also showed significant inhibition. On the other hand, point estimates for the FBES01cpd showed a significant summation effect at 1.0-cpd radial frequency (the test frequency), and still showed significant inhibitory effects at neighboring frequencies, i.e., at 0.5-0.8 and 2.0-4.0 cpd. B, Grand mean of contrast at threshold in sum for the test frequency used to estimate FSIN04cpd and FBES04cpd with background stimulus contrast at 42%. Horizontal lines are detection thresholds for the 4.0-cpd sine-wave grating and for the 4.0-cpd radial frequency. While all point estimates for FSIN04cpd fell above the 4.0-cpd sine-wave grating absolute detection threshold, showing general inhibition with a maximum significant effect at 4.0 cpd, point estimates for the FBES04cpd fell all below the absolute contrast threshold value for the 4.0-cpd radial frequency. At that low luminance level, summation was stronger at 2.0 instead of 4.0 cpd with a secondary minimum at 5.0 cpd. All error bars are standard errors of the mean and corrected for the sample size to be at the 99% level of confidence interval. All inhibitory effects are reported relative to the test frequencies. cpd = cycles per degree of visual angle.
Contrast threshold in sum
0.100
Contrast threshold in sum
0.100
Detection sin 1cpd high FSIN01cpd - 42% high FBES01cpd - 42% high
Detection Bes 1cpd high
Detection sin 4cpd high FSIN04cpd - 42% high FBES04cpd - 42% high
Detection Bes 4cpd high
Spatial/radial frequency (cpd)
1 10
Spatial/radial frequency (cpd)
1 10
urements), the results as shown in Figure 2 present the trend of previous findings (2,3) for the CSF and rCSF. Much lower contrast levels are needed to detect sine-wave grat-ings than for radial frequency stimuli. On the other hand, the amplitude contrast range is much steeper for sine-wave gratings than for radial frequency stimuli. We see the in-creased difference in contrast sensitivity between the CSF and rCSF within their respective maximum sensitivity ranges as procedure dependent. The forced-choice procedure is a far better and less biased method than the adjustment procedure used by Kelly and Magnuski (2).
In Experiments 2 and 3 (filter measure-ments), we were surprised to find inhibition for spatial frequency filters using this supra-threshold summation method. We did not expect this based on the results of Kulikowski and King-Smith (9) or based on established results using adaptation methods (see, e.g.,
12,13). On the other hand, our procedure
cannot be compared to masking as most masking procedures use time intervals of up to 300 ms; our study used durations of 2000 ms for stimulus presentation. The ISI of 1000 ms was sufficient to ensure absence of masking.
Thus, we observed spatial frequency fil-ters that, probably due to high contrast lev-els, went out of their linearity range and, instead of summating, suffered inhibition around the test spatial frequency.
On the other hand, it is interesting to note that radial frequency filters tend to behave linearly at high contrast ranges. Though they show a more restricted range as compared to spatial frequencies, they appear to work well and linearly at relatively high-contrast thresh-old levels.
On the basis of Figures 3 and 4, we are led to infer that at least two different mechan-isms are acting in the detection of sine-wave gratings and radial frequency stimuli. To reach this conclusion we need to consider various aspects. First, we have to discuss the
meaning of summation or inhibition and when to consider a filter as having filtering charac-teristics.
From electronic engineering and physics we learn that in order to be considered to be filtering frequencies, a mechanism should present selectively increased or decreased effects for a range or interval (that is, to have selective band-pass characteristics) where it shows a maximum or a minimum (depending on the measurement procedure) that is at least about 25% higher, or lower, when compared to neighboring and distant fre-quencies.
In our procedure, a summation effect would occur when both the test and back-ground frequencies add contrast levels lin-early and become much easier to detect with respect to neighboring frequencies. In other words, with very little addition of contrast it would be very easy to differentiate between the background alone and the summated stimulus. In that case, the amount of contrast necessary to allow this differentiation is much smaller than the amount of contrast needed to detect the test frequency alone. This could also happen for detection within a small range around the test frequency value. In that case, we would assume that the same mech-anism is detecting both stimuli.
References
1. Kelly DH (1960). Stimulus pattern for visual research. Journal of the Optical Society of America, 50: 1115-1116.
2. Kelly DH & Magnuski HS (1975). Pattern detection and the two-dimensional Fourier transform: circular targets. Vision Research, 15: 911-915.
3. Kelly DH (1982). Motion and vision. IV. Isotropic and anisotropic spatial responses. Journal of the Optical Society of America, 72: 432-439.
4. Simas MLB & Santos NA (2002). Contrast sensitivity to radial frequencies modulated by Jn and jn Bessel profiles. Brazilian Jour-nal of Medical and Biological Research, 35: 1357-1366.
5. Simas MLB, Frutuoso JT & Vieira FM (1992). Inhibitory side bands
in multiple angular frequency filters in the human visual system.
Brazilian Journal of Medical and BiologicalResearch, 25: 919-923. 6. Simas MLB (1985). Linearity and domain invariance in the visual system. PhD thesis, Queen’s University at Kingston, Ontario, Canada, University Microfilms International, Ann Arbor, MI, USA. Publication No. 86-17940.
7. Simas MLB & Dodwell PC (1990). Angular frequency filtering: a basis for pattern decomposition. Spatial Vision, 5: 59-74. 8. Mortensen U & Meinhardt G (2001). Detection of simple radially
symmetric targets: further evidence for the matched filter process-ing scheme in human pattern detection. Biological Cybernetics, 84: 63-74.
single mechanism may be implied.
When looking at Figures 3 and 4, one can observe that summation effects, selective and not so selective, are occurring for most results for radial frequency. The interesting part is the fact that summation effects can be observed at high, sometimes very high, con-trast levels (e.g., Figure 3B-D).
On the other hand, except for the effects shown in Figure 3D, widespread inhibition was found for sine-wave gratings. Further-more, the amplitude detection ranges be-tween sine-wave gratings and radial fre-quency stimulus test frequencies were quite large. This can already be observed in the measurement of the CSF and rCSF.
But, instead of abandoning radial
fre-quencies (j0 targets) as stimuli to which the
visual system is not highly selective, we choose to infer the existence of two or more separate mechanisms involved in the detec-tion of spatial and radial frequencies.
Thus, a new look at our results will lead us to infer the existence of mechanisms that appear to function linearly at medium-high and high contrast levels, the former tending to peak at radial frequencies around 1 cpd, the latter at radial frequencies around 4 cpd. On the other hand, sine-wave gratings seem to be detected at much lower contrast levels than the ones we employed since we could not observe any summation effect as did Kulikowski and King-Smith (9).
Further-more, according to Figure 3A-C, there are larger inhibitions at spatial frequencies around 1 cpd. This would be consistent with a lower contrast mechanism working better in the low spatial frequency range.
We think that these results are quite consistent with foveal-parafoveal detection mechanisms as well as with the many physi-ological findings related to striate and extra-striate areas involved in form processing. We may refer, for instance, to the studies by Gallant and colleagues (14,15) that show preferences for radial frequency stimuli in area V2 and V4 of macaque monkeys. We can also mention some recent work using functional magnetic resonance imaging in humans (16) showing extra-striate areas in-volved in the processing of radial (we call these angular frequency stimuli) and con-centric gratings (we call these radial fre-quency stimuli).
9. Kulikowski JJ & King-Smith PE (1973). Spatial arrangement of line, edge, and grating detectors revealed by sub-threshold summa-tion. Vision Research, 13: 1455-1478.
10. Wetherill GB & Levitt H (1965). Sequential estimation of points on a psychometric function. British Journal of Mathematical and Statis-tical Psychology, 18: 1-10.
11. Simas MLB & Santos NA (2002). Narrow-band 1, 2, 3, 4, 8, 16 and 24 cycles/360º angular frequency filters. Brazilian Journal of Medi-cal and BiologiMedi-cal Research, 35: 243-253.
12. Blakemore C & Campbell FW (1969). On the existence of neurons in the human visual system selectively sensitive to the orientation and size of retinal images. Journal of Physiology, 203: 237-260. 13. Graham N (1972). Spatial frequency channels in the human visual
system: effects of luminance and pattern drift rate. Vision Re-search, 12: 53-68.
14. Gallant JL, Braun J & Van Essen DC (1993). Selectivity for polar, hyperbolic, and Cartesian gratings in macaque visual cortex. Sci-ence, 259: 100-103.
15. Gallant JL, Connor CE, Rakshit S, Lewis JW & Van Essen DC (1996). Neural responses to polar, hyperbolic, and Cartesian grat-ings in area V4 of the macaque monkey. Journal of Neurophysiol-ogy, 76: 2718-2739.