determination of patulin in apple juiCe
by HplC uSing a Simple and faSt Sample
preparation metHod
Silvia R.Sargenti1* and Carlos A.A.Almeida2
1Instituto de Química de São Carlos, Universidade de São Paulo, CP 780, 13560-790 São Carlos-SP, Brazil. 2 Laboratório de Análises Micotoxicológicas (LAMIC), Universidade Federal de Santa Maria, 97105-900 Santa Maria-RS, Brazil
Endereço para Correspondência Dra. Silvia R. Sargenti
Laboratório de Química Ambiental– IQSC-USP
Av. do Trabalhador Sãocarlense, 400 – São Carlos – SP Cep: 13560-970 Email: [email protected] ou [email protected]
Phone: 16-33739959 or 16-31167706
abstract: The goal of this work was to develop a simple and rapid preparation method for pa-tulin analysis in apple juice without previous clean-up. This method combined sonication and liquid extraction techniques and was used for determination of patulin in 37 commercial apple juices available on the market in the South of Brazil. The method performance characteristics were determined using a sample obtained in a local market fortified at five concentration levels of patulin and done in triplicates. The coefficient of variation for repeatability at the fortifica-tion level of 20.70µg.L-1 was 3.53 % and the recovery 94.63 %, respectively. The correlation coefficient was 0.9996 and agrees with the requirements for a linear analytical method value. The detection limit was 0.21µg.L-1 and the quantification limit 0.70 µg.L-1. Only three of the analyzed samples were upper the allowed level of 50.00 µg.L-1 recommended for the World Health Organization.
Keywords: patulin, HPLC/UV, apple juice, fast sample preparation method, ultrasonic extraction
introduction
Many fungi found in spoiled food such as Aspergillus spp. and Penicillium spp., including A.clavatus, A. giganteus, A. terreus, P. urticae, P.expansum and Byssochlamys nivea, produce patulin frequently when they invade apples, pe-ars, peaches and berries. Patulin contamination is primarily associated with fruit juices made from poor quality fruits (damaged and rotting fruits). A toxicological concern about apple product, such as apple juice is made particularly because of the apple-rotting produced by fungus P. expansum
[1-years, only apple products, especially apple juice were found to be easily contaminated by patulin, therefore, the patulin level has been regarded as a quality indicator for fruit used to made apple juice[5].
in apple juice, other countries like Switzerland, Sweden, Belgium and Norway that are concerned about this issue, have set a maximum permitted concentration at 50 µg.L-1 as recommended by the World Health Organization [7,8].
In many laboratories, ethyl acetate has been the universal extraction solvent, and purii -cation by sodium carbonate solution has been wi-dely used in the sample pretreatment. Otherwise, liquid–liquid extraction are considerably expen-sive and time consuming due to the use of large amounts of organic solvents and the clean-up pro-cedures using sodium carbonate can make patu-lin deactivate since it is more stable in an acidic medium [9,10]. Some articles using solid-phase extraction for analysis of patulin in apples and apple juices had been reported recently [11,12]. Reverse phase liquid chromatography/UV is con-sidered more convenient and sensitive technique for analysis of patulin and methods to conirm the presence of patulin usually include detection techniques such as mass spectrometry (MS) after liquid or gas chromatography separations [9-14].
Few works reported reduction in time and solvent for sample preparation for patulin analysis in apple juice and no works about sonication ex -traction of patulin was found besides of the power of this extraction technique [15]. The ultrasonic technique described here, used a combination of two non-miscible solvents together (water in the apple juice and ethyl acetate), that permitted a ra -pid extraction of patulin from apple juice using a reduced amount of sample and extraction solvent in only one step.
experimental
Reagents and chemicals
Patulin standard, 98% pure (Sigma-Aldri-ch, Steinheim, Germany); acetonitrile HPLC
gra-Apparatus
Shimadzu UV-Visible Spectrophotometer, Model 1203 (Kyoto, Japan), with wavelength range from 190 to1100 nm. Sonication bath, Mod-el USC 1400A (240x137x100 mm, 40 kHz and 100 W) produced by Unique Sistemas Automáti-cos de Limpeza (Indaiatuba, SP, Brazil). Agilent high performance liquid chromatograph, Model HP-1100 LC/MSD series produced by Agilent Technologies (Waldbronn, Germany), equipped with UV and MS detectors and automated sample injector. Synergi Fusion RP column (250 mm x 2.0 mm ID, 4 µm Fusion- RP80 stationary phase) obtained from Phenomenex Inc. (Torrance, CA, USA). Sample concentration system consisted of hot plate, vacuum and nitrogen lines developed by LAMIC for private laboratory use (Santa Maria, RS, Brazil).
Standard stock solution and Standard
work-ing solutions
Five milligrams of pure crystal patulin was accurately weighted into a 5 mL volumetric lask and dissolved in ethyl acetate. The lask was ti -ghtly wrapped with aluminum foil, identiied as stock solution and kept in freezer (-18 oC).
Two hundred and ifty micro liters of patu -lin standard stock solution was transferred into a 5 mL volumetric lask, evaporated to dryness un -der a nitrogen stream, and then homogenized and diluted to volume with absolute alcohol. The con-centration was determined by spectrophotometry, using 276 nm and ε=14600 parameters.
Samples
Sample extraction
A 5 mL apple juice sample and 20 mL of ethyl acetate were added into a 50 mL lask and capped. This lask was introduced in the sonica -tion bath and allowed to extract for 15 minutes. The ethyl acetate phase was separated and trans-ferred to another lask and placed to a hot plate (40oC) apparatus settled with vacuum and a gentle nitrogen stream to evaporate the solvent. When the residue was completely dry, it was immediate-ly dissolved in 500 µL of acetonitrile/water/acetic acid (840:160:5, v/v/v) solution and analyzed by liquid chromatography.
High performance liquid chromatography
The inal solution was analyzed under the following conditions: the analytical column was set at 30oC and isocratic mode. Mobile phase was 1% acetic acid solution-acetonitrile (99:1, v/v ), with low rate at 0.3 ml/min; UV detector wave -length set at 276 nm; sample injection of 2 µl. Pa-tulin retention time obtained at 12.48 minutes.
Method validation
To validate the method, the analytical curve was constructed with standard patulin solutions at ive concentration levels and in triplicates: 20.7, 31.0, 51.8, 103.6 and 207.2 µg.L-1 . Samples of apple juice were fortiied with the patulin solu -tion at the same ive levels of concentra-tion used for the analytical curve construction (20.7, 31.0, 51.8, 103.6 and 207.2 µg.L-1 ), in triplicates and the chromatographic analysis was performed in duplicates. They were compared with the blank sample (juice without fortiication) to obtain the method recovery. All samples including the stan-dard patulin solutions (used for construction of the analytical curve) were diluted in a mixture of acetonitrile/water/acetic acid (840:160:5, v/v/v) for the HPLC analysis.
results and discussion
The method
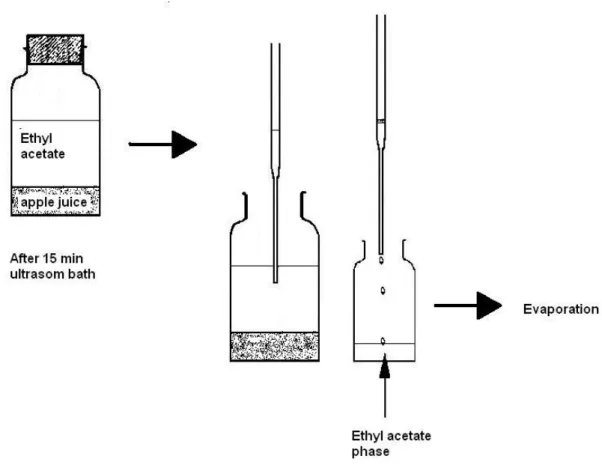
This method was simple just because the sample preparation involves only three steps: ex-traction by sonication bath, phase separation and concentration. An extraction method with few steps allows a good recovery, as can be seen at Table 1. Also in this case, it is possible to sonicate several samples at the same time which depends only of the sonication bath size. In our case, we did ten samples by time (15 minutes). To separate the phases, it is not necessary to use separation funnel and no need of other clean up process. It can be done using a Pasteur pipette (as shown at Figure 1). The amount of sample and extraction solvent was determined in previous extractions tests using fortiied sample at the low concentra -tion level. The sonica-tion extrac-tion time used was deined based in author experience with this technique in other application [16].
However, some caress is needed, the prepa-red sample can’t be exposed at temperature higher than 45oC due to loss or degradation of patulin and need to be dissolved in the working solution as soon as it dryers. The chromatographic analysis need to be done just after that. That was the reason why the fortiied level of 50.80µg.L-1 had a high variation coeficient (10.37 %); in this case one of the samples was allowed to exceed the state of dryness.
figure 2. Chromatogram referring to the determination of patulin in apple juice after extraction: (a)
Patulin standard (100 µg.L-1 ); (b) blank apple juice; (c) apple juice spiked with Patulin (20 µg.L-1 ).
table 1. Recoveries of patulin from spiking.
Spiking level (µg.L-1 )
RSD (%)
(n=6) Recovery (%) 20.70 ± 0.07 3.53 94.63 31.00 ± 0.11 4.35 82.58 51.80 ± 0.43 10.37 80.22 103.60 ± 0.14 1.54 86.83 207.20 ± 0.45 2.31 94.65 LOD = 0.21 µg.L-1
LOQ = 0.70 µg.L-1
Performance characteristics
As it can be seen at Table 1, the recovery for the method varies from 80.22 to 94.65% and is considered as a goodmethod. The standard devia-tion is between 0.07 and 0.45 with a variadevia-tion co-eficient from 1.54% (spiking of 20.70µg.L-1 ) to 10.37% (spiking of 51.80µg.L-1 ), at this level, we considered that this value was due patulin degra-dation in one sample that was allowed to exceed the state of dryness
The standard deviations (SD) were de-termined based on the areas obtained from each compound. The values of limit of detection (LOD) and limit of quantiication (LOQ) were calcula -ted using the formula 3×SD and 10×SD for the low fortiication level (20.7 µg.L-1 ).17 The values obtained were: 0.70 µg.L-1 and 0.21 µg.L-1, res-pectively. The linearity was studied for the patulin over a range of spiking levels from 20.70µg.L-1 to 207.00µg.L-1. The correlation coeficient was 0.9996 and fulils the requirement for a linear me -thod.
Analysis of apple juice samples
From the 37 commercial apple juices avai -lable on the market of the South of Brazil (Rio Grande do Sul State), only three samples were upper the amount of 50 µg.L-1 recommended by the World Health Organization. From these
sam-Conclusions
This method was successfully applied to the extraction and analyze of patulin from apple juice (Soya-added, nectar or 100% apple juice) and only three samples (8.1% of the total) had pa-tulin contamination level higher than 50.µg.L-1.
The proposed method is simple, cheaper and can be used for routine analyses because allo-ws to extract several samples at the same time using a short period of time. In this work, it was possible to extract 10 to 12 samples in less than one hour, and it depends on the size of the ultra-sonic bath and sample extraction vials. Only 6 mL of acetonitrile and 20 mL of ethyl acetate was used by sample, what contributes to minimize the chemical residue when compared to liquid-liquid extraction in the oficial method [18,19].
The ultrasonic technique described here, using a combination of two non-miscible solvents together (water in the apple juice and ethyl aceta -te), permitted a rapid extraction in only one step, solvent reduction and good reproducibility and re-covery, as seen in the validation parameters obtai-ned. Finally, the low quantiication limit permits analysis of reduced quantities of samples.
acknowledgements
resumo: O objetivo deste trabalho foi desenvolver um método simples e rápido para preparação de amostras para análise de patulina em sucos de maçã sem “clean-up” prévio. Este método combina os métodos de extração líquida com o ultrassom e foi utilizado para a determinação de patulina em 37 amostras de suco de maçã disponíveis no mercado do sul do Brasil. Os pa-râmetros estatísticos para validação do método foram obtidos através de fortificação de suco de maçã, obtido no mercado local, em cinco níveis de concentração de patulina e realizadas em triplicatas. O coeficiente de variação para a repetibilidade no nível de fortificação de 20,70
µg.L-1 foi de 3,53 % e a recuperação de 94,63 %. O coeficiente de correlação foi de 0,9996 e este valor está de acordo com os requisitos de linearidade de um método analítico. O limite de detecção obtido foi de 0,21 µg.L-1 e o limite de quantificação de 0,7 µg.L-1 . Somente três das amostras analisadas tiveram valores superiores ao limite de 50,00 µg.L-1 recomendado pela Organização Mundial da Saúde.
palavras-chave: patulina, CLAE/UV, suco de maçã, extração por ultrassom, método rápido de preparação de amostra.
references
[1] C-L. Lai, y-M.Fuh, D.y-C. Shih, J. Food and Drug Anal.,
8, (2000), 85.
[2] R.Rovira, F.Ribera, V.Sanchis and R.Canela, J. Agric. Food Chem., 41, (1993), 214.
[3] M. A. J.Harrison, Food Safety, 9, (1989), 147.
[4] http://www.fda.gov/ora/science_ref/lm/vol4/section/07. pdf, accessed in August, 20th , 2008.
[5] M.M.Moake, O.I. Padilla-Zakour and R.W.Worobo,
CRFSFS, 1, (2005),8.
[6] IARC Monographs on the Evaluation of the Carcinogenic Risk of Chemicals to Humans, 40 (1986), 8398.
[7] http://www.micotoxinas.com.br/boletim37.pdf, accessed in August, 20th, 2008.
[8] WHO- In Evaluation of certain food additives and contaminants. Forty-fourth report of the joint FAO/WHO expert committee on food additives, Geneva, 1995, Technical Report Series 859.
[9] S.M. Wang, and W.L.yang, Biotechnology, 13, (2003), 18.
[10] G. Boonzaaijer, I.Bobeldijk and W.A.van Osenbruggen,
Food Control , 16, (2005), 587.
[11] J-K Li, R-N Wu, Q-H Hu and J-H Wang,. Food Control, 18, (2007), 530.
[12] J.A.G.Roach, K.D.White, M.W. Trucksess and F.S.Thomas, J. AOAC Int. , 83, (2000), 104.
[13] V.Sewram, J.J.Nair, T.W.Nieuwoudt, N.L. Leggott and G.S.Shephard,, J. Chromatogr. A,897,(2000), 365.
[14] M.Takino, S.Saishima and T.Nakahara, Rapid Comm. Mass Spectrom., 17, ( 2003), 1965.
[15] M.A. Iha, and M.Sabino; J. AOAC Int.., 89, (2006), 139.
[16] S. R. Sargenti and W.Vichnewski, Phytochem. Anal.11, (2000), 69.
[17] INMETRO - In Orientações sobre validação de métodos de ensaios químicos. DOQ-CGCRE-008. Rev.01, 2003. [18] AOAC International. In Official Methods of Analysis of AOAC International. AOAC Int. Gaithersburg, 16th ed., 3rd
rev., 1997.