www.scielo.br/eq
Volume 35, número 2, 2010
23 Ecl. Quím., São Paulo, 35 - 2: 23 - 32, 2010
Artigo/Article
ViSCometriC inVeStigationS and moleCular
interaCtionS of Some deriVatiVeS of
5-SubStituted indole diHydropyrimidineS in
mixed organiC SolVentS
L. C. Heda, Rashmi Sharma, S. R. Mosalpuri and Pramod B. Chaudhari* Research Laboratory, Dept. of Chemistry, S.D. Govt. College, Beawar, 305901, Rajasthan, (India).
*Corresponding author, Tel.: +919052168560 E-mail: [email protected]
abstract: Colloid chemical behavior of indole dihydropyrimidines in non-aqueous solvent mix-ture benzene-methanol of varying composition has been investigated by viscometric measure-ments at 303K± 0.1. The viscosity of the system increases with the increase in concentration. The Trend Change Point (TCP) values have been determined by intersection of two straight lines, which are found to be dependent on the composition of solvent mixtures. The study confirms that the nature of synthesized compounds agglomerate formed below and above 50% benzene concentration is quite different. The viscometric data have been analyzed in terms of Einstein, Vand, Moulik and Jones-Dole equations. These well known equations have been successfully applied to explain the results of viscosity measurements and the viscometric pa-rameters show that the behavior of compound changes in the proximity of 50% benzene con-centration.
Keywords: Substituted indoles, Dihydropyrimidines, Trend change point, viscosity, and Solute-Solvent in-teraction.
introduCtion
In the family of heterocyclic compounds Nitrogen containing heterocycles are an important class of compounds in the medicinal chemistry and also contributed to the society from biological and industrial point which helps to understand life processes.1This seems to be because pyrimidines
represents one of the most active class of compoun-ds possessing wide spectrum of biological activity viz. signiicant in vitro activity against unrelated DNA and RNA, viruses including polio herpes viruses, diuretic, antitumor, anti HIV, cardiovas-cular.2Biginelli compounds show a diverse range
of biological activities. The interest focused on
Biginelli compounds leading to the development of Nitractin, 3 that has excellent activity against
the virus of trachoma group, the same compounds also exhibit antibacterial activity.4-Aryl dihydro-pyrimidines e.g. Nifedipine are the important and most studied class as Calcium channel modulars, in 1975 their introduction in clinical medicine for the treatment of cardiovascular diseases.4 some of
the analogues were screened as antitumor agents. Pyrimidine –5-carboxamide of type was reported to possess anticarcinogenic activity,
anti-inlammatory, 5 analgesic.6 The topsentins, as
pro-Ecl. Quím., São Paulo, 35 - 2: 23 - 32, 2010 24
Artigo Article
ducts act as cytotoxic and antifungal compounds belongs to class noprtopsentins.7 The presence of
highly substituted indole and indolines in a va-riety of bioactive molecular targets has inspired a number of groups including ours to develop new and improved routes to their synthesis.8 Recently
there is a much interest in the synthesis of small molecules for chemist in accelerating drug disco-very.9
In the view of the potential applications of these compounds, present work has been un-dertaken to explain colloid chemical behavior in mixed solvents. Benzene and methanol has been chosen as the co solvents in the title study. The mixed solvents have a tendency to interact with compounds, which affect the aggregation of molecules. The viscosity data based on various equations has been extensively used to furnish information concerning the structural changes in solution trend change point (TCP) and nature of molecule-solvent interaction. This vital informa-tion plays an important role in their selecinforma-tion for various industrial and biological applications.
experimental
The most obvious approach for carrying out the synthesis of substituted indole dihydropyrimi-dines is due to potent biological activity of indo-les as well as dihydropyrimidines. The synthesis begins from the commercially available indole; we were able to synthesize 5-substituted indoles in three steps using known protocol.10 The
fur-ther formylation with DMF/POCl3 by Wismeyer – Hack method to obtain Indole 3-carboxaldehyde in good yields.11
In cyclocondensation reaction of indole carboxaldehyde, thiourea and ethylacetoacetate in
the presence of acid catalyst by reluxing in etha
-nol to afford indole dihydropyrimidines (1).12
N H
NH NH
C2H5OOC S
R
Compound R A H B Br C Cl D I
1
Correlating 1H NMR and IR data with data for corresponding compounds made the structu-ral assignments for indole 3-carboxaldehydes and indole dihydropyrimidines. Solubility of com-pounds in benzene and methanol was determined by preparing solutions of compounds in solvents. The viscosity of the solutions was measured by Ostwald′s viscometer in thermostat bath. The vis-cometer was calibrated frequently with distilled water.
reSultS and diSCuSSion
Ecl. Quím., São Paulo, 35 - 2: 23 - 32, 2010 25
Artigo Article
table – 1.Viscosity, η, of compound A in benzene-methanol at 303K ± 0.1 in poise
Volume % of methanol
Conc 40% 60% 80% 100%
0.0002 0.589 0.566 0.549 0.529
0.0004 0.604 0.581 0.561 0.541
0.0006 0.616 0.593 0.570 0.551
0.0008 0.620 0.599 0.574 0.553
0.0010 0.627 0.604 0.580 0.557
0.0012 0.634 0.612 0.585 0.561
0.0014 0.643 0.619 0.589 0.564
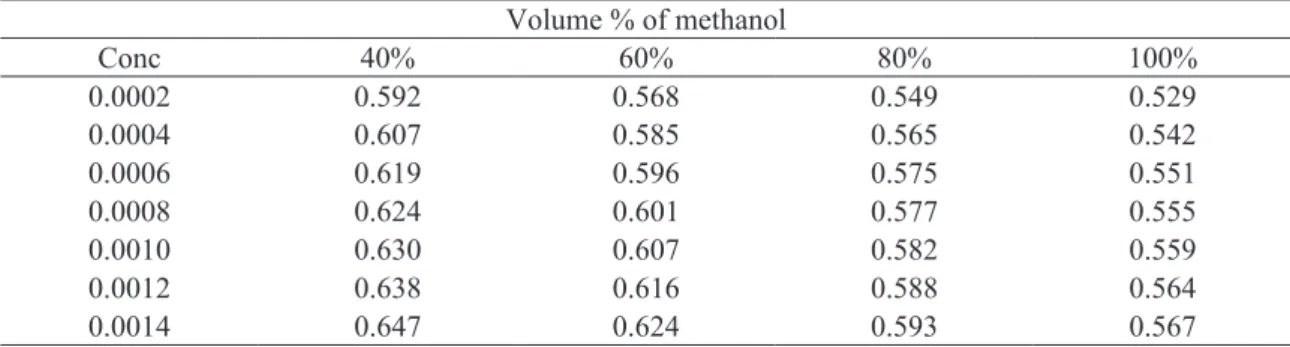
table – 2. Viscosity, η, of compound B in benzene- methanol at 303K ±0.1 in poise
Volume % of methanol
Conc 40% 60% 80% 100%
0.0002 0.592 0.568 0.549 0.529
0.0004 0.607 0.585 0.565 0.542
0.0006 0.619 0.596 0.575 0.551
0.0008 0.624 0.601 0.577 0.555
0.0010 0.630 0.607 0.582 0.559
0.0012 0.638 0.616 0.588 0.564
0.0014 0.647 0.624 0.593 0.567
table – 3. Viscosity, η, of compound C in benzene- methanol at 303K ±0.1 in poise
Volume % of methanol
Conc 40% 60% 80% 100%
0.0002 0.591 0.571 0.551 0.533
0.0004 0.614 0.593 0.569 0.546
0.0006 0.627 0.606 0.581 0.559
0.0008 0.632 0.610 0.586 0.565
0.0010 0.639 0.616 0.593 0.570
0.0012 0.646 0.620 0.596 0.573
0.0014 0.651 0.629 0.600 0.576
table – 4. Viscosity, η, of compound D in benzene-methanol at 303K ± 0.1 in poise
Volume % of methanol
Conc 40% 60% 80% 100%
0.0002 0.596 0.573 0.553 0.535
0.0004 0.621 0.595 0.573 0.551
0.0006 0.635 0.609 0.587 0.564
0.0008 0.641 0.615 0.592 0.568
0.0010 0.647 0.621 0.596 0.571
0.0012 0.652 0.627 0.599 0.573
Ecl. Quím., São Paulo, 35 - 2: 23 - 32, 2010 26
Artigo Article
The increase in viscosity with the increa-se in concentration may be due to the increasing tendency of molecules to associate in the form of clustering entity in the solvent system. The numbers of workers have reported the molecular interaction and characterizing aspects of physico-chemical behavior of binary liquid mixtures and mixed solvent.13 The difference in the viscosities
of solutions in varying composition of benzene-methanol mixtures is mainly due to the differen-ce in the viscosities of the solvent mixtures. The plots of viscosity (η) against concentration (C) are characterized by an intersection of two straight li-nes at a deinite concentration corresponding to TCP of the molecule (Fig.1-4).
FIG 1
0.50 0.52 0.54 0.56 0.58 0.60 0.62 0.64
0 0.0004 0.0008 0.0012 0.0016
C(mol/l)
η
40 60
80 100
η
η η
Φ Φ
.0016
η
40
60 80
100
FIG 2
0.50 0.52 0.54 0.56 0.58 0.60 0.62 0.64
0 0.0004 0.0008 0.0012 0.0016
C(mol/l)
η
40
60
80
100
η
C(mol/l)
η
Φ
C(mol/l)
Φ
η η
FIG 3
0.50 0.52 0.54 0.56 0.58 0.60 0.62 0.64
0 0.0004 0.0008 0.0012 0.0016
C(mol/l)
η
40
60
80
100
η
Φ Φ
η η
.0016
η
40
60
80
100
FIG 4
0.50 0.52 0.54 0.56 0.58 0.60 0.62 0.64
0 0.0004 0.0008 0.0012 0.0016
C(mol/l)
η
40
60
80
100
Φ
C(mol/l)
Φ
fig. 1-4 Plot of η versus C for compound A-D in
benzene-methanol.
Ecl. Quím., São Paulo, 35 - 2: 23 - 32, 2010 27
Artigo Article
of benzene increases which may be attributed to the cumulative effect of the variation of dielectric constant, degree of aggregation and the nature of the agglomerate.
The values of speciic viscosity (ηsp) of
so-lutions in varying compositions of benzene-me-thanol mixtures also increase with the increase in the concentration.
η η
η η
FIG-5
1.5 1.6 1.7 1.8 1.9 2.0
0 0.0004 0.0008 0.0012 0.0016
C(mol/l)
Φ
40
60
80
100
Φ
η η
η η
.0016
Φ
40
60
80
100
FIG-6
1.5 1.6 1.7 1.8 1.9 2.0
0 0.0004 0.0008 0.0012 0.0016
C(mol/l)
Φ
40
60
80
100
FIG-7
1.5 1.6 1.7 1.8 1.9 2.0
0 0.0004 0.0008 0.0012 0.0016
C(mol/l)
Φ
40
60
80
100
Φ
η η
η η
.0016
Φ
40
60
80
100
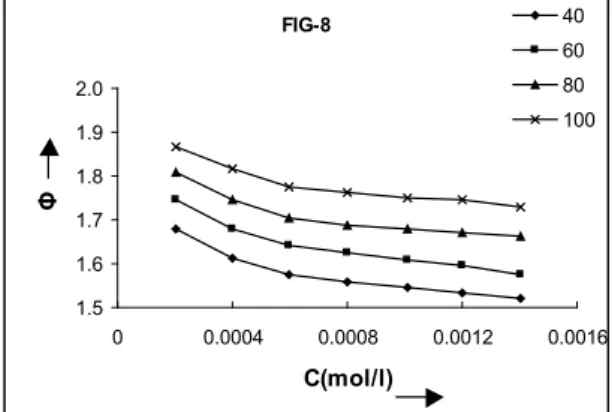
FIG-8
1.5 1.6 1.7 1.8 1.9 2.0
0 0.0004 0.0008 0.0012 0.0016
C(mol/l)
Φ
40
60
80
100
η η
η η
fig. 5-8 Plots of φ versus C for vompound A-D in
benzene-methanol.
The nature of curves and TCP values are in good agreement with those observed for vis-cosity data. The luidity of solutions in benzene-methanol mixtures decreases with the increase in the concentration as well as with the increase in volume percent of benzene (Fig. 3). A perusal of Table-2 indicates that TCP values are in good agreement with those derived from viscosity and speciic viscosity curves and are dependent on the solvent composition.
The viscosity results have been explained in terms of equations proposed by Einstein14 and
Vand. 15
einstein: ηsp= 2.5 V C
Vand: 1/C = (0.921/V) x [1/log (η/η0)] + QV
Where V, C, Q, η,η0 and ηsp are molar
volu-me, concentration, interaction coeficient, viscosi
-ty of the solution, viscosi-ty of solvent and speciic
viscosity respectively. The plots of speciic vis
-cosity (ηsp) against concentration (C) are charac-terized by an intersection of two straight lines at a deinite concentration, which corresponds to the TCP. The plots with intercept almost equal to zero are linear below TCP, which shows that the equa-tion proposed by Einstein are applicable to dilute solutions. 16 It is observed that the values of
Ecl. Quím., São Paulo, 35 - 2: 23 - 32, 2010 28
Artigo Article
table – 5. Values of molar volume (V) in benzene – methanol derived from Einstein and Vand equations compound %of methanol Einstein equation Vand equation
V1 V2 V1 V2
compound A 40% 47.6600 27.7372 80.3960 53.9520
60% 48.2680 24.8596 68.5360 59.0760
80% 38.7288 19.1484 74.9440 51.6160
100% 42.0640 14.0272 55.5680 48.3600
compound B 40% 46.7800 26.7800 93.2760 59.1720
60% 51.7280 28.4644 75.4320 56.8120
80% 48.3360 19.5212 72.6560 55.5640
100% 42.8600 15.5160 56.5880 50.6400
compound C 40% 63.7520 22.6224 92.9160 77.2280
60% 63.7520 22.6224 84.0840 75.8240
80% 56.4240 16.6068 80.4800 71.1320
100% 51.2000 14.3560 71.6560 66.2600
compound D 40% 68.5840 19.0068 106.9400 88.4320
60% 65.9360 23.5528 96.2720 82.1600
80% 63.5680 11.9428 86.6320 81.6600
100% 55.4640 12.4064 83.2640 71.3760
It is interesting to note that the values of molar volume enumerated from these equations are almost equal and the trend remains unaltered irrespective of the type of equation applied.
Φ Φ
FIG -9
0.00 0.05 0.10 0.15
0.0000 0.0004 0.0008 0.0012 0.0016
C(mol/l)
ηsp
40
60
80
100
η
η η
Φ Φ
016
η
40
60
80
100
FIG -10
0.00 0.05 0.10 0.15
0.0000 0.0004 0.0008 0.0012 0.0016
C(mol/l)
ηsp
40
60
80
100
Ecl. Quím., São Paulo, 35 - 2: 23 - 32, 2010 29 Artigo Article Φ Φ η η FIG -11 0.00 0.05 0.10 0.15
0.0000 0.0004 0.0008 0.0012 0.0016
C(mol/l) ηsp
40 60 80 100 η Φ Φ η η 016 η 40 60 80 100 FIG -12 0.00 0.05 0.10 0.15
0.0000 0.0004 0.0008 0.0012 0.0016
C(mol/l)
ηsp
40
60
80
100
fig. 9-12 Plot of ηsp versus C for compound A-D in
benzene-methanol.
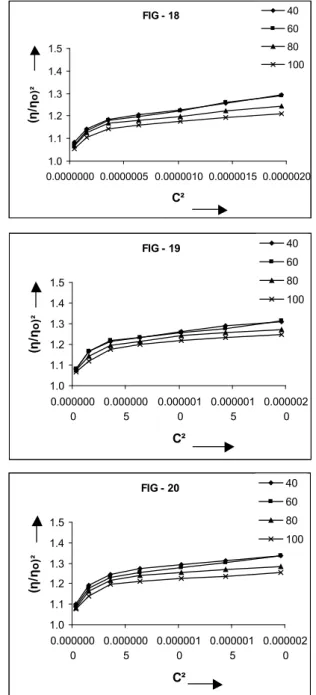
The Moulik equation.17 also its well to the
solutions, as the plots (η/η0) 2 vs. C2 are almost
linear. (η/ η0 )
2 = m + KC2
Where M and K are constants.
The values of M and K have been calcula-ted from the intercepts and slopes of the (η/η0) 2
vs. C2 plots and are recorded in Table-6.
ψ / C ψ / C ψ / C ψ / C
FIG - 17
1.0 1.1 1.2 1.3 1.4 1.5
0.0000000 0.0000005 0.0000010 0.0000015 0.0000020
C² (η /ηο) ² 40 60 80 100 (η /ηο) ² ψ / C ψ / C ψ / C ψ / C 0020 (η /ηο) ² 40 60 80 100
FIG - 18
1.0 1.1 1.2 1.3 1.4 1.5
0.0000000 0.0000005 0.0000010 0.0000015 0.0000020
C² (η /ηο) ² 40 60 80 100
FIG - 19
1.0 1.1 1.2 1.3 1.4 1.5 0.000000 0 0.000000 5 0.000001 0 0.000001 5 0.000002 0 C² (η /ηο) ² 40 60 80 100 (η /ηο) ² (η /ηο) ²
FIG - 20
1.0 1.1 1.2 1.3 1.4 1.5 0.000000 0 0.000000 5 0.000001 0 0.000001 5 0.000002 0 C² (η /ηο) ² 40 60 80 100
fig.17-20 Plot of [η/η0]2 versus C2 for compound
A-D in benzene-methanol.
The viscosity data have also been interpre-ted in the light of Jones-Dole equation.18
(η/η0-1)/√C = A + B√C
For convenience, the equation may be ex-pressed as
Ecl. Quím., São Paulo, 35 - 2: 23 - 32, 2010 30
Artigo Article
Where the coeficient A and B refer to so
-lute-solute and solute-solvent interactions respec-tively. The plots ψ / √C vs.√C
FIG - 13
1.5 2.0 2.5 3.0 3.5 4.0
0.000 0.010 0.020 0.030 0.040 0.050
C ψ / C 40 60 80 100 ψ / C ψ / C ψ / C (η /ηο) ² (η /ηο) ² .050 ψ / C 40 60 80 100
FIG - 14
1.5 2.0 2.5 3.0 3.5 4.0
0.000 0.010 0.020 0.030 0.040 0.050
C ψ / C 40 60 80 100 ψ / C ψ / C (η /ηο) ²
FIG - 18
C² (η /ηο) ² 40 ψ / C ψ / C
FIG - 15
2.0 2.5 3.0 3.5 4.0 4.5
0.000 0.010 0.020 0.030 0.040 0.050
C ψ / C 40 60 80 100 ψ / C (η /ηο) ² (η /ηο) ² ψ / C ψ / C .050 ψ / C 40 60 80 100
FIG - 16
2.5 3.0 3.5 4.0 4.5 5.0
0.000 0.010 0.020 0.030 0.040 0.050
C ψ / C 40 60 80 100 (η /ηο) ²
FIG - 18
C²
(η
/ηο)
²
40
fig.13-16 Plot of ψ /√C versus √C for compound
A-D in benzene-methanol.
Ecl. Quím., São Paulo, 35 - 2: 23 - 32, 2010 31
Artigo Article
table – 6. Viscosity parameters in benzene – methanol derived from different equations
compound % of
methanol
moulik equation jones-dole equation
m1 m2 K1 K2 a1 a2 b1 b2
compound A 40% 1.069 1.143 307187 70036 1.407 2.102 83.566 36.505
60% 1.060 1.150 308995 62869 0.861 2.430 99.986 25.952
80% 1.064 1.139 246195 47155 1.552 2.587 58.107 8.589
100% 1.049 1.130 266636 34176 0.568 2.742 92.133 -6.651
compound B 40% 1.080 1.159 301055 68177 1.995 2.666 66.859 25.271
60% 1.066 1.152 331527 71956 1.003 2.268 105.700 36.054
80% 1.064 1.150 308373 48528 1.029 2.884 96.627 4.645
100% 1.049 1.137 272615 37966 0.581 2.804 93.413 -3.860
compound C 40% 1.078 1.202 409288 57418 0.877 4.100 144.87 -5.829
60% 1.078 1.197 409288 58197 0.898 4.496 139.79 -20.573
80% 1.071 1.195 363636 41453 1.018 4.349 117.09 -24.338
100% 1.059 1.180 333095 35690 0.866 4.350 104.72 -27.271
compound D 40% 1.096 1.243 445140 49099 1.610 5.564 134.880 -37.644
60% 1.086 1.217 427059 60826 1.271 4.865 136.160 -22.329
80% 1.077 1.224 411421 30275 0.966 5.589 137.170 -55.580
100% 1.071 1.193 359936 31496 1.193 4.977 108.730 -49.811
It is observed that the values of these constants depend on the composition of the solvent mix-tures.
ConCluSion
It has been observed that the viscosity of the system increases with the increase in concen-tration. The increasing trend of viscosity may be due to combined effect of the variation of dielec-tric constant of solvent, degree of aggregation and nature of the compound agglomerate. The TCP values obtained from different viscosity data are in good agreement and show maximum concentra-tion of molecular dispersion at which aggregaconcentra-tion of molecule initiates.
It is noteworthy to point out on the basis of results obtained that the above treatment gives a
phenomenological description of clustering proi
-le and conirms the existence of aggregation in the non-aqueous mixed solvent.
references:
M.Gracia, Valverde and T. Torroba,
[1] Molecules, 10 (2005)
318.
C. O. Kappe,
[2] Terahedron, 49 (1993)6937.
T. Matsuda, J. Hirao,
[3] Nippon Kagaku Zasshi, 86 (1965)
1195.
Birgit Jauk, Tetiana Pernat and C. O. Kappe,
[4] Molecules.
5 (2000)227.
C. O. Kappe, G. Farber,
[5] J. Chem. Soc., Perkin Trans, 1
(1991) 1342.
y. S. Sadanandam, M. M. Shetty, P. V. Diwan,
[6] Eur. J. Med.
Chem.27 (1992) 87.
(7a) S. Sukemi, H. J. Sun,
[7] Org. Chem. 56 (1991) 4304.
(7b) y. Kawasaki, M. yamashita, S. Otha, Chem. Pharma Bull. 44 (1996) 1831.
Mieczyslaw, Makosza,
[8] Pure & Appl. Chem. 69(3) (1997)
559.
K. Lee, S. J. Moon, D. C. Ha, Kee- In Lee; y.D. Gong, and [9]
J. C. Lee, Bull Korean Chem. Soc. 27 (2006)7.
(10a) J. Thesing, G. Sembler, and G. Mohr,
[10] Chem. Ber.
Ecl. Quím., São Paulo, 35 - 2: 23 - 32, 2010 32
Artigo Article
M. Duflos, Marie – Renee J. Nourrisson, J. Brelet, [11]
Courant, Guillaume Le Baut, N. Grimoud, Jean – yves Petit.;
Eur. J. Med. Chem. 36 (2001)545.
(12a) D. S. Bose, L. Fatima, H. B. Mereyala,
[12] J. Org.
Chem. 68 (2003)587. (12b) J. Lu, y. Bai, Synthesis (2002) 466.
H. Suzuki,
[13] Journal of American Oil Chemists Society
47 (1969) 273. (13b) K.N. Mehrotra, V.P. Mehta, T.N. Nagar,
Journal fur Praktische Chemie 312 (4) (1970) 545. (13c) R.P. Verma, K. Singh, H. Singh, Annali di chimica 68(5) (1978) 415. (13d) V.P. Mehta, M. Hasan, L.C. Heda, Afinidad 39 (1982) 385.
A. Einstein,
[14] Annalen der Physik 19 (1906) 289.
V. Vand ,
[15] Journal Physical Colloid Chemistry 52 (1948) 277.
K.N. Mehrotra, K. Tandon, M.K. Rawat,
[16] Journal of the
Indian Chemical Society 69 (1990) 719. S.P. Moulik,
[17] The Journal of Physical Chemistry 72
(1968) 4682.
G. Jones, M. Dole,
[18] The Journal of The American