© FECAP
RBGN
Review of Business Management
DOI: 10.7819/rbgn.v19i65.2918
469
Received on 01/06/2016 Approved on 11/23/2016
Responsible editor:
Prof. Dr. Ivam Ricardo Peleias
Evaluation process: Double Blind Review
Red flags in detecting credit cooperative
fraud: the perceptions of internal auditors
Cristian Baú Dal Magro
Paulo Roberto da Cunha
Regional University of Blumenau – FURB, Accounting Sciences Postgraduate Program – FURB, Blumenau, SC, Brazil
Abstract
Purpose – Red lags are mechanisms that can be used by internal auditors for early detection of possible fraud. In this context, the aim of this study was to identify the relevance credit unions’ internal auditors attribute to red lags in assessing fraud risk.
Design/methodology/approach – his article is characterized as descriptive concerning its goals, as a survey as to is procedures, and as quantitative in reference to its approach to the problem. he sample consists of 51 internal auditors working in Credit Union Centers in southern Brazil.
Findings – Results indicate that, in the assessment of fraud risk, internal auditors attribute greater importance to red lags referring to operational activities and internal control procedures. In addition, it is suggested that internal auditors are not impartial concerning their perception of relevance of most of the warning signs of the possibility of fraud.
Originality/value – he indings contribute by demonstrating to internal auditors the need for greater attention to the use of red lags as auditing tools.
1
Introduction
Constant market changes mean that the monitoring of organizations’ internal controls and processes does not happen in the same proportion, thus exposing them to vulnerability and threat of fraud. herefore, strict and timely monitoring of structures and internal control processes is necessary to appropriately deter, detect and respond to fraud.
Internal auditing is fundamental because of the responsibility of systematization, control, eiciency and efectiveness of all processes; it highlights the laws that can lead to fraudulent acts. Boynton, Johnson and Kell (2002) point out that internal auditing assists management in fulilling its responsibilities, and is a control component of resource allocation (waste and neglect) and a factor in anticipating occurrences (Santos & Vier, 2014).
From this perspective, internal auditing plays an important role in minimizing the occurrence of fraudulent acts, helping goals to be achieved through a systematic and disciplined approach, in order to evaluate and improve the efectiveness of risk management, control and governance processes (Pickett, 2005; Rittenberg & Schwieger , 2005). Similarly, the Brazilian Accounting Standard T 12 (2008) establishes internal auditing as the set of technical procedures used to examine the integrity, adequacy and efectiveness of internal controls and of entities’ physical, accounting, inancial and operational information.
he function of internal auditing is to adapt, evaluate and conirm the operation of internal control; to establish efective procedures for risk management; and to conirm the quality and reliability of the information generated by management (Pickett, 2005). As well as internal auditing, in 2002 the US government established the Sarbanes-Oxley Act, in order to restore capital markets’ and professional auditors’ credibility, facing the great amount of fraud in internationally renowned companies. The Sarbanes-Oxley Act created a new environment for corporate
governance and a set of responsibilities and sanctions for managers, in order to curb harmful practices.
Despite the existence of mechanisms and laws and of internal auditing to mitigate the occurrence of fraudulent acts, KPMG Forense (2009), in a study of Brazilian companies, indicates that 70% had suffered some kind of fraud over the last two years. In addition, American investigation company Kroll found that 74% of all Brazilian companies had sufered at least one episode of fraud over the last 12 months (Kroll, 2013).
he increase in the occurrence of fraud has expanded the responsibility of internal auditors concerning detection and prevention. In this way, red lags are mechanisms that can be used by internal auditors to anticipate possible frauds. Red flags represent key symptoms to detect fraud, and internal auditing professionals can use them to better identify possible aggressions to organizations’ assets (Pinheiro & Cunha, 2003).
Due to the increase in fraud that has been globally reaching public and private companies, and to the importance of red flags to detect fraud through internal auditors, it is necessary to investigate the use of these instruments by internal auditing (Pinheiro & Cunha, 2003). Moreover, the risk of fraud is perceived as dominant in all organizational segments and forms (KPMG, 2009), and it is important to carry out research involving credit unions.
Studies by Murcia, Borba and Schiehll (2008), and by Reina, Nascimento and Reina (2008) discuss red flags to detect fraud in inancial statements, and the role of independent auditors, responsible for issuing the auditing report on inancial statements, in minimizing these occurrences. his evidence demonstrates the gap in this research, which difers by discussing the warning signs of fraud within management, control and internal organization of credit unions, using the role of internal auditors in the prevention and detection of fraud as a premise.
Young and Mohamed (2013), Moyes, Lin, Landry and Vicdan (2006), who ofer relevant results on fraud in inancial reports; nevertheless, they do not discuss the beneits of warning signs in the prevention and detection of fraud referring to the personal aspects of organizational members, of internal controls and of management, amongst others, that occur in the internal environment. Therefore, the contribution and the novelty of this research is that it provides, to internal auditors, warning parameters that are capable of anticipating the occurrence of fraud which is not only referring to inancial statements, since they occur throughout the organizational process.
We contribute to the discussion around the fact that internal auditing, used in the prevention and detection of fraudulent acts, is an ex-ante phenomenon to the issuance of auditors’ reports, which also aims to observe whether there is possible fraud in inancial statements. his study is based on the argument that internal auditors may not be held responsible for the non-identiication of fraudulent acts, and that their perception of fraud can be distorted by emotional and professional bonds they have with the organization and its members. As previously stated, the powers and the institutional environment in which internal auditors operate is diferent from that of independent auditors; they have speciic and standardized assignments, without any institutional or personal connections with the audited organizations.
In addition, the subject of assessment and detection of fraud by auditors is incipient in Brazil (Murcia, Borba & Schiehll, 2008). Uretsky (1980) suggests the need for an interdisciplinary approach to the study of fraud and the need for research on the use of red lags as situational indicators. Similarly, the igures presented by KPMG (2009) and Kroll (2013) on cases of fraud in Brazilian companies demonstrate the potential of the Brazilian environment for studies involving the topic of red lags.
Finally, studies on the relevance of red lags in assessing the risk of fraud were focused
on external and independent auditors who work in sectors other than inancial. hus, this study is distinguished from the approach focused on the perception of internal auditors about the relevance of red lags to evaluate fraud in Credit Unions.
Credit unions were chosen by their level of importance in promoting growth as well as the economic and social development in Brazil, where the service network of credit unions represents 18% of bank branches, and occupies the 6th position in the ranking of assets – and is, therefore, among the largest retail inancial institutions in the country. hus, auditing mechanisms are used by credit unions to maintain their integrity and image with members, customers and society, and in to achieve greater reliability when carrying out operations and processes.
In this context, this study aims to determine the relevance internal credit unions’ auditors attribute to red lags in assessing the risk of fraud.
2
I n t e r n a l a u d i t i n g i n t h e
prevention and detection of fraud
Internal auditing is designed to add value and improve the operations of an organization, assisting in the achievement of organizational objectives by a systematic and disciplined approach to evaluate and improve the risk management of operational eiciency, control and governance process (Pickett, 2005; Rittenberg & Schwieger, 2005).
Internal auditors have proper knowledge to analyze the possible occurrence of fraud and to conduct routine follow-up investigations. Corroborating the fact, evidence point out that the fraud at WorldCom was detected at irst by the internal auditing team (Rittenberg & Schwieger, 2005).
important and leaves a trace that can help auditors uncover the possibility of fraud.
Mo re ove r, w h e n t h e re i s f r a u d , organizations ind it diicult to assess the damage; this is justiied because not all fraud is discovered and reported, and the victim not always seeks civil or criminal compensation. Evidence indicates that in 68% of cases of fraud there is no recovery of values. Organizations located in Brazil remain passive in relation to acts of fraud, making it a fertile ground for its occurrence (KPMG, 2009). In addition, 55% of organizations consider that the internal auditing is responsible for implementing anti-fraud controls, focusing on technology tools and data analysis to identify red lags (KPMG, 2009).
Inefficiency in internal controls, the country’s economy, failure in the banking system, ineicient police, type of business, collusions, management replacement, incompetence and ignorance are some of the factors that can contribute to the occurrence of fraud in organizations (Krambia-Kapardis, 2003).
he factors that favor the occurrence of fraud are relevant, but the steady increase in cases has been attributed to the beneits and impunity, when often organizations fail to prosecute and the fraudsters do not have sufer adequate punishment by Justice. On the other hand, detecting the presence of fraud is diicult because of the lexibility and subjectivity inherent to the implementation of certain standards, as well as the lack of record of all transactions in the so-called oicial accounting (Murcia et al., 2008).
Doubts about the credibility of auditing do not minimize its importance and usefulness in the discovery of fraud. Auditing provides anticipation and ofers actions against fraudulent acts (Pinheiro & Cunha, 2003). Critical sense, auditing technique, document analysis technique, sampling, circularization and survey used by auditors in performing their duties help to identify and minimize the occurrence of fraudulent events (Pinheiro & Cunha, 2003).
Internal controls are also used by auditors in fraud prevention and detection, and reveal
information hidden in the accounting system. According to Wells (1990), 20% of fraud is detected by auditors, and they are necessary to the development of procedures or strategies that are focused on fraud detection. In credit unions the effective action of auditing and internal control is perceived by the inspectors as a fraud mitigation factor (Oliveira, 2012).Therefore, the contribution of this study is to identify additional factors – red lags – that can serve as auxiliary mechanisms to internal auditors on the efectiveness of their duties.
he Central Bank of Brazil – BACEN (1998) points out that auditing and internal control must be efective and consistent with the nature, complexity and risk of operations. To Migliavacca (2004), auditing and internal control contribute to safeguarding of assets, business development and increase in operational results. Credit unions’ surveillance and monitoring authorities seek to reduce the risks of inancial activity, controlling actions by means of regulatory requirements, among which internal auditing and internal control are highlighted (Oliveira, 2012).
Internal auditing has undergone changes, not only evaluating internal controls but also having a senior management advisory role, providing corrective and preventive recommendations on the institutional risk (Santos & Vier, 2014). So that fraudulent activity may be detected, auditors must learn and recognize the symptoms linked to the existence of favorable conditions (Cottrell & Albrecht, 1994). Therefore, a favorable environment for the occurrence of fraud can be identiied by red lags or warning signs (Albrecht, 2003).
3
Red flags in assessing risks of
fraud
or personal characteristics that can cause interest in frauds, whether on behalf of the company itself or for any personal gain (Romney, Albrecht & Cherrington, 1980).
Red flags indicate warning signs to auditors about certain situations occurring in the organizational environment (Uretsky, 1980). Albrecht and Romney (1986), Eining, Jones and Loebbecke (1997), Bell and Carcacello (2000) and Wells (2005) point out that excessive pressure on executives to achieve organizational goals can create a favorable environment to fraud. Although red lags may not necessarily indicate the presence of fraud, they often show commonly present conditions in fraudulent events (Uretsky, 1980). hus, red lags increase the perception of risk and facilitate auditors’ judgment in the discovery of fraud (Kneer, Reckers & Jennings, 1996).
Knowledge of red lags provides a better understanding of the conditions that favor the occurrence of fraudulent acts. However, each individual may have diferent views about the warning signs, and the diferent perceptions can be explained by auditors’ accounting knowledge, experience in the position or function, gender, age and education (Murcia et al., 2008).
Albrecht (2003) points out that red lags are used to assist in mapping a fraudulent environment. herefore, in organizations with an inadequate or fragile internal control environment the probability of fraud is increased (Albrecht & Romney, 1986; Wells, 2005). Migliavacca (2004) mentions that there are other factors contributing to the provision of warning signs, such as the moral integrity of managers, pressure on top management and favorable conditions. Cottrell and Albrecht (1994) explain that accounting irregularities, deiciencies in controls, analytical anomalies, changes in lifestyle and behavior of managers can be used as red lags for the identiication and assessment of fraud risk.
Auditors need to understand the warning signs, and then react with attitude and consistency. To Groveman (1995), the most frequent causes of auditing failure in the identification and
evaluation of fraud refer to inexperienced teams and attitudes of indiference as to warning signs. Hackenbrack (1993) argues that inexperienced auditors do not recognize red lags with the same intensity that experienced auditors do. On the other hand, Green and Calderon (1996) suggest that training can improve the perception of auditors concerning the identiication of risk factors.
Foster, Karcher and Levitan (2003) found that men and women are equally adept at technology, but difer in the assessment of organizational controls and or warning signs. However, Schwartz and Wallin (2002) reported no diferences between males and females in relation to the disclosure rate of fraudulent acts. Finally, Robertson (1997) states that the sharp drop in revenue and market share and unrealistic budget pressures are factors that can determine the occurrence of fraud. Kaplan and Reckers (1995) suggest that the change in lifestyle of the members of management, compensation programs and weaknesses in the audit department are usable red lags in the assessment of fraud risks.
4
Studies on red lags in the auditing
ield
Koornhof and Du Plessis (2000) conducted a survey of investors and creditors from South Africa on the use of red lags. A questionnaire was sent to bank secretaries (representative of creditors) and portfolio managers (investors’ representatives). The results indicated that creditors and investors in South Africa are aware of the beneits ofered by red lags as a warning system for fraud detection.
Moyes, Lin, Landry and Vicdan (2006) investigated the perception of 82 internal auditors on the efectiveness level of 42 red lags for detecting fraudulent inancial reports. he results indicate that 15 red lags were perceived as more effective, 14 as effective and 13 as inefective. Finally, the results show that internal auditors evaluate red lags labeled as incentives and pressures the most efective ones in detecting fraudulent inancial reports.
Murcia et al. (2008) analyzed the perception of independent auditors on the relevance of red lags in assessing the risk of fraud in inancial statements. hey selected 45 red lags which were divided in 6 groups: structure and environment, sector/industry, managers, economic and financial situation, financial reporting and external auditing. The results suggest that 95.56% of red lags show a medium or high risk in the evaluation process of fraud in inancial statements. Furthermore, the six groups of red lags showed individually an average greater than or equal to 3.35 with respect to a scale of importance from 1 to 5 points.
Moyes (2011) analyzed the different perceptions between internal and external auditors on fraud detection level of 42 red lags. he results indicate that there is no diference in the perception of internal and external auditors concerning red lags. In addition, the study found evidence that 17 red lags have diferences in eicacy for fraud detection. For external auditors the use extension and exposure to red lags were
predictors of the perception of efficacy. For internal auditors the efectiveness in detecting frauds was due to experience. Finally, female auditors rated the efectiveness of red lags in greater proportion, attributing a higher value to such indicators to fraud warning.
Moyes, Young and Mohamed (2013) found the perception of internal and external auditors of Malaysia on 99 red lags used for fraud detection. he Standard Auditing Statement (SAS) from the US and international auditing standards require the external auditors to use red lags in order to detect fraudulent activities in inancial reports. he results showed that the external and internal auditors perceive diferent levels of efectiveness of red lags and diferences were found between the perceptions of internal and external auditors on the efectiveness of 12 red lags.
The study by Smith, Omar, Idris and Baharuddin (2005) aimed to identify red lags perceived individually by auditors as most important, and explored the demographics of Malaysia’s auditors about the impact on the perception of importance of red flags. They concluded that individuals indicated operational category and financial stability as the most important, followed by the features of inluenced management on the environment control and some characteristics of the industry itself. he perception of the auditors was not inluenced by demographic origins referring to gender, years of experience or type of auditing irm.
5
Methods
he research population consists of 246 internal auditors working in the Central Credit Union of Southern Brazil, registered with the Organization of Cooperatives in the State of Paraná - Brazil (OCEPAR), the Organization of Cooperatives in the State of Santa Catarina - Brazil (OCESC) and the Organization of Cooperatives in the State of Rio Grande do Sul - Brazil (OCERGS).he survey sample was designed in view of the research instrument return, totaling 51 respondents.
For the construction of the survey instrument, firstly studies on red flags were identified. Secondly, studies mentioning possibilities of useful warning signs to identify fraud were selected. Finally, red lags that were adaptable to the perception of internal auditing were identiied, and in addition, liable to check warning signs in inancial institutions and credit unions.
Given the above, the first stage of the questionnaire aimed to characterize the respondents (gender, age, academic area, time experience in the position of internal auditor
and if the auditor has professionally experienced fraud).
he second stage was used to verify the perception of internal auditors on the relevance of red lags on fraud risk assessment. To clarify the matter to the respondent, the following quote was inferred: According to Parodi (2005), red lags are warning indicators that aim to detect possible fraud. It can be said that these signals serve as a thermometer in the prevention and detection of fraud. It was also made clear to respondents that the questions are assertions of possible occurrences and do not mean that they are actually taking place in the organization where they work.
he questionnaire on the perception of red lags was separated into attributes and the likert scale used was ive points ranging from very low (1) to very high (5). herefore, the irst attribute refers to the perception of auditors for possible red lags concerning the structure and environment of the Credit Unions. his attribute was composed of 13 questions adapted from studies referenced below, as shown in Table 1.
Table 1
Research instrument to assess the perception of internal auditors regarding the relevance of red lagsin the characteristics of structure and environment
No. Attributes Authors
01 he organizational structure of the branch is too complex. (e) (f)
02 he Credit Union does not have a punishment policy for dishonest acts. (f)
03 Communication of ethical and moral values by superiors does not occurs; and/or communication of some ethical and moral values is considered inadequate. (f)
04 here is a strong suspicion that branch managers are in partnerships with people outside the organization. (f)
05 here is an abnormal turnover of key personnel in the inancial and accounting ields. (a), (b), (d), (e), (f)
06 he Credit Union has diiculties in complying with the requirements of regulatory branches (Central Bank of Brazil). (b), (d), (f)
07 he board of directors and/or supervisory board did not adequately monitor operational and internal control systems. (a) (f)
08 here is an abnormal diference in the salaries of managers and employees in relation to the same segment entities and/or size. (b)
09 he Credit Union provides low investment in employee training. (b)
No. Attributes Authors
11 he branches do not adequately comply with regulations, instructions and policies established by cooperative management bodies. (c)
12 he Board of Directors or Supervisory Board did not adequately monitor the generation of inancial reports. (a) (f) 13 In the past, the Credit Union presented problems when publishing inancial reports. (a) (f) Source: Adapted (a) “he eicacy of a red lags questionnaire for assessing the possibility of fraud”, de K. V. Pincus, 1989, Accounting, Organizations and Society, 14, 153-163; (b) “Changing the model for prevention and detection of fraud”, de H. D. Glover e J. Y. Aono, 1995, Managerial Auditing Journal, 10, 3-9; (c) Resolução BACEN n. 2554, 1998; (d) “Red lagging as an indicator of inancial statement fraud: he perspective of investors and lenders”, de C. Koornhof e D. Du Plessis, 2000, Meditari Accountancy Research, 8, 69-93; (e) “Internal auditors’ perceptions of the efectiveness of red lags to detect fraudulent inancial reporting”, de G. D. Moyes et al., 2006, Journal of Accounting Ethics & Public Policy, 6, 1-28; (f ) “Relevância dos red lags na avaliação do risco de fraudes nas demonstrações contábeis: A percepção de auditores independentes brasileiros”, de F. D. R Murcia et al., 2008, Revista Universo Contábil, 4, 25-45.
Table 2
Research instrument to assess the perception of internal auditors regarding the relevance of red lagsin the characteristics of managers and employees
No. Attributes Authors
14 A signiicant part of the remuneration of managers and employees (represented by bonuses, awards and incentives) of audited branches is conditioned to the achievement of aggressive goals. (b) (f) (g)
15 Managers of audited branches are excessively interested in presenting satisfactory results. (a) (g) 16 Managers of audited branches are dishonest and unethical, presenting dubious character. (d) (g)
17 Managers of audited branches have an aggressive lifestyle (propensity to make decisions involving excessive risk), involving addictions (gambling, drinking and drugs) and intense greed. (a) (g)
18 Managers and employees of audited branches have low skills and little experience. (e) (g)
19 he Board of Directors exerts excessive pressure on managers of audited branches for compliance with
inancial goals. (f) (g)
20 Managers of audited branches often try to justify the use of operational procedures (credit release, routine operations, control routines) considered inappropriate. (g)
21 he manager and employees of audited branches do not have adequate knowledge about the importance of the credit union’s operational controls and internal policies. (h)
22 Managers and employees of audited branches rarely communicate or identify any deiciencies in operating systems and internal controls. (h)
23 Managers of audited branches have decision-making power to judge changes in the operational system and internal control of the branch and or cooperative. (w)
24 Managers of audited branches show above normal gratitude, presenting highly unselish interests – and are solicitous, eicient and thorough in showing the accountability of the branches. (e)
25 Managers and employees of audited branches, considered as having key roles, never take vacations. (e)
26 Managers of audited branches show a rapid change in lifestyle and discrepancy between wages and goods/
properties. (e)
27 Managers of audited branches have high personal debts and are unstable (frequent change of business, divorce, etc.). (a) The second attribute refers to the
perception of auditors for possible red lags on the characteristics of managers and employees,
No. Attributes Authors
28 Managers of audited branches have a strong association and friendship or relationship with customers who have large low of operations at branches. (a)
29 he Board of Directors and the Supervisory Board have excessive interest in maintaining and/or increasing the
disclosure of a growing trend of inancial surplus. (a)
Source: Adapted (a) “Red-lagging management fraud: A validation”, de S. Albrecht e M. Rommey, 1986, Advances in Accounting, 3, 323-33; (b) “he eicacy of a red lags questionnaire for assessing the possibility of fraud”, de K. V. Pincus, 1989, Accounting, Organizations and Society, 14, 153-163; (c) “Changing the model for prevention and detection of fraud”, de H. D. Glover e J. Y. Aono, 1995, Managerial Auditing Journal, 10, 3-9; (d) “Red lagging as an indicator of inancial statement fraud: he perspective of investors and lenders”, C. Koornhof e D. Du Plessis, 2000, Meditari Accountancy Research, 8, 69-93; (e) “A importância da auditoria na detecção de fraudes”, de G. J. Pinheiro e L. R. S. Cunha, 2003, Contabilidade Vista & Revista, 14, 31-48; (f ) “Internal auditors’ perceptions of the efectiveness of red lags to detect fraudulent inancial reporting”, de G. D. Moyes et al., 2006, Journal of Accounting, Ethics & Public Policy, 6, 1-28; (g) “Relevância dos red lags na avaliação do risco de fraudes nas demonstrações contábeis: a percepção de auditores independentes brasileiros”, de F. D. R Murcia et al., 2008, Revista Universo Contábil, 4, 25-45; (h) “Auditoria interna: Percepção de sua importância para resguardar ativos das organizações do ramo inanceiro”, de E. M. S. Negra, T. M. M. Viana e C. A. S. Negra, 2013, Anais do Congresso Integrado de Contabilidade, 1, recuperado de http://www.ujf.br/congreconti/iles/2013/11/A8.pdf
The third attribute refers to auditors’ perception regarding the relevance of red lags as to economic and inancial characteristics. his
attribute is made up of 8 questions adapted from studies referenced below, as shown in Table 3.
Table 3
Research instrument to assess the perception of internal auditors regarding the relevance of red lagsas to economic and inancial characteristics
No Attributes Authors
30 Credit Unions, generally speaking, are going through a time of decline and bankruptcies are increasing, causing losses to the members. (a), (b), (c)
31 In general, branches make a signiicant investment in a range of services that are subject to high interference from government regulation. (a), (c)
32 he market in which credit unions operate is highly competitive and saturated, generating a steady reduction in the results of cooperatives. (a), (c)
33 In the audited branches, a rapid growth or proitability is noticed, considered unusual for that branch, especially when compared to other branches. (a), (b)
34 In the audited branches, customers have high default rates. (a)
35 he working capital of audited branches is generally not considered enough to inance their operations. (a)
36 here are internal and external issues of the audited branches that cause doubts about the continuity of their activities. (a)
37 here are branches that are audited making transactions/operations (credit release) considered dangerous. (a)
he fourth attribute refers to the perception of the auditors regarding red lags as to operational activities (low of internal processes) and internal
control. his attribute is made up of 11 questions adapted from studies referenced below, as shown in Table 4.
Table 4
Research instrument to assess the perception of internal auditors regarding the relevance of red lagsas to the characteristics of operational activities and internal control procedures
No Attributes Authors
38 In the audited branches, there is a signiicant number of transactions with customers who raise suspicions. (e)
39 In the audited branches, there are inadequate, incomplete iles, excessive adjustments in accounting and unrecorded transactions. (e)
40 In the audited branches, there are transactions that are too complex, especially at the end of the accounting period. (c) (e)
41 In the audited branches, there is no segregation of duties and there are no basic controls such as double checking and conciliation of automated controls. (a), (d), (f)
42 In the audited branches, rules providing guidance and support in the execution of tasks between branches are not complied. (f)
43 In the branches audited, the system used does not require a third party to make the conirmation of transactions and credit release to customers. (a), (d), (f)
44 In the branches audited, there are no limits of competence according to the nature and value of the resources involved in a credit release, and credit release decisions are dominated by a single individual. (a) (f)
45 he conclusions, recommendations and demonstrations about exams and possible weaknesses in internal controls of branches that are audited are not submitted to the board of directors and do not remain at the
disposal of the Central Bank of Brazil for a period of ive (5) years. (b) (c) 46 In audited branches, there are inadequacies and/or deiciencies in contracts with customers. (b)
47 Loans and rules for the allowance for doubtful accounts are not made based on consistent and veriiable criteria or supported by the credit risk level of the transaction. (b)
48 Audited branches have an inadequate internal control system (operational) and had problems in the past. (e) (c) Source: Adapted (a) “he eicacy of a red lags questionnaire for assessing the possibility of fraud”, de K. V. Pincus, 1989, Accounting, Organizations and Society, 14, 153-163; (b) Resolução BACEN n. 2554, 1998; (c) “Internal auditors’ perceptions of the efectiveness of red lags to detect fraudulent inancial reporting”, de G. D. Moyes et al., 2006, Journal of Accounting, Ethics & Public Policy, 6, 1-28; (d) “Red lagging as an indicator of inancial statement fraud: he perspective of investors and lenders”, C. Koornhof e D. Du Plessis, 2000, Meditari Accountancy Research, 8, 69-93; (e) “Relevância dos red lags na avaliação do risco de fraudes nas demonstrações contábeis: A percepção de auditores independentes brasileiros”, de F. D. R Murcia et al., 2008, Revista Universo Contábil, 4, 25-45; (f ) “Auditoria interna: Percepção de sua importância para resguardar ativos das organizações do ramo inanceiro”, de E. M. S. Negra et al., 2013, Anais do Congresso Integrado de Contabilidade, 1, recuperado de http://www.ujf.br/congreconti/iles/2013/11/A8.pdf
he ifth attribute refers to the perception of internal auditors to possible red lags in the characteristics of the credit union’s internal
Table 5
Research instrument to assess the perception of internal auditors regarding the relevance of red lagsin the characteristics of internal auditing
No Attributes Authors
49 Managers of audited branches present dominant and inluential behavior over internal auditing. (b), (c), (d)
50 here are formal or informal restrictions on internal auditors that limit their access to people, information and documents of audited branches. (b), (c), (d)
51 he head of internal auditing of the branchesis replaced very frequently. (a) (d)
Source: Adapted (a) “Red lagging as an indicator of inancial statement fraud: he perspective of investors and lenders”, C. Koornhof e D. Du Plessis, 2000, Meditari Accountancy Research, 8, 69-93; (b) “Internal auditors’ perceptions of the efectiveness of red lags to detect fraudulent inancial reporting”, de de G. D. Moyes et al., 2006, , Journal of Accounting, Ethics & Public Policy, 6, 1-28; (c) “he diferences in perceived level of fraud-detecting efectiveness of SAS No. 99 red lags between external and internal auditors”, de G. D. Moyes, 2007, Journal of Business & Economics Research, 5, 9-25; (d) “Relevância dos red lags na avaliação do risco de fraudes nas demonstrações contábeis: A percepção de auditores independentes brasileiros”, de F. D. R Murcia et al., 2008, Revista Universo Contábil, 4, 25-45.
he adjustment procedure of the questions required researchers’ skills and expertise in identifying red lags which were adaptable to the perception of internal auditors, and ability to check the internal warning signs in credit unions. Although the research instrument had been adapted from several studies, it is innovative because all questions were modiied, adapted and revised by researchers and professionals from the ield.
The survey instrument was sent by email to two researchers and two professionals working in internal auditing of credit unions. In this case, both of them had to observe the adequacy of the research instrument’s questions to the professional reality of credit unions’ internal auditors. he answers were returned via electronic iles, contemplating suggestions referring to greater emphasis on the inclusion of the term “branches” in the attributes of red lags, as well as the segregation of attributes in sectoral characteristics, as follows: structure and environment; managers and employees; economic and inancial; operational activities and internal control procedures; and internal auditing.
Given the above, there was also the need to validate the research instrument; this was carried out by two internal auditors who have
worked in credit unions for over 5 years. he most important suggestion was the inclusion of the following sentence, to appear above each group of questions: consider that the questions are assertions of possible occurrences and do not mean that they are actually happening in your organization; therefore, respondents should only infer their perception of the importance given to each red lag, if they were to occur. he inference sought to clarify the respondents that the airmatives (red lags) are only possibilities of fraud, and that, even without any occurrences, relevance could be attributed according only to their perception if such a fact occurs.
To collect the data, we first checked information about the credit unions in the Southern Region on the sites of OCEPAR, OCESC and OCERGS. hen there was telephone contact with those responsible for audit teams in order to get the email of internal auditors. Later, the access link to the questionnaire was sent via Google Docs to the email of auditors:<https://docs.google. com/forms/d/1UiGdRFqpgOh1ejH1gYtGmkw_ gzJPYlHx0iWnCcnHTOA/viewform>.
test result suggested the deletion of attribute number 1 (the organizational structure of the branch is too complex) referring to the group’s structure and environment, of attribute number 14 (a signiicant part of the remuneration of managers and employees of audited branches is conditioned to achieving aggressive goals), and of attribute number 15 (the managers of audited branches are excessively interested in presenting satisfactory results), both referring to the group of managers and employees’ characteristics. Finally, there was the exclusion of the attribute number 32 (the market in which credit unions operate is highly competitive and saturated, generating a reduction in the results of the credit unions), referring to economic and inancial characteristics.
Later there was an analysis of attributes (red lags) validated by Cronbach’s alpha test
using descriptive statistics. Furthermore, in order to identify whether there were diferences between the proile responses (characteristics) of respondents, two additional tests were conducted: Mann-Whitney’s and Kruskal-Wallis’ tests. Finally, we used the Pearson Correlation test to check the strength of the relevant relationship between the groups of the studied attributes. Cronbach’s Alpha, Mann-Whitney’s, Kruskal-Wallis’ and Pearson Correlation tests were applied using SPSS software.
6
Discussion and analysis of results
First, in order to verify the profile (characteristics) of the internal auditors from the participating credit unions in this research, we established Table 6.
Table 6
Characterization of respondents
Characterization of respondents Number Frequency %
Gender Male 36 70.59
Female 15 29.41
Age
Up to 25 years old 9 17.65
From 26 to 30 years old 20 39.22
30 to 40 16 31.37
Over 40 years old 6 11.76
Academic background
Accounting 39 76.47
Management 8 15.69
Economy 4 7.84
Experience as internal auditor
Up to 1 year 9 17.65
From 1 to 5 years 29 56.86
5 to 10 years 6 11.76
Over 10 years 7 13.73
As an internal auditor, has experienced a case of fraud
Yes 40 78,43
No 11 21.57
We can see in Table 6 that 36 auditors are male and 15, female. Regarding age, there is a predominance of internal auditors between 26 and 30 years old, accounting for 39.22%, and between 30 and 40 years old, representing 31.37% of the sample. he academic background in accounting is prevalent for internal auditing
professionals from credit unions, representing 76.47% of the sample.
despite the limited experience of most internal auditors, 78.43% have experienced fraud in the course of their professional life, demonstrating the validity for the study implementation on warning
signs for the occurrence of fraud with internal auditors. Table 7 shows the Cronbach’s alpha of the research groups of attributes.
Table 7
Cronbach’s alphaattribute groups forred lags
SE Manemp Ecoin Opecont Intaud
cronbach’s alpha Round 1 .901 .900 .764 .953 .824
No variables Round 1 13 16 8 11 3
Cronbach’s alpha last Round , 916 , 910 823 , 953 , 824
No last round variables 12 14 7 11 3
Note. SE: Structure and Environment; MANEMP: Managers and Employees; ECOFIN: Economic and Financial; OPECONT: Operating Activities and Internal Control Procedures; INTAUD Internal auditing.
We can see in Table 7 that, in the SE attributes groups (Structure and Environment), MANEMP (managers and employees) and ECOFIN (Economic and Financial), it was possible to improve test reliability by excluding attributes of each group. In the SE group, in the irst round using 13 attributes, Cronbach’s alpha showed a coeicient of 0.901. However, it was found that with the exclusion of attribute number 1 (the organizational structure of the branch is too complex) it is possible to achieve a Cronbach’s alpha of 0.916.
In the MANEMP group, first round using 16 attributes, Cronbach’s alpha showed a coeicient of 0.900. However, it was found that the exclusion of attribute number 14 (a signiicant part of the remuneration of managers and employees of branches is conditioned to the achievement of aggressive goals) and attribute number 15 (the managers of branches audited have excessive interest in presenting satisfactory results) provides an increase in Cronbach’s alpha to 0.910.
In the ECOFIN group, in the irst round using 8 attributes, Cronbach’s alpha showed a value of 0.764. However, Cronbach’s alpha veriied that the exclusion of attribute number 32 (the market in which credit unions operate is highly competitive and saturated, generating reduction in earnings of cooperatives) provides a Cronbach’s alpha of 0.823.
Table 8
Descriptive statistics of the attributes of the structure and environment characteristics group
Questions (red lags) of attribute structure and environment
2 3 4 5 6 7 8 9 10 11 12 13
Average 4.10 3.69 3.77 3.16 3.47 3.94 3.28 2.49 2.37 3.67 3.75 3.49
Median 5 4 4 3 4 4 3 2 2 4 4 4
Standard
Deviation 1.19 1.09 1.45 1.38 1.45 1.24 1.04 0.99 0.92 1.26 1.32 1.29
It can be seen in Table 8 that attribute 1 (the organizational structure of the branch is too complex) is not in the analysis of the group structure and environment characteristics by the exclusion determined by Cronbach’s alpha.
Regarding internal auditors’ perception of the relevance of each attribute, item 2 (the credit union does not have a punishment policy for dishonest acts) had an average/median of 4.10/5.00; attribute 7 (the board of directors and/or supervisory board did not adequately monitor operational systems and internal control) showed an average of 3.94. Attribute 4 (there is a strong suspicion that branch managers are in partnerships with people outside the organization) had an average of 3.77, attribute 12 (the Board of Directors or Supervisory Board did not adequately monitor the generation process of accounting reports) averaged 3.75, attribute 3 (communication of ethical and moral values is not
performed by superiors, and/or communication of some ethical and moral values are considered inappropriate) had an average of 3.69 and attribute 11 (branches do not adequately comply with regulations, instructions and policies set by the cooperative management bodies) had an average of 3.67. he exposed attributes are highly relevant for the internal auditors of credit unions as signaling mechanisms (red lags) for the possibility of fraud referring to characteristics of the structure and environment in credit unions.
he attributes perceived as less important were 10 (a credit union provides lower beneits to employees) with average/median of 2.37/2.00 and 9 (a credit union provides low investment in employee training) with average/median of 2.49/2.00. Table 9 shows the descriptive statistics of the group characteristics of managers and employees.
Table 9
Descriptive statistics of the attributes of the group characteristics of managers and employees
Questions (red lags) of manager and employees attributes
16 17 18 19 20 21 22 23 24 25 26 27 28 29
Average 3.76 3.47 3.04 3.27 3.86 3.29 3.41 3.39 2.88 3.27 3.53 3.20 3,51 3.08
Median 5 4 3 3 4 3 3.5 4 3 3 4 3 4 3
Standard
Deviation 1.59 1.64 1.06 1.11 1.00 1.15 1.10 1.27 1.03 1.55 1.50 1.34 1.27 1.16
As for the perception of internal auditors about the relevance of each attribute, item 20 (managers of the branches audited often try to justify the use of operational procedures considered improper) had a mean/median of 3.86/4,00, and
(red lags) for the possibility of any fraud referring to the characteristics of credit unions’ managers and employees.
he attributes perceived as less important were 24 (managers of the branches that are audited show gratitude above normal proving highly unselish interests, solicitous, eicient and thorough in accountability of branches) with an average/median of 2.88/3.00, 18 (managers and
employees of branches that are audited have low skills and little experience) with average/median of 3.04/3.00 and 29 (the board of directors and the supervisory board have excessive interest in maintain and/or increase the disclosure of a growing trend of inancial surplus) with average/ median of 3.08/3.00, respectively. Table 10 shows the descriptive statistics of the attributes of the group of economic-inancial characteristics.
Table 10
Descriptive statistics of the attributes of the group of economic-inancial characteristics
Questions (red lags) of the economic and inancial attribute
30 31 33 34 35 36 37
Average 3.06 2.94 3.08 3.16 3.10 2.94 3.67
Median 3 3 3 3 3 3 4
Standard
Deviation 1.22 0.97 1.18 1.03 1.14 1.24 1.14
It appears in Table 10 that attribute 37 (there are branches audited making transactions/ operations considered to be dangerous) had the highest perception of relevance, with an average/ median of 3.67/4.00 respectively. On the other hand, attributes perceived as less important for signaling the possibility of any fraud were 31 (branches make a signiicant investment in a range
of services that are subject to high interference from government regulation) and 36 (there are internal and external issues in branches audited that cause doubts about the continuity of activities), and the mean/median of 2.94/3.00. Table 11 shows the descriptive statistics of the attributes of the group of characteristics of the operations and internal controls.
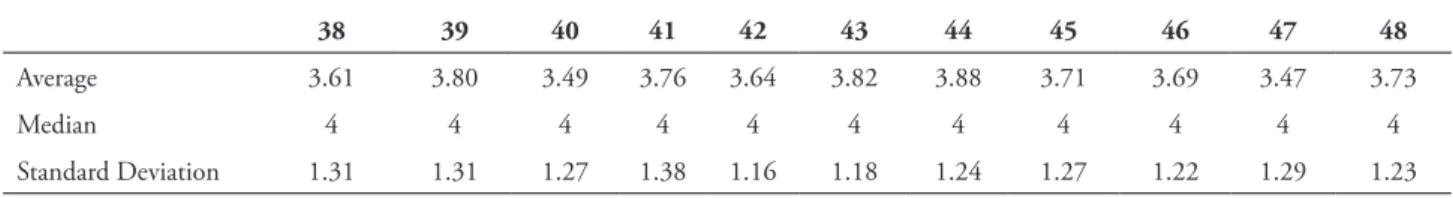
Table 11
Descriptive statistics of the attributes of the group characteristics of the operational activities and internal control procedures
Questions (red lags) attribute from operating activities and internal control procedures
38 39 40 41 42 43 44 45 46 47 48
Average 3.61 3.80 3.49 3.76 3.64 3.82 3.88 3.71 3.69 3.47 3.73
Median 4 4 4 4 4 4 4 4 4 4 4
Standard Deviation 1.31 1.31 1.27 1.38 1.16 1.18 1.24 1.27 1.22 1.29 1.23
We can see in Table 11 that, although the median of all the attributes was 4.00, it is possible to infer that, considering the average, attribute 44 (in the branches audited, there are no limits of competence according to the nature and value
and credit releases to customers) and attribute 39 (in the branches audited, there are inadequate and incomplete iles, excessive adjustments in accounting and transactions not recorded) had
the best averages for the perception of warning signs. Table 12 shows the descriptive statistics of the attributes of the internal auditing group characteristics.
Table 12
Descriptive statistics of the attributes of the internal auditing group features
Questions (red lags) of the internal auditing attribute
49 50 51
Average 3.53 3.69 2.98
Median 4 4 3
Standard Deviation 1.50 1.29 1.46
It appears in Table 12 that the attributes with greater relevance were 50 (there are formal or informal restrictions on the internal auditors that limit their access to people, information and documents of the branches audited) that showed an average/median 3.69/4.00 and 49 (managers of the branches audited have a dominant and inluent behavior on the internal
auditing) that showed an average/median of 3.53/4.00. On the other hand, the attribute that showed less relevance to this characteristic was 51 (the head of internal auditing of the branches audited is replaced with high frequency) with a mean/median of 2.98/3.00. Table 13 shows the descriptive statistics of perceived relevance of red lag groups.
Table 13
Descriptive statistics of perceived relevance of red laggroups
Red lag groups Average Standard
Deviation Attribute group on the characteristics of structure and environment (SE) 3.43 0.82 Attribute group on the characteristics of managers and employees (MANEMP) 3.35 0.81 Attribute group on the economic and inancial characteristics (ECOFIN) 3.13 0.86 Attribute group on the characteristics of the operational activities and internal control procedures
(OPECONT) 3.69 1.04
Attribute group on the characteristics of the internal auditing (INTAUD) 3.40 1.22
From the results shown in Table 13 it can be inferred that the attribute group with higher perceived relevance by the internal auditors of credit unions was referring to characteristics of the operational activities and internal control procedures (OPECONT). The increased perception of relevance to the possibility of fraud in aspects referring to operational activities and internal control procedures can be explained by the role of internal auditors. According to
Migliavacca (2004), CFC NBC (2008), and Santos and Vier (2014), internal auditing is essential for organizations for the constant concern with controls and internal processes. In addition, in the credit unions the action of internal auditing is perceived by the efectiveness of internal control, providing reliability and safety to the cooperative (Oliveira, 2012).
relevance referred to economic and financial characteristics (ECOFIN), averaging 3.13.his result is due to the internal auditing activity focus being less guided to marketing and inancial facts. However, as noticed by Santos and Vier (2014), the internal auditing is changing its look, which was only on internal controls, to observing the institutional risks.
Furthermore, in order to identify whether there are statistical diferences between the proile responses of internal auditors out two tests were
carried out (Mann-Whitney; Kruska-Wallis). Mann-Whitney’s test was used to check the independent variables with two samples. hus, gender characterization was segregated into (male - 1, female - 2); and the characterization demonstrating whether the auditor experienced a case of fraud while working was segregated in (yes - 1, no - 2). Table 14 shows the results of the Mann-Whitney’s test for the gender variable and the variable that shows whether the auditor has experienced a case of fraud while working.
Table 14
ResultsofMann-Whitney’s test on red laggroups with the characterizations of respondents with two independent samples
Group Description Gender Experience with case of fraud
SE Characteristics of structure and environment 0.772 0.024 *
MANEMP Characteristics of managers and employees 0.136 0.005 *
ECOFIN Economic and inancial characteristics 0.065 0.008 *
OPECONT Characteristics of operational activities and internal control procedures 0.357 0.043 *
INTAUD Characteristics of the internal auditing 0.329 0.110
Note. * Signiicance level of 5%
he results in Table 14 show that internal auditors of both genders do not have diferent perceptions about the signiicance of red lags, corroborating the evidence by Schwartz and Wallin (2002) and Smith et al. (2005), and contradicting the inference by Foster et al. (2003) on the diferent perception of the warning signs for male and female auditors.
We can see that the variable experience with a case of fraud presented signiicance at a level of 5% with the group of red lags referring to structure and environment (SE), managers and employees (MANEMP), economic and inancial (ECOFIN) operating activities and internal
control procedures (OPECONT), and showed no signiicance with internal auditing (INTAUD).
Table 15
Mann-Whitney’s test result of the variable experience with a case of fraud in the red lag
groupsSE, MANEMP, ECOFIN and OPECONT
Have you experienced a case of fraud while working?
Average Rank
SE
Average Rank
MANEMP
Rank Average ECOFIN
Average Rank
OPECONT
Yes 28.46 29.06 28.90 28.21
No 17.05 14.86 15.45 17,95
he results in Table 15 show that internal auditors who have experienced a case of fraud in the course of their profession were those who had a higher perception of the relevance of all groups of red lags showing diferences in perception by professionals. hus, the experience with a case of fraud can provide a perception of diferent relevance for fraud for the profession and performance of the internal auditor. he results corroborate the inference by Groveman (1995), Green and Calderon (1996) and Hackenbrack (1993) on the inluence of factors generating experience in detecting warning signs to the possibility of fraud.
Subsequently, Kruskal-Wallis’ test was used to assess the independent variables with more than two cases. hus, the characterization of segregated age in 4 cases is: (up to 25 years - 1, from 26 to 30 - 2, from 31 to 40 years - 3; above 41 years), the characterization of the academic background in 3 cases is: (Accounting - 1; Business Administration - 2; Economics - 3), the and characterization of time experience in the position of internal auditor divided in 4 cases is (up to 1 year - 1; 1.01 to 5 years - in 2, of 5.01 to 10 years - in 3; Over 10 years - 4). Table 16 shows the result of the Kruskal-Wallis test of the variables age, academic background and experience in the position of internal auditor.
Table 16
Kruskal-Wallis test resultofred lagsgroupswith the characterizations of respondents with more than two independent samples
Group Description Age Academic
background
Experience in position
SE Characteristics of structure and environment . 612 . 427 . 045 *
MANEMP Characteristics of managers and employees . 540 . 104 . 349
ECOFIN Economic and inancial characteristics . 597 . 109 . 371
OPECONT Characteristics of operational activities and internal control procedures . 206 . 160 . 532
INTAUD Characteristics of internal auditing . 608 . 546 . 047 *
Note. * Signiicance level of 5%
It appears from Table 16 that the age and academic background variables were not signiicant at 5% in relation to any group of attributes of red lag characteristics. he results indicate that internal auditors of diferent s ages and academic backgrounds do not have diferent perceptions about the signiicance of red lags,
contradicting evidence by Green and Calderon (1996) on the impact of academic background in the perception of auditors in relation to warning signs for fraud.
and environment (SE) and internal auditing (INTAUD). On the other hand, the signiicance was not observed in groups of red lags referring to managers and employees (MANEMP), economic and inancial (ECOFIN), and operational activities
and internal control procedures (OPECONT). Table 17 shows the results of Kruskal-Wallis’ test of the variable experience in the position for red lag groups SE and INTAUD.
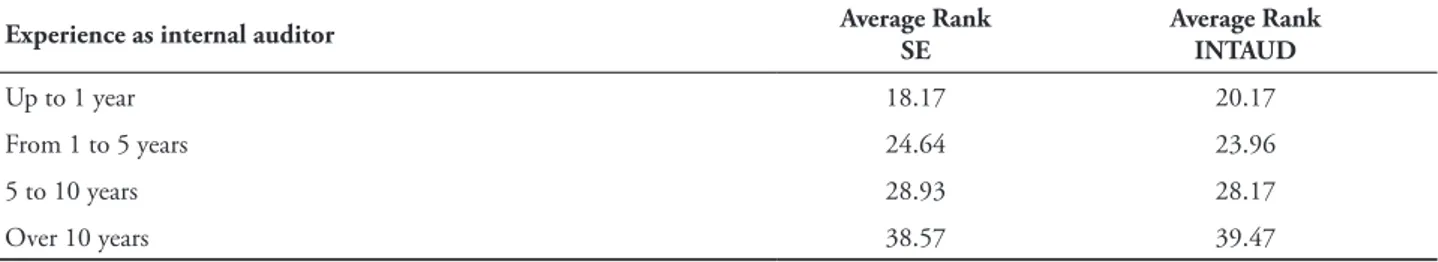
Table 17
Kruskal-Wallis’ test result for variable experience in the position of internal auditor for the red lag groups SE and INTAUD
Experience as internal auditor Average Rank
SE
Average Rank INTAUD
Up to 1 year 18.17 20.17
From 1 to 5 years 24.64 23.96
5 to 10 years 28.93 28.17
Over 10 years 38.57 39.47
he results in Table 17 show that the increase in time of experience as internal auditor increases the perception of relevance of red lags referring to structure and environment (SE) and internal auditing (INTAUD). Thus, we demonstrate that internal auditors with more than 10 years of experience in the position tend to have greater perception of relevance to the possible occurrence of fraud in red lags referring
to SE and INTAUD. his result can be explained due to greater knowledge of the structure and environment in which the auditor operates, and by the knowledge of their own audit activity. he indings are consistent with the study by Hackenbrack (1993), Grovemann (1995), Murcia et al. (2008). Table 18 shows the Pearson Correlation between red lag attribute groups.
Table 18
Pearson Correlation between red lagattribute groups
SE MANEMP ECOFIN OPCONT INTAUD
SE Pearson Correlation 1 . 642 ** . 680 ** . 719 ** . 638 **
MANEMP Pearson Correlation . 642 ** 1 . 803 ** . 838 ** . 740 **
ECOFIN Pearson Correlation . 680 ** . 803 ** 1 . 716 ** . 634 **
OPCONT Pearson Correlation . 719 ** . 838 ** . 716 ** 1 . 810 **
INTAUD Pearson Correlation . 638 ** . 740 ** . 634 ** . 810 ** 1
Note. ** he correlation is signiicant at the 0.01 level (2 ends)
We observed in Table 18 that all red lag groups are referring to each other, at a level of signiicance of 1%. However, it is possible to determine that the groups with a stronger linear association, i.e., closer to 1 are: MANEMP
associated with ECOFIN; MANEMP associated with OPCONT; OPCONT associated with INTAUD.
(MANEMP) increases in similar proportion to the relevance of red lags referring to economic and financial characteristics (ECOFIN). The signiicance of red lags referring to managers and employees (MANEMP) increases in similar proportion to the relevance of red lags referring to characteristics of the operational activities and internal control procedures (OPCONT). Moreover, the signiicance of red lags referring to operating activities and internal control procedures (OPCONT) increases in similar proportion to the relevance of red lags referring to characteristics of internal auditing (INTAUD).
7
Conclusions and recommendations
he aim of this study was to verify the relevance credit unions’ internal auditors attribute to red lags in assessing the risk of fraud. he results indicate that internal auditors of both genders do not have diferent perceptions concerning the signiicance of red lags. On the other hand, credit unions’ internal auditors who have experienced a case of fraud have greater perception of the relevance of red lags referring to structure and environment, managers and employees, economic and inancial, operational activities and internal control procedures.
Moreover, it is possible to infer that internal auditors of diferent ages and academic backgrounds do not have diferent perceptions about the signiicance of red lags. However, auditors with experience in the position have greater perception of the relevance of red flags referring to structure and environment and internal auditing. We conclude that, in the assessment of fraud risk, internal auditors attribute greater importance to red lags referring to operating activities and internal control procedures. Therefore, internal auditors are focused on fraud associated with signals generated by changes in the normal flow of internal processes, and in monitoring failure by internal control mechanisms.
Furthermore, it is suggested that internal auditors are not impartial concerning the
perception of relevance to most of the warning signs of possible fraud. he indings support acknowledging that internal auditors, through their emotional and professional relationship with the organization in which they operate as well as with their members, are impartial in their perceptions about the warning signs of fraud. Moreover, internal auditors have higher perceptions of red lags referring to their training and professional practice, and, therefore, so that organizations can eiciently use warning signs to reduce fraud, there must be a joint efort by internal and independent auditors, since both integrate their knowledge and insights to alert managers of organizations and users of accounting information as to the possibility of fraud.
The results show that auditors attach importance to red lags; however, none of the observed groups showed a relevance level above 4 on a 5 point scale. his result may corroborate the evidence by Wells (1990) about the failure of auditors in fraud detection, where only 20% of fraud is detected by the auditors. hus, for greater fraud detection it is necessary that auditors recognize the most relevant symptoms of red lags linked to favorable conditions for the occurrence of fraud (Cottrell & Albrecht, 1994).
This study suggests that there is an increase in the relevance of auditing for warning signs, since the function of the auditor is directly referring to the mechanisms of prevention and fraud detection (CFC NBC, 2008; Santos & Vier, 2014). According to the findings, it is necessary that scholars, researchers and auditing professionals explore more intensively the use of red lags as a mandatory tool for the work of internal and independent audit.
involving inancial aspects of high risk, need special attention on the subject, and therefore, internal auditors may use the indings to glimpse the search for additional powers to exercise their duties.
Finally, it is recommended to carry out further studies in order to observe the relationship of perceived relevance of red lags in organizations that experienced fraud. hus, it will be possible to see if the organizations where auditors have a lower perception of warning signs could sufer with higher occurrence of internal fraud and inancial statements. Also, there are possibilities of application of the studies in inancial institutions to compare the perception of internal and independent auditors about warning signs addressed in several national and international studies.
References
Albrecht, S. (2003); Fraud Examination. Editora hompson.
Albrecht, S., & Romney, M. (1986). Red-lagging management fraud: a validation. Advances in Accounting, 3, 323-333.
Banco Central do Brasil – Bacen. (2014). Resolução 2554, de 24 de setembro de 1998. Disponível em: <http://www.bcb.gov.br/pre/ normativos/busca/normativo>. Access on April 24, 2014.
Bell, T., & Carcarello, J. (2000). A decision aid for accessing the likehood of fraudulent inancial reporting. Auditing: A Journal of Practice & heory, 19(1), 169-184.
Boynton, W. C., Johnson, R. N., & Kell, W. G. (2002). Auditoria. São Paulo, Atlas.
Brasil. Conselho Monetário Nacional. Resolução n° 2.554, de 24 de setembro de 1998. Disponível em: <https:// www3.bcb.gov.br/normativo/detalharNormativo>. Access on: Mar 23, 2014.
Cottrell, D. M., & Albrecht, W. S. (1994). Recognizing the symptoms of employee fraud.
Healthcare financial management: journal of the Healthcare Financial Management Association, 48(5), 18-22.
Cushing, B. E., & Romney, M. B. (1994).
Accounting Information Systems. Reading Massachusetts, Addison-Wesley.
Eining, M. M., Jones, D. R., & Loebbecke, J. K. (1997). Reliance on decision aids: An examination of auditors’ assessment of management fraud. Auditing: A Journal of Practice & heory, 16(2).
Foster, B. P., Karcher, J. N., & Levitan, A. S. (2003). Gender and accountants’ use of technology. he CPA Journal, 3(2), 68.
Glover, H. D., & Aono, J. Y. (1995). Changing the model for prevention and detection of fraud. Managerial Auditing Journal, 10(5), 3-9.
Green, B. P., & Calderon, T. G. (1996). Information privity and the internal auditor’s assessment of fraud risk factors. Internal Auditing-Boston-Warren Gorham and Lamont Incorporated, 11, 4-15.
Groveman, H. (1995). How auditors can detect inancial statement misstatement. Journal of Accountancy,180(4), 83-90.
Hackenbrack, K. (1993). he efect of experience with different sized clients on auditor evaluations of fraudulent inancial reporting indicators. Auditing: A Journal of Practice & heory, 12(1), 99-110.
HSN Consult. Relatório HSN Consult sobre fraudes no Brasil. Brasil. (1999). Disponível em <http://hsn.com.br/serviços/fraude. htm>. Access on: March 8, 2014.
fraudulent inancial reporting. Managerial Auditing Journal, 10(5), 27-36.
Kneer, D. C., Reckers, P. M., & Jennings, M. M. (1996). An empirical examination of the inluence of the new US audit report and fraud red lags on perceptions of auditor culpability. Managerial Auditing Journal, 11(6), 18-30.
Koornhof, C., & Du Plessis, D. (2000). Red lagging as an indicator of inancial statement fraud: The perspective of investors and lenders. Meditari Accountancy Research, 8(1),
69-93.
KPMG - Forensic Services. (2009). A Fraude no Brasil: Relatório da pesquisa 2009.
Disponível em <http://www.kpmg.com.br/ publicacoes/forensic/Fraudes_2009>. Access on: Feb. 6, 2015.
Krambia-Kapardis, M. (2003). Fraud victimisation of companies: the Cyprus experience. Journal of Financial Crime, 10(2), 184-191.
Kroll – Prevence, Respond to & Remediate Global Risck. (2013). Global Fraud Report 2013/2014. Disponível em: <http://fraud. kroll.com/key-insights/incidence-costs-fraud-rose- markedly-past-year-turn-driving-companies-sense-vulnerability/>. Access on Feb. 11, 2015.
Migliavacca, P. N. (2004). Controles internos nas organizações: um estudo abrangente dos
princípios de controle interno: ferramentas para avaliação dos controles internos em sua organização. São Paulo, Edicta.
Moyes, G.D. (2007). he diferences in perceived level of fraud-detecting effectiveness of SAS No. 99 red lags between external and internal auditors. Journal of Business & Economics Research, 5(6), 9-25.
Moyes, G. D. (2011). he diferences in perceived level of fraud-detecting effectiveness of SAS No. 99 red lags between external and internal auditors. Journal of Business & Economics Research, 5(6).
Moyes, G. D., Young, R., & Mohamed D. H. F. (2013). Malaysian internal and external auditor perceptions of the efectiveness of red lags for detecting fraud. International Journal of Auditing Technology, 1(1), 91-106.
Moyes, G. D., Lin, P., Landry, R. M., & Vicdan, H. (2006). Internal Auditors’ Perceptions of the Efectiveness of Red Flags to Detect Fraudulent Financial Reporting. Available at SSRN 961457.
Murcia, F. D. R., Borba, J. A., & Schiehll, E. (2008). Relevância dos red lags na avaliação do risco de fraudes nas demonstrações contábeis: a percepção de auditores independentes brasileiros. Revista Universo Contábil, 4(1), 25-45.
Negra, E. M. S., Viana, T. M. M., & Negra, C. A. S. (2013). Auditoria interna: percepção de sua importância para resguardar ativos das organizações do ramo inanceiro. Anais... In:
1º Congresso Integrado de Contabilidade, Governador Valadares/MG, 24 e 25 de Outubro.
Norma Brasileira de Contabilidade – NBC. (2008). Princípios fundamentais e normas brasileiras de contabilidade. Conselho Federal de Contabilidade, 3 ed. Brasília, CFC.
Oliveira, R. L. (2012). Gestão de Fraudes Financeiras Externas em Bancos. 127 fls. Dissertação
(Mestrado em Administração) – Faculdade de Economia, Administração e Contabilidade de Ribeirão Preto, Universidade de São Paulo, Ribeirão Preto.
Parodi, L. (2005). Manual das fraudes. Rio de Janeiro, Brasport.
Pickett, K. S. (2005). he essential handbook of internal auditing. Chichester, Wiley.
Pinheiro, G. J., & Cunha, L. R. S. (2003). A importância da auditoria na detecção de fraudes. Contabilidade Vista & Revista, 14(1),
31-48.
Reina, D., Nascimento, S. D., & Reina, D. R. M. (2008). A Percepção dos Auditores quanto à Utilização dos Red Flags nas principais empresas de Auditoria Brasileiras. Revista Enfoque Contábil, 27(2), 71-86.
Rittenberg, L. E., & Schwieger, B. J. (2005).
Auditing: Concepts for a changing environment,
homson/South-Western.
Robertson, J. C. (1997). Fraud examination for managers and auditors, Austin, Viesca.
Romney, M. B., Albrecht, W. S., & Cherrington, D. J. (1980). Auditors and the Detection of Fraud. Journal of Accountancy, 149(5), 63-69.
Santos, M. V. D., & Vier, A. J. (2014). A importância da auditoria interna na contribuição da gestão dos negócios. Revista Eletrônica do Curso de Ciências Contábeis, (4).
Schwartz, S. T., & Wallin, D. E. (2002). Behavioral implications of information systems on disclosure fraud. Behavioral Research in Accounting, 14(1), 197-221.
Smith, M., Omar, H., N., Idris, S. I. Z. S., & Baharuddin, I. (2005). Auditors’ perception of fraud risk indicators: Malaysian evidence. Managerial Auditing Journal, 20(1), 73-85.
Uretsky, M. (1980). An Interdisciplinary Approach to the Study of Management Fraud. in Elliott, R. K., & Wulingham, J. J. (eds). Management Fraud: Detection and Deterrence, Princeton, NJ: Petroce Ui Books.
Wells, A. (1990). Panic disorder in association with relaxation induced anxiety: An attentional training approach to treatment. Behavior herapy, 21(3), 273-280.
Wells, D. L. (2005). A note on the inluence of visitors on the behaviour and welfare of zoo-housed gorillas. Applied Animal Behaviour Science, 93(1), 13-17.
About the authors:
1. Cristian Baú Dal Magro, Master in Accounting Sciences, Regional University of Blumenau – FURB, Santa Catarina, Brazil. E-mail: [email protected].
2. Paulo Roberto da Cunha, Doctor in Accounting Sciences and Management, Regional University of Blumenau – FURB, Santa Catarina, Brazil. E-mail:[email protected].
Contribution of each author:
Contribution Cristian Baú Dal Magro Paulo Roberto da Cunha
1. Deinition of research problem √ √
2. Development of hypotheses or research questions
(empirical studies) √ √
3. Development of theoretical propositions (theoretical Work) √ √
4. heoretical foundation/Literature review √ √
5. Deinition of methodological procedures √
6. Data collection √
7. Statistical analysis √
8. Analysis and interpretation of data √
9. Critical revision of the manuscript √ √