http://dx.doi.org/10.1590/0104-530X810-13
Resumo: A qualidade na educação tem sido objeto de muita discussão, seja nas escolas e entre seus gestores, seja na mídia ou na literatura. No entanto, uma análise mais profunda na literatura parece não indicar técnicas que explorem bancos de dados com a inalidade de obter classiicações para o desempenho escolar, nem tampouco há um consenso sobre o que seja “qualidade educacional”. Diante deste contexto, neste artigo, é proposta uma metodologia que se enquadra no processo KDD (Knowledge Discovery in Databases, ou seja, Descoberta de Conhecimento em Bases de Dados) para a classiicação do desempenho de instituições de ensino, de forma comparativa, com base nas notas obtidas na Prova Brasil, um dos itens integrantes do Índice de Desenvolvimento da Educação Básica (IDEB) no Brasil. Para ilustrar a metodologia, esta foi aplicada às escolas públicas municipais de Araucária, PR, região metropolitana de Curitiba, PR, num total de 17, que, por ocasião da pesquisa, ofertavam Ensino Fundamental, considerando as notas obtidas pela totalidade dos alunos dos anos iniciais (1º. ao 5º. ano do ensino fundamental) e dos anos inais (6º. ao 9º. ano do ensino fundamental). Na etapa de Data Mining, principal etapa do processo KDD, foram utilizadas três técnicas de forma comparativa para o Reconhecimento de Padrões: Redes Neurais Artiiciais; Support Vector Machines; e Algoritmos Genéticos. Essas técnicas apresentaram resultados satisfatórios na classiicação das escolas, representados por meio de uma “Etiqueta de Classiicação do Desempenho”. Por meio desta etiqueta, os gestores educacionais poderão ter melhor base para deinir as medidas a serem adotadas junto a cada escola, podendo deinir mais claramente as metas a serem cumpridas.
Palavras-chave: Desempenho escolar; Processo KDD; Reconhecimento de padrões; Estudo de um caso real. Abstract: Quality in Education is an issue that has been discussed in schools and among their managers, in the media, and in the literature. However, a deeper review of the literature has failed to present techniques dealing with database information techniques capable of obtaining classiications for school performance; nor is there a consensus regarding the deinition of “educational quality”. To address the situation, in this paper, we propose a methodology that its the KDD (Knowledge Discovery in Databases) process to classify teaching in schools. This is done by comparing the grades of the “Prova Brasil”, which is part of the Development Index of Basic Education (IDEB) in Brazil. To illustrate the methodology, it was applied to 17 public elementary schools in the municipality of Araucária, located in the metropolitan region of Curitiba, Parana state. The grades achieved by all students of the initial years (1st to 5th year of fundamental teaching) and inal years (6th to 9th years of fundamental teaching) were considered. In the Data Mining phase, the main phase of the KDD process, three techniques were used comparatively: Artiicial Neural Networks, Support Vector Machines, and Genetic Algorithms. Those techniques presented acceptable results in classifying each school represented by a “Performance Classiication Label”. Based on this label, the educational managers can have a greater input for procedures to be adopted in each school, and thus set more accurate targets. Keywords: School performance; KDD process; Pattern recognition; Real case study.
Proposed methodology for the creation of a
classification label: a school performance case study
Proposta de metodologia para a criação de etiqueta de classificação – estudo de caso: desempenho escolar
Anderson Roges Teixeira Góes1
Maria Teresinha Arns Steiner2
1 Programa de Pós-graduação em Métodos Numéricos em Engenharia – PPGMNE, Departamento de Expressão Gráica, Universidade
Federal do Paraná – UFPR, CP 19081, CEP 81531-990, Curitiba, PR, Brasil, e-mail: [email protected]
2 Programa de Pós-graduação em Engenharia de Produção e Sistemas – PPGEPS, Pontifícia Universidade Católica do Paraná – PUCPR, CP 19081, CEP 81531-990, Curitiba, PR, Brasil, e-mail: [email protected]
1 Introduction
Nowadays, companies from a wide range of sectors such as production, telecommunications, educational institutions, hospital, have historical information stored
in databases. This is natural, because computer media
are practical and made for this purpose. However, the
task of simply storing data is not suficient. It is also
necessary to verify whether the collected data include relevant information or if there is some knowledge to be discovered.
In the educational ield, more speciically, there are assessment instruments of the Federal Government that are generally used to set an index, but can also
be used to generate other information for the states, municipalities and the entire school community.
One of these educational databases was used in the present study: the Basic Education Development Index (Índice de Desenvolvimento da Educação Básica (IDEB)). It was used to illustrate a proposed methodology for the creation of the Classiication Label.
This proposed methodology emerged to answer address issues such as: How to use real data in the creation of a classiication label for different “elements” (in this study, schools); how to obtain a parameter that can be considered “average quality” with these data; and, especially, how to classify an element in the label that does not directly it any of the classiication levels. Furthermore, the case study used here shows that this type of classiication label
can be highly versatile and be applied to a wide range
of ields such as electricity (Van Casteren et al., 2005). The method presents an easily visualized label. In the context, the Knowledge Discovery in Databases (KDD) process was used, providing comparison
patterns.
This label is obtained “by comparison” because
it indicates in a group/region the performance of
schools on a scale of six levels (A, B, C, D, E and F), where the schools with an “A” rating are the best performers and those with an “F” are the poorest.
To classify these schools, three Operational Research methods were used that are highlighted in the ield of educational research: Artiicial Neural Networks (ANNs) (Kardan et al., 2013; Yeh & Lo, 2005), Support Vector Machines (SVM) (Huang & Fang, 2013; Wang et al., 2008) and Genetic Algorithms (GA) (Moreno et al., 2012; Meng et al., 2007), comparatively.
This article is organized into ive sections, including this introduction. In Section 2, a review of the literature
is conducted regarding the general concept of quality,
focusing on works in the educational ield. Section 3 looks at the concept of educational quality from the viewpoint of Brazilian legislation. The proposed
methodology and its illustrative application are
presented in Section 4. The inal considerations are
given in Section 5.
2 Review of the literature: from the
general concept of “quality” to
works in the educational ield
According to Paladini (1995), in prehistoric times,
man already sought quality, although its meaning was not clear. Since then, it has been perceived in
different ields of knowledge. It can be deined in
many ways, depending on where its use is employed, as each concept has several levels of abstraction.
Beginning with the etymology of the word “quality”, it stems from the Latin, meaning “of what nature”. In Portuguese, it means “something distinguishable from similar things” (Ferreira, 2001, p. 571).
Due to these several meanings, ive approaches are proposed by Garvin (1992), encompassing all the as meanings of quality: transcendental; product-based; production-based; user-based; and value-based. In the transcendental approach, quality is considered innate,
i.e., it cannot be precisely deined or measured; it is something that exists or does not exist and is recognized through experience. A point in question is the Rolex watch brand. People only need to hear the name to “know” that these watches are high quality products.
In the product-based approach, quality is measured by the number of characteristics of the product, i.e., the more attributes it has, the higher its quality will
be. An example of this is the choice of a new car. Two cars can be compared and a possible differential would be one having air-conditioning while the other
does not. Consequently, this item is seen as giving the car more quality.
In the production-based approach, quality is attributed to the characteristics of the product that are
in “conformance with requirements”, i.e., error free. A point in question is the production of embroidered T-shirts with a company brand. Put simply, one can ask: “Are all the logos in the right place?” The more T-shirts that are manufactured correctly, the higher the production-based quality will be.
In the user-based approach, quality is gauged by whether the product or service is equal to the user’s
expectations. This approach is subjective because user assessment in relation to speciications is how the standard of quality is evaluated. An example of this would be asking: “Is teaching in schools satisfying the needs of students and society?”
Finally, in the value-based approach, quality is
understood as the relationship between cost and beneit,
i.e., the price that the user/consumer is willing to pay
for a product or service. An example of this could be in planning a trip. When considering a location,
the user can choose to stay in a hotel with more or
The deinitions of Garvin (1992) show that there is no single “truth” regarding quality and that one or more of the author’s approaches can co-exist in the same scenario. In any case, the author manages to cover all the deinitions.
Regarding quality in education, this has been discussed
for decades in many countries. Summaries of some of these works are shown below in chronological order.
Research on the quality of education in Indonesia was conducted by Elley (1976). One of the greatest
contributions was that the researcher found that children in rural districts learned less than those in urban areas, although no reasons were given for this
difference. Furthermore, the author analyzed the
working conditions of teachers in order to propose some norms for each region of the country and the country as a whole.
In their pilot study in the United States, Moss et al. (1978) assessed the quality of teaching of engineering during a conference. They used instruments like questionnaires and interviews on two different occasions: before and after the conference. This study sought to verify the opinion of students regarding external evaluations. To the authors, this offered at least one method for measuring quality control better. They concluded that students are not opposed to external
evaluations as a way of gauging the quality of these courses in comparison with other institutions in the country.
A model for evaluating teaching methods for decision making regarding the eficiency of the quality of these decisions was developed by Benaim (1984), using a school in Venezuela as a case study. The variables used for the model included teaching
and learning resources, the assessment system,
the qualiications and appreciation of teachers and tutoring. The authors found that in the method that
was developed, the absolute values of these variables should not be measured, but rather their results such as students’ grades and reports by the teaching staff.
Dockrell (1988) conducted a historical review of
the assessment systems in Scotland and England,
showing the ields of knowledge that are evaluated in each. The researcher found that having quality indexes and not using them is useless, especially
when teachers are not aware of these results because it is only when teachers are aware of this information that an impact can be made on education.
A study on the quality of education in Israel was conducted by Inbar (1988), analyzing two moments
in the history of the country. First, the author points
out that the factors that had a negative inluence on
the quality of education was the rapid growth of the
education system. In twelve years, between 1948 and 1960, the population of the country trebled. The country did not have the necessary infrastructure for this growth, nor did it have enough qualiied
teachers. Secondly, once these two problems were overcome, the main problem was social inequality.
Carreira & Pinto (2007) pointed out some criteria
to be considered when measuring quality of education
in Brazil, bearing in mind the democratic perspective and social quality. The aspects they identified
included the salaries of teachers and other education professionals, infrastructure and teacher training.
All of these aspects are addressed by the Brazilian National Education Plan.
Many works in the literature are concerned with social position for quality in education (Oliveira & Araujo, 2005; Parpala & Lindblom-Ylanne, 2007); analyses of the quality of educational sites (Graells, 1999; Carvalho, 2006); quality of services provided by public educational institutions (Fowler et al., 2011) and evaluations of assessment methods in education (Steil & Barcia, 2006; Birenbaum, 2007; Tillema et al., 2011).
Some works discuss the criteria that should be considered for preparing indicators of quality in education, but do not present methods regarding
“how to arrive at” these indicators.
However, there are works that address the quality
of services in education, using the ServQUAL statistical method (Figueiredo et al., 2006; Mahapatra & Khan, 2007; Udo et al., 2011; Abari et al., 2011; Ansary et al., 2014). The ServQUAL is a method
that indicates quality through several items in
services. Through quantitative information, it seeks to express a qualitative analysis. For this purpose, two afirmative statements are used, with one referring to expectations and the other to perceived quality of service. The interviewees evaluate each item in the instrument with options varying from “I totally disagree” to “I totally agree”, marking each option on a ive-point or seven-point scale. Statistical elements
such as average and standard deviation are used to
analyze the responses and verify whether the services meet the expectations and perceptions of the customer (Salomi et al., 2005).
Figueiredo et al. (2006) conducted a study to gauge
customer satisfaction regarding quality in language
schools, using questionnaires for the SERVQUAL method. They used a numerical evaluation that
enabled them to gauge the quality of the services on offer by the institution, highlighting their strong
and weak aspects in terms of quality. Among the
factors considered were infrastructure, customer
services, timekeeping, and teacher qualiications. Mahapatra & Khan (2007) developed an instrument for measuring quality in the ield of education (technical teaching institutions) based on the ServQUAL. For this purpose, four Artiicial Neural Network
topologies were used, with backpropagation as the learning algorithm, to predict quality in education
students, parents, recruiters, universities, support
staff, government, society and administrators). The
instrument is validated by factor analysis, followed
by the Varimax method. However, like the other
works that have been described, the author does not
present quality on a hierarchical classiication scale. Udo et al. (2011) used the SERVQUAL method to evaluate quality in distance learning in ive dimensions (assurance, empathy, responsiveness, reliability and website content). With the exception of reliability, these dimensions inluence future intentions to enroll
in these courses and student satisfaction.
An evaluation of the post-graduate course at a private university was the application of the SERVQUAL method used by Abari et al. (2011) to gauge the gap between expected and actual quality. According to
the authors, the study presented difference meanings
for expected and experienced quality. A study at the
same level of teaching and with the same variables
(tangibles, reliability, responsiveness, assurance and empathy) was conducted by Ansary et al. (2014) in Malaysia to gauge whether gender and nationality inluenced the quality of services. The authors found that there was insuficient evidence in terms of gender, but that nationality had a slight inluence
on the responsiveness of the quality of the service.
The present study differs from the others by
presenting, in Section 4, a methodology that uses quantitative information stored in databases to create a school performance label, comparatively, with the
KDD process in its context. In Section 3, below,
some concepts are presented on quality in education,
considering Brazilian legislation.
3 Educational quality and Brazilian
legislation
As presented in Section 2, the concept of quality can have many meanings, depending on the context in which it is employed. According to Carreira & Pinto (2007), in education this concept is related to how education is perceived by the person deining it. It is clear that this concept in this ield has different
meanings, since there are different conceptions of education, many of which differ on a number of points.
The Brazilian Federal Constitution and the Law of Directives and Bases for National Education
ensure that teaching must meet with minimum
quality standards. Furthermore, the latter afirms that non-compliance with this minimum quality is “in violation of” a student’s right to learn, as stated in the Constitution. The Chamber of Basic Education
(Câmara de Educação Básica (CEB)) points out that
the transfer of resources and technical assistance to ensure compliance with this right is the obligation
of the Federal Government (Brasil, 2010).
In the drive to set minimum standards and attributes regarding the quality of education, the CEB, in its 8/2010 report, indicated that the “Student-cost for Initial Quality” (CAQi) is a possible instrument for
clearly presenting the necessary input to guarantee
this standard. Therefore, the CAQi should be viewed as “[...] an established option for making the initial steps towards quality feasible, thus its name [...]” (Brasil, 2010).
The CAQi originated during the National Campaign for the Right to Education and, in 2008, came to be considered by the National Education Council as “[...] a strategy of public policy for Brazilian education to
overcome the inequalities of education in our country
[...]” (Brasil, 2010). This council “[...] understands that the adoption of the CAQi is a decisive step towards
addressing these differences and, therefore, the drive for greater equality of educational opportunities for
all [...]” (Brasil, 2010). In other words, the concept
of quality employed here is directly linked to the perspective of democracy and social quality.
Regarding the CAQi, Carreira & Pinto (2007)
assume that the values presented for each step and modality of teaching establish a minimum standard of quality in education and that this will tend to grow
as demand for quality increases. In other words, it is a dynamic process. Moreover, the values presented
are based on the indispensable attributes for the development of teaching and learning processes,
including: salaries of teachers and other education
professionals, infrastructure and teacher training, as
deined in the National Education Plan.
The CEB highlights some of the factors in the CAQi that are closely related to quality in education, including the size of the educational unit, the number
of students per class, time spent by the student
in the unit every day (partial or whole) and the appreciation of teaching professionals (initial and ongoing training and career and promotion plans). Thus, the results expected in education are closely
linked to the resources available for it, as these are what generate a good working infrastructure, adequate management of teaching and the appreciation of education professionals.
The CEB report inalizes its considerations by
indicting that great challenges lie ahead in terms
of education quality (Brasil, 2010): to make access
to school available to all from kindergarten to high
school; to reduce the difference between schools in terms of infrastructure; to implement career and promotion plans; to address the national minimum
wage for education professionals and working hours
management both in schools and in education systems;
and to provide adequate funding that is compatible with the demands of modern society.
The IDEB, created by the Brazilian federal government in 2007, is calculated taking into account the results of evaluations conducted by the Anísio Teixeira National Institute of Educational Research and Studies (INEP), pass and failure rates and truancy in public and private schools (INEP, 2011). It is hoped that a school with a high IDEB index will mean that
its students are attending class, learning the content of the syllabus and, consequently, not failing.
This index has an indicator for each segment of
basic education, i.e., there is an indicator for the
early years of schooling (1st to 5th year), another for the later years (6th to 9th year) and another for high school. This fragments the analysis of the school and,
consequently, does not evaluate the performance of the institution as a whole when the school is involved in more than one segment of basic education.
Every two years, a new index is published and
everyone can access it through the website of the
Ministry of Education. In this evaluation system, one of the instruments is the Prova Brasil, a test sat only by ifth year and ninth year students at public school with a minimum of 20 students enrolled during these years. As this index takes passing grades and
truancy into account, in addition to the grade of this
speciic examination, schools with high grades in the Prova Brasil can have lower IDEB indexes in
relation to other schools, as this is only one of three requirements.
Therefore, in the present study, only the Prova Brasil grade is considered (one of the IDEB components)
for the creation of the school performance label, as this test is the consequence of several other attributes concerning educational quality indicated by Carreira
& Pinto (2007).
4 Methodology for constructing the
school performance classiication
label
The methodology proposed for the creation of the classiication label (Góes et al., 2014) considers only the school performance of students in the Prova Brasil test, one of the three IDEB requirements.
To illustrate the methodology, schools that offer Basic Education (1st to 9th year) in the same region were analyzed comparatively using the Prova Brasil grades in two subjects: Portuguese (with grades of 0 to 350) and Mathematics (with grades of 0 to 425).
For this purpose, the municipality of Araucária, in the Metropolitan Region of Paraná State was selected. At the time of the study, the municipality had 17 municipal schools that offered basic education (early years, 1st to 5th and inal years, 6th to 9th).
The KDD process was used to support the development of the methodology. This was done in ive stages with a view to extracting non-explicit
information from the databases prior to application.
The stages were data selection, data cleaning or
preprocessing, data transformation, application of data mining techniques and knowledge interpretation
(Fayyad et al., 1996).
The development of the knowledge is presented in parallel with its application at the 17 schools, with data collected directly from the INEP website, as
shown in Chart 1. In this chart, the average grades
for each subject (Portuguese and mathematics) are shown for the early years (1st to 5th) and the inal years (6th to 9th).
An analysis of Chart 1 shows that it is not possible to identify the school that stands out in terms of
grades. For instance, S17 has the best grades for the inal years and S16 has the best for the early years. Likewise, S15 and S12 have the worst grades for the early years, while S8 has the poorest for the inal years.
In the proposed methodology, the schools are classiied comparatively, indicating their performance in the Prova Brasil on a six-level scale (A, B, C, D, E and F). for this purpose, the data were organized into individual charts with four classes of classiication:
C1 – grades in the Portuguese language test for the
early years; C2 – grades in the mathematics test
for the early years; C3 – grades in the Portuguese
language test for the inal years; and C4 – grades in
the mathematics test for the inal years.
Thus: 174.40 ≤C1≤ 201.41; 189.87 ≤ C2≤ 238.69;
219.90 ≤ C3 ≤ 279.54; and 229.18 ≤ C4≤ 284.39.
For example, the data for S1 are presented in Chart 2, where C1= 199.05; C2 = 219.16; C3= 250.40 and C4 = 258.33.
Likewise, the charts were prepared for each of the 17 schools. Chart 3 shows the average value for each
classiication, i.e., for each class Ci the average was calculated in relation to all the schools.
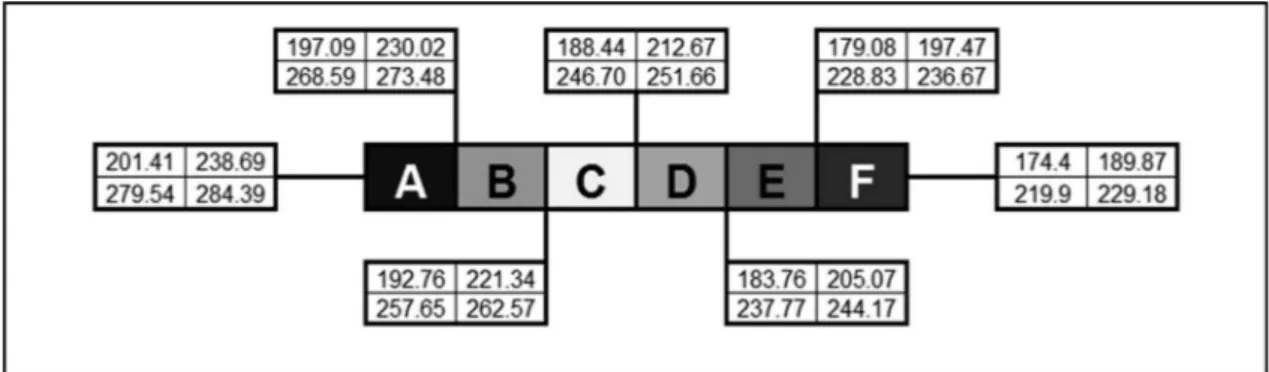
With the average values deined, it was possible to deine the values that delimit the six levels of the label, with “Level A” for best performance and “Level F” for poorest, with the values of the labels varying
in according with the limits of each Ci, i = 1, ..., 4,
presented in Figure 1.
The upper limit of each classification level (Figure 1) was deined as follows: upp lim A and
upp lim B were determined as such for Ci, (upp lim A – upp lim A) = (upp lim A – upp lim B) = (upp lim
B – upp lim C). The same occurs in all the D, E and
F levels: (upp lim C – upp lim D) = (upp lim D – upp lim E) = (upp lim E – upp lim F).
The other schools cannot be classiied directly.
For instance, for S4, the values for C1, C2 and C3 it
into Level C of the school performance label, but
C4 belongs to Level B. thus, the question we have
to face is how to deine the classiication of the
other schools.
To answer this question, data mining techniques were used to deine the classiications of the label.
Nevertheless, to apply the techniques it is necessary
to conduct a preliminary change of scale (data transformation) in the data extracted from the INEP website (Chart 4). This change of scale occurred through the algorithm presented in Figure 3, below,
where the new values for X(i, j) are obtained through the current values. Thus, each new X(i, j) element is
presented in Chart 4.
Thus, the data mining techniques are applied to classify the 16 unclassiied schools.
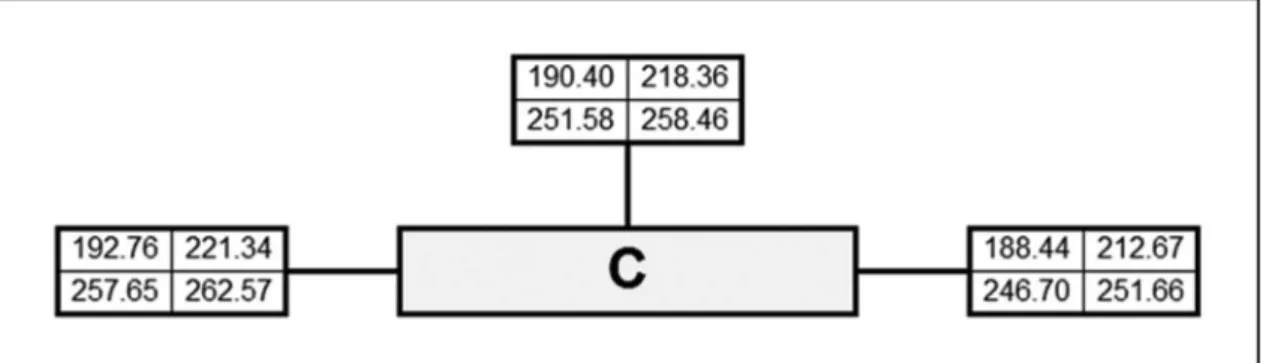
the 17 schools in question, only one its directly into a level of the label. This is S5, which its into Level C, i.e., S5 is automatically classiied as having “C” quality.
Figure 2 shows that S5 has 188.44 ≤ C1 = 190.40 ≤
192.76; 212.67 ≤C2=218.36 ≤ 221.34; 246.70 ≤ C3 =
251.58 ≤ 257.65; and 251.66 ≤C4 = 258.46 ≤ 262.57. Chart 1. “Prova Brasil” grades – Araucária, PR.
School
Early Years Final Years
Portuguese (0-350)
Mathematics (0-425)
Portuguese (0-350)
Mathematics (0-425)
S1 199.05 219.16 250.40 258.33
S2 176.19 204.38 246.03 243.44
S3 195.01 206.72 238.16 243.29
S4 192.45 215.27 247.60 249.31
S5 190.40 218.36 251.58 258.46
S6 194.40 214.96 239.08 244.28
S7 197.18 218.81 227.29 235.91
S8 183.41 202.93 219.90 229.18
S9 185.14 212.60 255.67 257.05
S10 194.20 214.98 237.33 252.94
S11 183.44 206.16 238.11 240.13
S12 174.40 199.76 240.94 242.30
S13 180.53 205.80 247.05 250.21
S14 183.24 229.39 252.05 267.19
S15 174.47 189.87 262.62 259.40
S16 201.41 238.69 260.56 262.36
S17 198.51 217.58 279.54 284.39
Fonte: INEP (2011).
Chart 2. “Prova Brasil” grades for school S1.
Level of Teaching
Subject
Portuguese Mathematics
Early Years 199.05 219.16
Final Years 250.40 258.33
Chart 3. Average grades of the “Prova Brasil” in the selected region.
Level of Teaching
Subject
Portuguese Mathematics
Early Years 188.44 212.67
Final Years 246.70 251.66
4.1 Data mining techniques
The Data Mining stage is the most important of the KDD process because it is here that the pattern recognition techniques are applied, through exact, heuristic or meta-heuristic procedures. The techniques used to classify the 16 schools that could not be directly classiied in the classiication label were
Artiicial Neural networks (Haykin, 1999; Mitchell, 1997), SVM (Vapnik, 1995, 1998; Burges, 1998) and Genetic Algorithms (Holland, 1992; Goldberg, 1989).
The common characteristics of all three techniques
are those that were used to assess the learning,
stratiied three-fold cross validation (each application is referred to here as a stage), i.e., the set of data for training were divided into two subsets: 2/3 for the
Figure 2. School S5 classiied (with peformance level “C”) directly to the label.
Chart 4. “Prova Brasil” grades following transformation.
School Early Years Final Years
Portuguese Mathematics Portuguese Mathematics
S1 0.09 0.40 0.49 0.47
S2 0.93 0.70 0.56 0.74
S3 0.24 0.65 0.69 0.74
S4 0.33 0.48 0.54 0.64
S5 0.41 0.42 0.47 0.47
S6 0.26 0.49 0.68 0.73
S7 0.16 0.41 0.88 0.88
S8 0.67 0.73 1.00 1.00
S9 0.60 0.53 0.40 0.50
S10 0.27 0.49 0.71 0.57
S11 0.67 0.67 0.69 0.80
S12 1.00 0.80 0.65 0.76
S13 0.77 0.67 0.54 0.62
S14 0.67 0.19 0.46 0.31
S15 1.00 1.00 0.28 0.45
S16 0.00 0.00 0.32 0.40
S17 0.11 0.43 0.00 0.00
training set and 1/3 for the test set. Thus, as there are six classiication levels (ranging from A to F, with 60 records per level created ictitiously) there are 360 records, of which 240 are used for training and 120 for tests. As they are stratiied, each set (training and test0 is formed by classes (A to F) with the same
quantity of elements.
Furthermore, the training of each technique occurred
ive times (phases), one training for each class seeking
to identify whether the record belongs to a determined
class. Thus, the training was conducted for class A, making the network “learn” what constitutes a class A record (value close to 0) and what does not (value close to 1, i.e., B, C, D, E and F). Then, removing the data of set A, already classiied, another training is conducted for class B, making the network “learn” what constitutes a class B record and what does not (C, D, E and F) and so forth for classes C, D and E. During the inal training (class E), when a record is not classiied as E, it is automatically classiied as F (last class) (Steiner et al., 2006).
Therefore, when classifying a new record, it has to be “presented” to all the phases, thereby obtaining its classiication. It should be highlighted that the equipment used for the tests was an Intel Core™ i5, laptop with a 2.27GHz processor and 4GB RAM memory. The execution times for all the tests were less than ive seconds.
The particular characteristics of each technique are now presented (all of them are well known, and further details are unnecessary) in addition to their
particularities in the application.
4.1.1 Artiicial Neural Networks (ANNs)
In the application of ANNs, the backpropagation
learning algorithm was used, implemented using Visual
Basic 6.0. Each ANN had four inputs (C1, C2, C3 and C4),
a hidden layer (with the number of neurons varying from “1” to “20”) and a neuron in the output layer, indicating the class and sigmoid (logistic) activation function (logistic) in all the neurons.
The network was trained ive times, with a random variation of the set of weights, in an interval of (-1, 1). There were a total of 1500 tests (3 stages x 5 sets of initial weights x 20 quantities of neurons in the hidden layer x 5 classiication levels. Each training was inalized when the following three conditions were achieved: 1000 iteractions; average squared error less than or equal to 10-4; or number of classiied records incorrectly equal to zero.
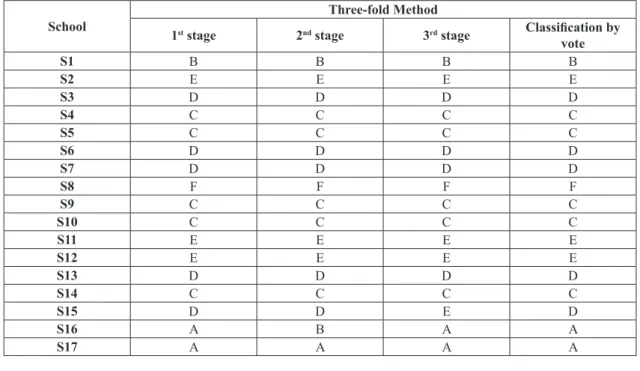
In this application, the success rate in the training of the technique was 100%. For the test, considering the three stages, the success rate was 98.89%. The results of the classiication of the schools through the
application of this technique are shown in Chart 5.
In Chart 5 and the others that will be presented
below, the “Classiication by vote” column indicates the classiication of the highest occurrence in the previous columns. When there is no classiication with a higher occurrence, as is the case for E15, the classiication is deined by the poorest placing of
the three stages.
Although S5 had already been deined, as it was directly classiied to the label (as shown above), it was also introduced to the networks to conirm its classiication. Thus, through the classiication
Chart 5. Result of the classiication of schools (ANN).
School
Three-fold Method
1st stage 2nd stage 3rd stage Classiication by
vote
S1 C C B C
S2 E E E E
S3 D D D D
S4 C C C C
S5 C C C C
S6 C C D C
S7 D D D D
S8 E E E E
S9 C C C C
S10 C C C C
S11 E E D E
S12 F F E F
S13 D D D D
S14 E C C C
S15 F D E F
S16 B B B B
obtained by the ANNs, there is one school with an “A” classiication, one with a “B” classiication, seven with a “C” classiication, three with a “D” classiication, three with an “E” classiication and two with an “F” classiication.
4.1.2 Support vector machines
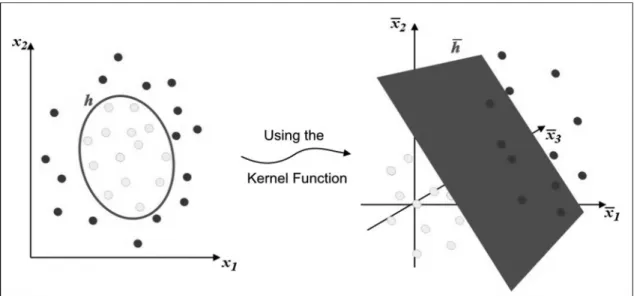
The SVM technique seeks a plane that has the
same distance for elements of both classes, using a
Kernel function (which calculates the classiication function) for sets in which the data are not linearly separable. This is done by projecting the data into the “characteristics space”, where they can be separated linearly through an extra dimension. Thus, despite
the data not being linearly separable in the pattern input space, they will be in the characteristics space, as shown in Figure 4 (Vapnik, 1995, 1998; Burges,
1998).
For the application of the SVM technique, the
svmtrain function of MATLAB 7.9.0 software was
used, with the following parameters: “kernel function: linear”; “optimization method: Sequential Minimal Optimization”; “tolerance for training method: 10-3”; “kernel multilayer perceptron: [-1, 1]”.
Furthermore, two matrices were used with the
arguments: “Examples” and “Response”, in accordance with Equation 1, below. The “Examples” matrix has
four inputs Ci (C1, C2, C3 and C4) in its columns and
the “Response” matrix has only one column with
the value of the interval for each of the patterns
(“Examples”), i.e., classes “A” to “F”.
Training = svmtrain (Examples, Response) (1) Then, the test set, described here as the “NewExamples” matrix, and the result of the “Training” with the
svmclassify, as shown in Equation 2, were used to
verify the percentage of correct classiications of
these new data.
Classiication = svmclassify
(Training, NewExamples) (2)
It should be emphasized that the arguments used
in the training for the svmtrain function are the
default of Matlab 7.9.0, as the sets of levels of the performance classiication label are separable by a hyperplane. Fifteen tests were conducted (3 stages x 5 classiication levels). The success rate in the training was 100%, considering the three stages of the three-fold method, and 100% in the test. Chart 6,
below, shows the results of the classiication of the schools obtained through the application of SVM.
Chart 6 provides the following Classiication by vote for the schools: two with an “A” classiication, one with a “B” classiication, ive with a “C” classiication, ive with a “D” classiication, three with an “E” classiication and one with an “F” classiication. It should be emphasized that this technique also correctly classiied S5, which had already been directly classiied in the performance label.
4.1.3 Genetic algorithm
The GA was used to determine a hyperplane in
such a way that in each hyperspace determined would
contain only one of the sets of each of the ive phases
of application at each stage, in accordance with
the application method of the technique. It should be highlighted that the training sets as deined are
linearly separable.
The value of the itness function is derived from the algorithm that determines four points that deine
the hyperplane, in which the coordinates of each point are the alleles of individuals. Each individual
is composed of 16 alleles with values belonging to the set of real numbers. Thus, the irst four alleles
represent the coordinates of a point denominated P1.
The next four alleles are the coordinates of point P2.
The next four are the coordinates of point P3, and the last four are the coordinates of point P4. There is also
the itness calculation that takes into consideration
the difference of the distances between two points
(in different sets) that are closest to the hyperplane. The greater the difference between the distances, the greater the penalty applied to the itness.
Thus, Figure 5 presents this algorithm for
calculating itness, in which X is a vector in which each coordinate represents an allele of the individual
in the population; CL1 is the set of data for “Class1”
(e.g., “A”) and CL2 is the set of data for “Class2”;
(not “A”) are the sets for training; k is an element that belongs to Class1
Class2; EP(α) is the equation ofthe plane deined by P1, P2, P3 and P4.
Concerning the algorithm presented in Figure 5,
the following observations were made:
i) If k∈CL1 then k should belong to the hyperspace inferior to a, and so EP(k) should have a negative
value;
ii) If k∈CL2 then k should belong to the hyperspace superior to a, and so EP(k) should have a positive
value;
Chart 6. Result of the classiication of schools (SVM).
School
Three-fold Method
1st stage 2nd stage 3rd stage Classiication by
vote
S1 B B B B
S2 E E E E
S3 D D D D
S4 C C C C
S5 C C C C
S6 D D D D
S7 D D D D
S8 F F F F
S9 C C C C
S10 C C C C
S11 E E E E
S12 E E E E
S13 D D D D
S14 C C C C
S15 D D E D
S16 A B A A
S17 A A A A
iii) Dist1 and Dist2 are initialized with high values
so that the algorithm determines whether the hyperplane is equidistant or closely equidistant
to the training sets (CL1 and CL2).
To apply the GA, a penalty of 0.1 and the toolbox of Matblab 7.9.0: gatoo were used. The arguments
for the training were the defaults that obtained the
best results, with some shown as follows: “population type: double vector”; “population size: 20”; “itness scaling: rank”; “crossover fraction: 0.8”; “crossover function: scattered”; “stopping criteria (generations): 100”; stopping criteria (stall generations): 50”; and “stopping criteria (function tolerance): 10-6”. The three stopping criteria were used in such a way
that when one of them was achieved, the procedure
was inalized.
It should be remembered that the “crossover scattered” works as follows: the crossover default
function creates a random binary vector and selects
the genes where the vector is “1” of the irst factor and the genes where the vector is a “0” of the
second father, and combines the genes to form a son. For instance, if p1 and p2 are the fathers: p1 = [a b c d e f g h]; p2 = [1 2 3 4 5 6 7 8] and the
binary vector is [1 1 0 0 1 0 0 0], the function will return to the second son: [a b 3 4 and 6 7 8].
A total of 45 tests were conducted (three stages of the three-fold method x ive classiication phases, “A” to “F” x three tests with different populations)
with the parameters as described above.
The success rate of the training was also 100%, considering the three stages of the three-fold method, and 99.44% in the test. The results of the
classiication of the schools obtained through the
application of this technique are shown in Chart 7.
Here, S5 also conirmed its classiication. Therefore, there is one school with classiication “A”, one with classiication “B”, ive with classiication “C”, ive with classiication “D”, two with classiication “E” and three with classiication “F”.
4.2 Analysis of the results
The analysis of the results, the last stage of the KDD process, is conducted by comparing the classiications obtained using the three techniques. The results of the classiications from the three techniques are shown in Chart 8 (the column labeled “Classiication by vote”
in Charts 5 to 7). Furthermore, in this chart there is
also a column labeled “Classiication by vote” that
indicates the result of the largest occurrence among the three techniques, which in this analysis we accepted as the most adequate result for the problem in question.
Analyzing this chart, of the 17 schools 7 (S3, S4, S5, S7, S9, S14 and S17) had the same classiication using all the techniques. The others had equal classiication in only two of the techniques. One of these (S6) had the same classiication using SVM and GA; ive (S1, S8, S12, S15 and S14) had the same classiication using ANN and GA; and four (S2, S10, S11 and S13) had the same classiication using ANN and SVM.
Comparing each technique with the classiication that is accepted as adequate (column labeled “Classiication by vote”), for the SVM there are ive schools (S1, S8, S12, S15 and S16) with classiications that are different from those presented in the “Classiication by vote
Chart 7. Result of classiication of schools (GA).
School
Three-fold Method
1st stage 2nd stage 3rd stage Classiication by
vote
S1 C B C C
S2 E F E F
S3 C D D D
S4 C C C C
S5 C C C C
S6 C D D D
S7 C D D D
S8 F E E E
S9 D C C C
S10 C D D D
S11 D D E D
S12 E F F F
S13 E E D E
S14 B C A C
S15 E F D F
S16 B B B B
column”, with four of these at neighboring levels. The school with a classiication at a non-neighboring level was S15, with a “D” classiication, while the one accepted as correct was “F”. For the GA technique, there are four schools (S2, S10, S11 and S13) with different classiications from the “Classiication by vote” column, but all of these are at neighboring levels.
Finally, the ANN technique has only one school (S6) with a different classiication, but at a neighboring level, i.e., the classiication obtained using this technique was “C”, while the one accepted as correct was “D”. This is the technique that came closest to
the result that is accepted as correct when the three techniques are compared.
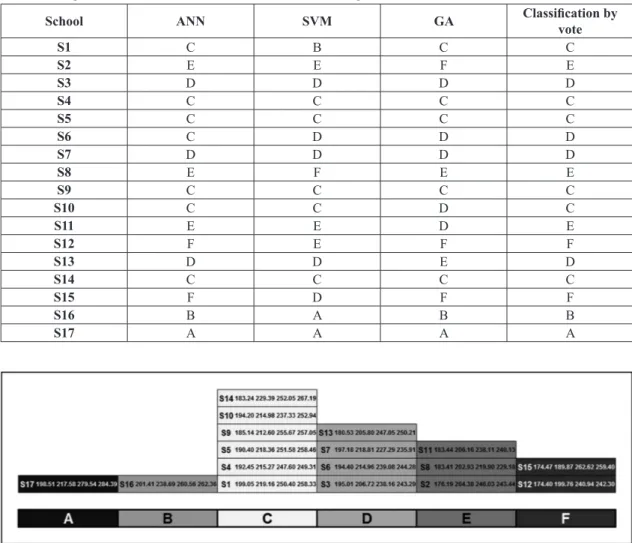
Thus, the adequate classiication of the schools, as
shown in Figure 6, is: one with an “A” classiication,
one with a “B” classification, six with a “C” classiication, four with “D”, three with “E” and two with “F” (Figure 6).
Returning to the questions raised at the beginning of
this article, where it was said that it was not possible
to indicate the best school only by analyzing their performance in the Prova Brasil, given that S17 had the best results in the inal years and S16 in the
early years, the performance label indicates that
the best school is S17, with an “A” classiication. This is followed by S16, with a “B” classiication. The same is true regarding the schools with the poorest performance in the Prova Brasil, with S15 and S12 having the poorest grades in the early years and S8 in the inal years. The label indicates that S8 has an “E” classiication and S12 and S15 have an “F” classiication.
5 Final considerations
As commented in the introduction to this article,
this study seeks to answer question regarding how
to use real data to create a label, how to deine an “average” reference for the classiication label and how to classify an element in the classiication label that does not directly it any classiication level.
Chart 8. Comparison of the results of the ANN, SVM and GA techniques.
School ANN SVM GA Classiication by
vote
S1 C B C C
S2 E E F E
S3 D D D D
S4 C C C C
S5 C C C C
S6 C D D D
S7 D D D D
S8 E F E E
S9 C C C C
S10 C C D C
S11 E E D E
S12 F E F F
S13 D D E D
S14 C C C C
S15 F D F F
S16 B A B B
S17 A A A A
basic education (1st to 9th year) in comparison with
the others and also classify the school not considering truancy and failure rates.
It is worth highlighting that for many researchers in the ield of education it is clear that “educational quality” depends on other factors such as the criteria presented by the cost-beneit per student, size of the school, “student-class” ratio and “student-teacher”
ratio, initial and ongoing teacher training, school management, appreciation of education professionals and other factors.
In this article, we consider performance in tests such as the Prova Brasil as relecting these factors,
i.e., it is a consequence, as evaluation is fundamental to the teaching and learning process.it is through assessment that the school community can seek ways of improving the quality of education.
Thus, the application of this method for creating
school performance labels comparatively through
performance in the Prova Brasil presented non-explicit
knowledge when the grades of this assessment were
analyzed, showing the importance of the KDD process
in educational databases and that it is important to further the analysis of this educational quality indicator.
An alternative for using the proposed method would be to create a label from grades in other oficial examinations administered by the federal/state/municipal government or a speciic examination prepared for
this purpose based on the data that is considered important when seeking to improve students’ levels
of school and scientiic knowledge.
Finally, due to the versatility of the method proposed in this study, there remains a great deal to
To answer the irst question, data were collected from the INEP (2011). With the aid of the KDD
process, an attempt was made to discover knowledge
in the databases in question. The second question
is answered by determining the upper limit of the
“C” level of the label through the average of the individual charts of each element “comparatively”, as a group/region is analyzed. In other words, relative rather than absolute results are obtained. It is also due to these individual igures, where the classes are deined by Ci, that the proposed methodology is
considered versatile.
To answer the third and last question, the present study used three techniques (ANN, GA and SVM), all of which are related to pattern classiications. The ANN technique had the best performance for
this case study.
Regarding the case study, the proposed methodology reveals unobserved knowledge when analyzing only the IDEB index (Chart 9). An example of this is the
fact that S12 has a higher IDEB at both levels of basic education (early years and inal years) than S2, but considering only the Prova Brasil grades and applying the proposed methodology, the classiication is exactly the opposite: S2 has an “E” classiication and S12 has an “F” classiication. The same occurs in the case of schools S17 and S14.
This means that the IDEB does not identify the
school were the student have the best performance, which is the criterion considered by most of the
population to deine a “good school”.
With the classiication label based on performance in the Prova Brasil, it is possible to view learning in
Chart 9. IDEB of schools in the study.
School
IDEB
Average IDEB
Classiication:
Proposed methodology Early Years Final Years
S1 4.90 4.00 4.45 C
S2 4.20 3.10 3.65 E
S3 4.60 3.20 3.90 D
S4 4.50 3.70 4.10 C
S5 4.90 4.20 4.55 C
S6 5.00 3.90 4.45 D
S7 5.30 3.40 4.35 D
S8 4.40 3.80 4.10 E
S9 5.00 4.30 4.65 C
S10 4.70 4.00 4.35 C
S11 4.50 3.60 4.05 E
S12 4.60 3.20 3.90 F
S13 4.20 4.20 4.20 D
S14 5.40 5.00 5.20 C
S15 4.10 4.30 4.20 F
S16 5.50 4.40 4.95 B
Fayyad, U., Piatetsky-Shapiro, G., Smyth, P., & Uthurusamy, R. (1996). Advances in knowledge discovery & data mining. 1 ed. Califórnia: American Association for Artificial Intelligence, Menlo Park.
Ferreira, A. B. H. (2001). Novo dicionário da língua portuguesa. 2 ed. Rio de Janeiro: Nova Fronteira. Figueiredo, L. F. No, Sauer, L., Borges, G. R. C., & Belizario,
J. B. (2006). Método servqual: um estudo de satisfação em uma escola de idiomas. In Anais do XIII Simpósio de Engenharia de Produção (pp. 1-12). Bauru: Atlas. Fowler, E. D., Mello, C. H. P., & Costa, P. L. O., No.
(2011). Análise exploratória da utilização do programa de qualidade GESPÚBLICA nas instituições federais de ensino superior. Revista Gestão & Produção, 18(4), 837-852.
Garvin, D. A. (1992). Gerenciando a qualidade. Rio de Janeiro: Qualitymark.
Góes, A. R. T., Steiner, M. T. A., Steiner Neto, P. J., & Canciglieri, O. (2014). Power quality management in distribution systems. Advanced Materials Research, 945-949, 3060-3068. http://dx.doi.org/10.4028/www. scientific.net/AMR.945-949.3060.
Goldberg, D. E. (1989). Genetic algorithms in search, optmization, and machine learning. Massachusetts: Addison-Wesley Publishing Company, Inc.
Graells, P. M. (1999). Criterios para la clasificación y evaluación de espacios web de interés educativo. Revista Educar, 25, 95-111.
Haykin, S. (1999). Neural networks: a comprehensive foundation. 2 ed. New Jersey: Prentice Hall.
Holland, J. H. (1992). Adaptacion in natural and artiicial systems (p. 211). 2 ed. Cambridge: Mit Press. Huang, S., & Fang, N. (2013). Predicting student academic
performance in an engineering dynamics course: A comparison of four types of predictive mathematical models. Computers & Education, 61, 133-145. http:// dx.doi.org/10.1016/j.compedu.2012.08.015.
Inbar, D. E. (1988). Quality educational indicators in a nation in the making: the case of Israel. Studies in Educational Evaluation, 14(1), 55-63. http://dx.doi. org/10.1016/0191-491X(88)90019-3.
Instituto Nacional de Estudos e Pesquisas Educacionais Anísio Teixeira – INEP. (2011). Prova Brasil e Saeb. Recuperado em 16 de agosto de 2011, de http://portal. inep.gov.br/web/prova-brasil-e-saeb/prova-brasil-e-saeb Kardan, A. A., Sadeghi, H., Ghidary, S. S., & Sani, M.
R. F. (2013). Prediction of student course selection in online higher education institutes using neural network. Computers & Education, 63, 1-11. http://dx.doi. org/10.1016/j.compedu.2013.01.015.
Mahapatra, S. S., & Khan, M. S. (2007). A neural network approach for assessing quality in technical education: an empirical study. International Journal of Productivity be explored with different techniques in different
ields. It would be desirable to develop an article that
addresses the concepts of quality in detail, together with quality indicators in education that currently
exist and a “translation” to a language of operations for the themes and concepts in the ield of teaching.
Acknowledgements
The second author is grateful to CNPq for scholarship (number 301934/2011-8).
References
Abari, A. A. F., Yarmohammadian, M. H., & Esteki, M. (2011). Assessment of quality of education a non-governmental university via SERVQUAL model. Procedia: Social and Behavioral Sciences, 15, 2299-2304. http://dx.doi. org/10.1016/j.sbspro.2011.04.097.
Ansary, A., Jayashree, A., & Malarvizhi, C. A. N. (2014). The effect of gender and nationality on service quality in Malaysian higher education. Journal of Developing Areas, 48(4), 97-118. http://dx.doi.org/10.1353/jda.2014.0076. Benaim, M. (1984). A model for the evaluation of
instructional methods. IEEE Transactions on Education, E-27(2), 105-108.
Birenbaum, M. (2007). Evaluating the assessment: sources of evidence for quality assurance. Studies in Educational Evaluation, 33(1), 29-49. http://dx.doi.org/10.1016/j. stueduc.2007.01.004.
Brasil. (5 maio 2010). Ministério da Educação. Conselho Nacional de Educação. Parecer CNE/CEB n. 8/2010. Estabelece normas para a aplicação do inciso IX do artigo 4º da Lei n. 9.394/96 (LDB), que trata dos padrões mínimos de qualidade de ensino para a Educação Básica pública. Brasília, DF. Aguardando homologação. Burges, C. J. C. (1998). A tutorial on support vector
machines for pattern recognition. Data Mining and Knowledge Discovery, 2(2), 121-168. http://dx.doi. org/10.1023/A:1009715923555.
Carreira, D., & Pinto, J. M. R. (2007). Custo aluno-qualidade inicial, rumo à educação pública de qualidade no Brasil (Campanha Nacional pelo Direito à Educação). São Paulo: Ed. Global.
Carvalho, A. A. A. (2006). Indicadores de qualidade de sites educativos (Cadernos do Sistema de Avaliação, Certificação e Apoio à Utilização de Software para a Educação e a Formação, 2, pp. 55-78). Brasília: Ministério da Educação.
Dockrell, W. B. (1988). National quality indicators in Scotland. Studies in Educational Evaluation, 14(1), 47-53. http://dx.doi.org/10.1016/0191-491X(88)90018-1. Elley, W. B. (1976). Evaluation studies - national assessment
engenharia de produção a distância. Revista Gestão & Produção, 13(1), 141-149.
Steiner, M. T. A., Soma, N. Y., Shimizu, T., Nievola, J. C., & Steiner, P. J. No. (2006). Abordagem de um problema médico por meio do processo de KDD com ênfase à análise exploratória dos dados. Revista Gestão & Produção, 13(2),325-337.
Tillema, H., Leenknecht, M., & Segers, M. (2011). Assessing assessment quality: criteria for quality assurance in design of (peer) assessment for learning – a review of research studies. Studies in Educational Evaluation, 37(1), 25-34. http://dx.doi.org/10.1016/j.stueduc.2011.03.004. Udo, G. J., Bagchi, K. K., & Kirs, P. J. (2011). Using
SERVQUAL to assess the quality of e-learning experience. Computers in Human Behavior, 27(3), 1272-1283. http:// dx.doi.org/10.1016/j.chb.2011.01.009.
Van Casteren, J. F. L., Enslin, L. H. R., Hulshorst, W. T. J., Kilng, W. L., Hamoen, M. D., & Cobben, J. F. G. (2005). Acustomer oriented approach to the classification of voltage dips. In 18th International Conference and exhibition on Electricity Distribuion – CIRED (pp. 1-6). Turin: CIRED.
Vapnik, V. (1995). The nature of statistical learning theory. New York: Springer-Verlag.
Vapnik, V. (1998). Statistical learning theory. New York: John Wiley & Sons.
Wang, H., Chang, C., & Li, T. (2008). Assessing creative problem-solving with automated text grading. Computers & Education, 51(4), 1450-1466. http://dx.doi.org/10.1016/j. compedu.2008.01.006.
Yeh, S., & Lo, J. (2005). Assessing metacognitive knowledge in web-based CALL: a neural network approach. Computers & Education, 44(2), 97-113. http://dx.doi. org/10.1016/j.compedu.2003.12.019.
and Quality Management, 2(3), 287-306. http://dx.doi. org/10.1504/IJPQM.2007.012451.
Meng, A., Ye, L., Roy, D., & Padilha, P. (2007). Genetic algorithm based multi-agent system applied to test generation. Computers & Education, 49(4), 1205-1223. http://dx.doi.org/10.1016/j.compedu.2006.01.012. Mitchell, T. (1997). Machine learning. New York: McGraw
Hill.
Moreno, J., Ovalle, D. A., & Vicari, R. M. (2012). A genetic algorithm approach for group formation in collaborative learning considering multiple student characteristics. Computers & Education, 58(1), 560-569. http://dx.doi. org/10.1016/j.compedu.2011.09.011.
Moss, P. J., Barfield, B. J., & Blythe, D. K. (1978). Evaluation in continuing education: a pilot study. IEEE Transactions on Education, E-21(2), 53-58.
Oliveira, R. P. & Araujo, G. C. (2005). Qualidade do ensino: uma nova dimensão da luta pelo direito à educação. Revista Brasileira de Educação, 28, 1-20.
Paladini, E. P. (1995). Gestão da qualidade no processo: a qualidade na produção de bens e serviços. São Paulo: Atlas.
Parpala, A., & Lindblom-Ylanne, S. (2007). University teachers’ conceptions of good teaching in the units of high-quality education. Studies in Educational Evaluation, 33(3-4), 355-370. http://dx.doi.org/10.1016/j. stueduc.2007.07.009.
Salomi, G. G. E., Miguel, P. A. C., & Abackerli, A. J. (2005). SERVQUAL x SERVPERF: comparação entre instrumentos para avaliação da qualidade de serviços internos. Revista Gestão & Produção, 12(2), 279-293.