ISSN 0104-6632 Printed in Brazil
www.abeq.org.br/bjche
Vol. 33, No. 04, pp. 753 - 762, October - December, 2016 dx.doi.org/10.1590/0104-6632.20160334s20150268
Brazilian Journal
of Chemical
Engineering
COMBINED TREATMENT OF VINASSE BY AN
UPFLOW ANAEROBIC FILTER-REACTOR AND
OZONATION PROCESS
A. Cabrera-Díaz
1*, I. Pereda-Reyes
1, J. Dueñas-Moreno
1, E. Véliz-Lorenzo
2,
M. A. Díaz-Marrero
1, C. L. Menéndez-Gutiérrez
1, D. Oliva-Merencio
3and M. Zaiat
41
Process Engineering Center, (CIPRO), Universidad Tecnológica de La Habana José Antonio Echeverría (Cujae), 11901, 114 Street, Marianao, Havana, Cuba.
Phone: + (53) 537 266 3398, Fax: + (53) 537 267 2964 E-mail: [email protected]
2National Center for Scientific Research, (CNIC), 15202, Av. 25 and 158, Cubanacan, Playa, Havana, Cuba. 3
Study Center for Renewable Energy Technology, (CETER), Universidad Tecnológica de La Habana José Antonio Echeverría (Cujae),
11901, 114 Street, Marianao, Havana, Cuba. 4
Biological Processes Laboratory, Center for Research, Development and Innovation in Environmental Engineering, São Carlos School of Engineering, (EESC),
University of São Paulo, (USP), Engenharia Ambiental, Bloco 4-F, Av. João Dagnone 1100, Santa Angelina, 13563-120, São Carlos - SP, Brazil.
(Submitted: April 27, 2015 ; Revised: November 8, 2015 ; Accepted: December 8, 2015)
Abstract - The aim of the present study was to evaluate the efficacy of treating vinasse using anaerobic digestion (AD) followed by ozonation. The AD process was performed using a laboratory-scale upflow anaerobic filter reactor (UAFR) under continuous operation at 29 ± 1 °C. Stable conditions were reached at 10 kgCOD m-3 d-1 and a hydraulic retention time (HRT) of 5 days. Under these conditions, the efficiency of
reduction of the chemical oxygen demand (COD) and the methane yield were 75.1% and 0.315 m3CH4
kgCODr-1, respectively. The anaerobically digested effluent was further treated using ozone in a bubbling column. An experimental 23 array [C(03)g= 70; 100 mgO3 L-1; pH= 7.5; 10; tc = 1 and 3 h] was used. The best conditions for effluent ozonation were 100 mgO3 L-1, pH 7.5 and 3 hours of contact with ozone. The average efficiencies for COD, color and turbidity reduction were 82.4, 93.8 and 99.3%, respectively.
Keywords: Anaerobic digestion; Combined treatment; Methane; Ozonation; Upflow anaerobic filter reactor; Vinasse.
INTRODUCTION
Vinasse is a by-product of the ethanol-distillation process. Its final disposal is a serious problem be-cause vinasse is a high-strength liquid residue that has negative effects on the environment. The vinasse generation rate has been reported to range from 8 to 20 L per L of ethanol produced, and its chemical oxy-gen demand (COD) and biochemical oxyoxy-gen demand
(BOD) levels have been reported to range from 50 to 150 kgCOD m-3 and from 20 to 80 kgBOD m-3, respectively (España et al., 2011; Mohana et al., 2009). Vinasse is characterized by a low pH (<5) and a dark-brown color, which can be attributed to the presence of phenolic compounds and melanoidins.
a non-enzymatic reaction involving sugars and amino acids, known as the Maillard reaction (Mar-tins and van Boekel, 2005). The empirical formula of melanoidins is C17-18H26-27O10N (Satyawali and Balakrishnan, 2007).
Alternative methods for the final disposal of vi-nasse are fertilization/irrigation due to its high levels of organic matter and nutrients, for biomethanation and direct discharging into bodies of water. The ferti-lization/irrigation technique is currently questioned due to the negative impacts of its long-term applica-tion on the soil and groundwater. Environmental impact studies have been conducted on the effects of using raw or digested vinasse for irrigation on the properties of soil and groundwater (Lyra et al., 2003; Jain et al., 2005; Biswas et al., 2009; Hati et al., 2007; Fuess and Garcia, 2014). The main effects of vinasse treatment on the characteristics of soil were improving its physical structure, carbon content, aggregate stability, cationic exchange capacity (CIC) and microbial activity (Biswas et al., 2009, Hati et al., 2007). However, some ion-leaching and saliniza-tion problems were detected.
In contrast, the reported effects of vinasse on groundwater varied considerably due to differences in the monitoring processes employed and which soil characteristics were evaluated, seasonal variations and differences in how the vinasse was discharged. The main problems that have been identified were the increment of electrical conductivity (EC), total dissolved solids (TDS) and ion concentrations (Lyra
et al., 2003; Jain et al., 2005; Hati et al., 2007). Vi-nasse discharge into bodies of water affected the aquatic biota due to the diminishment of the level of dissolved oxygen in the water that occurred as the organic matter degraded. Severe disorders of the respiratory systems of fishes also developed, induc-ing lethal intoxication (Kumar et al., 1995; Rama-kritman et al., 2005).
Anaerobic or aerobic biological processes or a combination of both have been widely used for vi-nasse treatment (Rajagopal et al., 2010) because their application resulted in the reduction of organic matter (in terms of both COD and BOD) at high efficiency. Moreover, in the case of utilizing a bio-logical anaerobic process for vinasse treatment, the additional benefits include the recovery of energy and the production of a biofertilizer (Moraes et al., 2014). Nevertheless, utilizing these processes has been insufficient to completely solve the problem of the organic-load content, coloration level and recalci-trant-compound content of vinasse effluents exceed-ing the limits of environmental regulations.
Among the anaerobic technologies applied to vi-nasse treatment, those based on the use of an anaero-bic filter reactor (AFR) have been widely investi-gated (Bories and Ranyal, 1988; Rivera et al., 2002; Acharya et al., 2008). AFR systems have been shown to be able to accommodate drastically high organic shock loads (Kumar, 2008), making them appropriate for vinasse treatment. However, as noted above, an anaerobic treatment may not be entirely effective in vinasse processing; thus, it has been sug-gested that a combination of biological and physical-chemical treatments might guarantee the appropriate final disposal of vinasse. Numerous investigations of vinasse post-treatment methods have been con-ducted, including those of adsorption treatments (Figaro et al., 2009; Satyawali and Balakrishnan 2007) and coagulation-flocculation, electrocoagula-tion, ozonation and ultrasonic treatments (Zayas et al., 2007; Inanc et al., 1999; Peña et al., 2003; San-gave et al., 2007). The disadvantages of these post-treatments include their operational difficulties, the high doses of required reagents, the high energetic costs, the unsatisfactory coagulant-recovery rates and the production of polluted sludge.
Moreover, most of the recalcitrant compounds in vinasse are oxidizable using advanced-oxidation processes (AOPs) (Beltrán et al., 1997). These pro-cesses are found to be highly effective in oxidizing organic matter and inactivating the microorganisms present in the residual material. Ozonation is a viable alternative for the pre-treatment or treatment of high-strength wastewater, including that containing recal-citrant compounds (Subha and Muthukumar, 2012). Ozonation has been used to pretreat vinasse to par-tially oxidize both the biodegradable and non-biode-gradable compounds present and to reduce the level of phenolic compounds. Ozonation was found to enhance the biodegradability of vinasse (Siles et al., 2011). Other authors conducted a kinetic study of wine vinasse using ozonation and reported that the COD reduction rate reached 16.6% and 25.2% after 9 h of batch operation and 16 h of continuous opera-tion, respectively (Benítez et al., 2003).
A review of the literature indicated that ozonation has not been reported as a post-treatment strategy for digested vinasse to date. Furthermore, most of the relevant studies of ozonation utilized a combination of anaerobic/aerobic treatments with high ozone dosification (Peña et al., 2003) or intermediate treat-ments between the anaerobic and the aerobic process (Inanc et al., 1999; Sangave et al., 2007).
process with anaerobic-digestion and ozonation as the final step of raw vinasse treatment.
MATERIALS AND METHODS
Substrate and Inoculum
Raw vinasse was collected from a sugar factory in Cuba. These materials were stored frozen at -20 ºC until used. The inoculum used to initiate the anaero-bic process was collected from a mesophilic septic tank operated under environmental conditions. The inoculum was acclimated to anoxic conditions at 30 °C and to vinasse prior to use.
Anaerobic Filter Reactor Set-Up
An upflow anaerobic filter reactor was used for the anaerobic treatment of the raw vinasse. The reac-tor, constructed of plastic (PVC), was 58 cm high, with an internal diameter of 9.5 cm. The effective volume was 3.4 L, and the packed effective volume was 3.23 L, as shown in Figure 1. Randomly dis-persed cylindrical corrugated hollow PVC particles with a specific area of 205 m2 m-3 were used as the supporting material for the adhesion of microbes.
Figure 1: Schematic diagram of the UAFR utilized in this study. 1: Feeding vessel; 2: Peristaltic pump; 3: Upflow anaerobic filter reactor; 4: Gas flowmeter sub-merged in a solution of 15% w/v NaOH; 5: Analog counter; 6: Vessel containing the digested effluent.
Starting-Up the Upflow Anaerobic Filter-Reactor Process
The filter was inoculated using 1.5 L of the previ-ously adapted sludge, after which the UAFR was operated for the next 180 days. During the first 45
days, the reactor was operated at a low organic-load-ing rate (OLR), rangorganic-load-ing from 1 to 2.5 kgCOD m-3 d-1, with recirculation, to promote biofilm formation on the packed bed. When the levels of methane produc-tion and COD reducproduc-tion had stabilized, the OLR was gradually increased from 5 to 10 and finally to 15 kgCOD m-3 d-1, which corresponded to hydraulic retention times (HRTs) of 10, 5 and 3 days, respec-tively. The pH value of the raw vinasse-containing effluent was adjusted before feeding it into the reac-tor using a solution of 25% v/v NaHCO3. The rate of gas flow was measured online, with the line having been previously submerged in a solution of 15% w/v NaOH to count only the amount of methane pro-duced. The reactor was continuously fed using a Watson Marlow 313 peristaltic pump. The tempera-ture was maintained at 29 ± 1 °C.
Ozonation Experimental Set Up
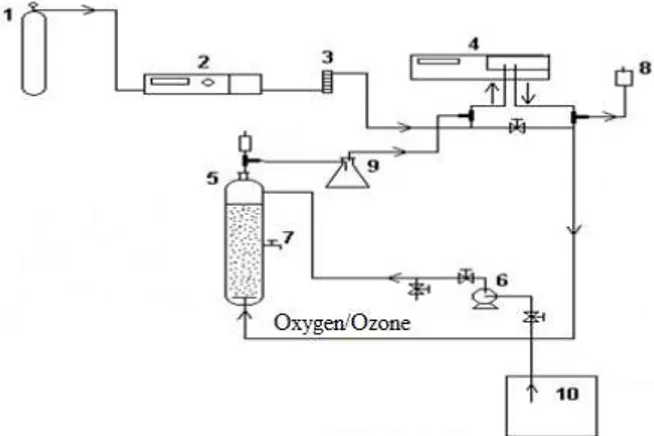
The ozonation trials were conducted on the labor-atory scale using a bubbling column with a 1-L ca-pacity and 4-cm diameter, as shown in Figure 2. A porous borosilicate diffusor was placed in the lower part, inputs and outputs of the column to discharge the residual effluent. A sampling valve was located midway in the liquid column. A foam-collection system was connected to the gas outlet in the upper portion of the column, proximal to the site of the residual ozone-destruction system.
Figure 2: Schematic diagram of the ozonation appa-ratus utilized in this study: 1: Oxygen bottle; 2: Ozone generator; 3: Gas flowmeter; 4: Spectrophotometer; 5: Bubbling column; 6: Peristaltic pump; 7: Sampling valve; 8: Ozone-destruction system; 9: Foam-collection trap; 10: Vessel of the anaerobically digested effluent.
Ozonation Trials
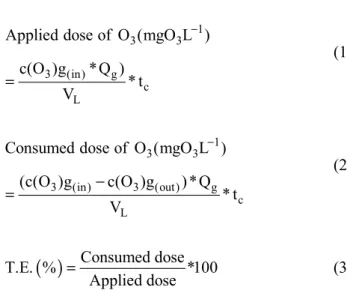
during the anaerobic process for further processing of 600 mL of anaerobically digested raw vinasse effluents. Ozonation was performed in semi-bacth operation because the liquid was only charged ini-tially but the gas was continuosly fed at a gas-flow rate of 15 L h-1. The experimental conditions were designed according to a 23 array, as shown in Table 1. The pH value was adjusted to 10 using a solution of 0.1 M NaOH. The ozone doses applied and con-sumed and the transference efficiency (TE) were calculated according to Equations (1), (2) and (3), respectively.
1
3 3
3 (in) g
c L
Applied dose of O (mgO L )
c(O )g * Q ) * t V
−
=
(1)
1
3 3
3 (in) 3 (out) g
c L
Consumed dose of O (mgO L )
(c(O )g c(O )g ) * Q * t V
−
− =
(2)
( )
Consumed doseT.E. % *100
Applied dose
= (3)
where c(O3)g (in) and c(O3) g (out) are the gaseous ozone concentrations at the input and output sites of the column, respectively, in [mgO3 L-1], Qg is the gas flow rate [L h-1], VL is the volume of the digested effluent to be treated [L] and tc is the contact time of ozone with the digested effluent [h].
Table 1: Experimental design applied to the ozo-nation process.
Factor Range of levels
C(O3)g (mgO3 L-1) 70 100
tc (h) 1 3
pH 7.5 10
Analytical Methods
The levels of total COD (CODt), soluble COD (CODs), BOD5, coloration, conductivity, turbidity, solids, total Kjeldahl nitrogen (TKN), Ptotal, Ca2+, Mg2+ and K+, as well as the pH value in the feeds and effluents were determined according to standard methods (APHA, 2005). The K+ concentration was determined by flame photometry using a Corning
410 instrument. The COD, color and Ptotal levels were determined using a Pharmacia LKB-Ultrospec III spectrophotometer, as well as the inlet and outlet gas concentrations at 256 nm with a gas flow cell with 1 mm optical path. The concentrations of Ca2+ and Mg2+ were determined through titration using EDTA.
The volatile fatty acid (VFA)/total alkalinity ratio was determined according to the method of Lossie and Pütz (2008). The online methane flow rate was measured using a calibrated gas-flow meter with an analog output, and the methane value was standard-ized at 0 °C and 1 atm. The composition of the biogas was determined using a Biogas CDM gas analyzer.
Statistical Analysis
A multifactorial analysis of variance (ANOVA) was used to analyze the experimental results and evaluate the significance of the effects of the ozone concentration, pH and tc. The COD, color and tur-bidity were the response variables. A multiple-range LSD Fischer test was applied using a 95% confi-dence level. The statistical analyses were conducted using Statgraphics Centurion XV software.
RESULTS AND DISCUSSION
Characterization of the Substrate and Inoculum
The inoculum used for the anaerobic-digestion process had a pH value of 7.8 and a total suspended solid (TSS) content, volatile suspended solid (VSS) content and VSS/TSS ratio of 107.3, 58.2 and 0.54 g L-1, respectively. As shown in Table 2, the raw vi-nasse used as a substrate had a high level of COD and a BOD5/COD ratio of 0.48, indicating that this material was moderately biodegradable and was suitable for biological treatment (Ahn et al., 1999).
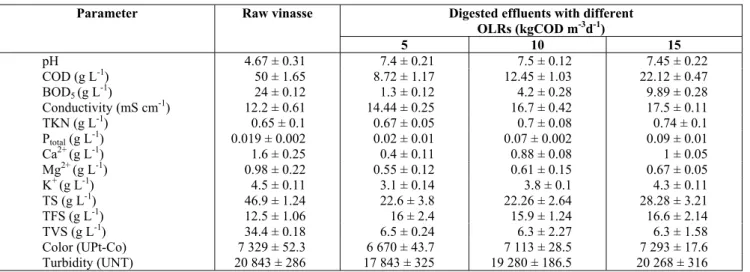
Table 2: Characteristics of the raw vinasse and the effluents with different OLRs that were digested in the UAFR.
Parameter Raw vinasse Digested effluents with different
OLRs (kgCOD m-3d-1)
5 10 15
pH 4.67 ± 0.31 7.4 ± 0.21 7.5 ± 0.12 7.45 ± 0.22
COD (g L-1) 50 ± 1.65 8.72 ± 1.17 12.45 ± 1.03 22.12 ± 0.47
BOD5 (g L-1) 24 ± 0.12 1.3 ± 0.12 4.2 ± 0.28 9.89 ± 0.28
Conductivity (mS cm-1) 12.2 ± 0.61 14.44 ± 0.25 16.7 ± 0.42 17.5 ± 0.11
TKN (g L-1) 0.65 ± 0.1 0.67 ± 0.05 0.7 ± 0.08 0.74 ± 0.1
Ptotal (g L-1) 0.019 ± 0.002 0.02 ± 0.01 0.07 ± 0.002 0.09 ± 0.01
Ca2+ (g L-1) 1.6 ± 0.25 0.4 ± 0.11 0.88 ± 0.08 1 ± 0.05
Mg2+ (g L-1) 0.98 ± 0.22 0.55 ± 0.12 0.61 ± 0.15 0.67 ± 0.05
K+ (g L-1) 4.5 ± 0.11 3.1 ± 0.14 3.8 ± 0.1 4.3 ± 0.11
TS (g L-1) 46.9 ± 1.24 22.6 ± 3.8 22.26 ± 2.64 28.28 ± 3.21
TFS (g L-1) 12.5 ± 1.06 16 ± 2.4 15.9 ± 1.24 16.6 ± 2.14
TVS (g L-1) 34.4 ± 0.18 6.5 ± 0.24 6.3 ± 2.27 6.3 ± 1.58
Color (UPt-Co) 7 329 ± 52.3 6 670 ± 43.7 7 113 ± 28.5 7 293 ± 17.6
Turbidity (UNT) 20 843 ± 286 17 843 ± 325 19 280 ± 186.5 20 268 ± 316
Experimental Anaerobic Treatments at Different OLRs
The main response variables evaluated during the anaerobic process are shown in Table 3.
Table 3: Response variables evaluated during an-aerobic processes conducted at different OLRs.
Response variable
OLR (kgCOD m-3 d-1)
5 10 15
η(%) 82.6 ± 2.25 75.1 ± 1.88 55.8 ± 0.93 CODRed.(g d-1) 12.34 ± 0.86 23.84 ± 1.63 31.93 ± 1.82 YCH4 (m3CH4
kg CODr-1) 0.314 ± 0.019 0.315 ± 0.014 0.316 ± 0.021
As expected, the efficiency of the anaerobic pro-cess in terms of COD reduction decreased with an in-crease in the OLR of the effluent. The low percentage of COD reduction (55.8%) when 15 kgCOD m-3 d-1 was applied indicated that the UAFR should not be operated at OLRs higher than 10 kgCOD m-3 d-1 if higher COD reduction efficiencies are desired. Ri-vera et al.(2002) reported lower efficiencies of COD reduction when an UAFR was operated at OLRs of less than 7.32 kgCOD m-3 d-1. The efficiency of COD reduction reached in this study at 10 kgCOD m-3d-1 (75.1%) was similar to that obtained by Bories and Ranyal (1988), which was between 71% and 73.8% COD reduction at an OLR of 11.45 kgCOD m-3d-1 with an HRT of 2.4 days. Cabrera and Díaz (2013) reported a COD-reduction efficiency of approxi-mately 70%. In contrast, Acharya et al. (2008) re-ported a COD-reduction efficiency of 64% with an OLR of 23.25 kgCOD m-3 d-1 and an HRT of 8 days using a coconut fiber-packed bed.
Figure 3 presents the methane-yield behavior at the three different OLRs tested. The average methane yield was 0.315 m3CH4 kgCODr-1. This value is consistent with that obtained by Rivera et al. (2002), who reported yields ranging from 0.280 to 0.380 m3CH4 kgCODr-1 at OLRs ranging from 0.2 to 10.52 kgCOD m-3 d-1 and temperatures ranging from 20 to 25 ºC. Conversely, Cabrera and Díaz (2013) obtained a yield of 0.270 m3CH4 kgCODr-1 at an OLR of 16 kgCOD m-3 d-1 and an HRT of 2 days.
0.0 0.1 0.2 0.3 0.4
0 5 10 15
40 60 80 100 120 140 160 180 time (days)
YCH
4
(m
3CH
4
k
g
CODr
-1)
OL
R
(kg C
O
D
m
-3d -1)
Figure 3: Methane-yield behavior at different OLRs.
attributed to differences in the set-up of the feeding reactor inlet (upflow or downflow).
In contrast, in a relevant study, Acharya et al.
(2008) obtained a biogas productivity rate of 7.25 m3biogas m-3reac d-1 at an OLR of 23.25 kgCOD m-3 d-1 and a HRT of 8 days. This result might have been due to the nature of the packed bed (coconut fiber) enhancing the formation and adhesion of the bio-mass-based biofilm. The biogas was composed of 66.5% CH4, 25.3% CO2 and 0.2% O2, on average.
Table 4 shows the average values of the control variables. The pH value of the effluent under each operational condition was between 7.4 and 7.5, which was the best alternative for the anaerobic-treat-ment process (Kumar, 2008). According to Lossie and Pütz (2008), the VFA/total alkalinity ratio of digested effluents under stable operating conditions should be between 0.2 and 0.3. In the case of the UAFR, when OLRs of 5 and 15 kgCOD m-3d-1 were applied, this ratio reached values of 0.05 and 0.75, respectively, both of which were not inside the rec-ommended values, indicating the presence of insuffi-cient biomass at 5 kgCOD m-3 d-1 and excess biomass at 15 kgCOD m-3 d-1. Nevertheless, the pH value remained constant under the latter condition. The VFAs that accumulated under this condition were neutralized due to the high total alkalinity level caused by CO2 generation (Kumar, 2008).
Table 4: Behavior of the control variables at dif-ferent OLRs.
Control variable
OLR (kgCOD m-3 d-1)
5 10 15 Effluent pH 7.4 ± 0.21 7.5 ± 0.12 7.45 ± 0.22 VFA (gHAc L-1) 1 ± 0.85 5.1 ± 0.65 5.88 ± 0.92 Total Alk.
(gCaCO3 L-1)
18.51 ± 1.49 21.61 ± 2.35 7.8 ± 1.52
VFA/Total Alk. 0.05 0.24 0.75
Characterization of the Digested Effluents
The effluents that had been digested at the three OLRs studied were characterized. The results are shown in Table 2. During the operation of the UAFR, the TKN and Ptotal of the digested effluents were slightly higher than those of the raw vinasse, indicat-ing no microbial requirements for these compounds and their possible generation through the degradation of the organic materials.
Small variations in the color of the effluents com-pared with that of the raw vinasse were detected despite some color alteration having occurred after the neutralization process was performed. The
tur-bidity values decreased for each applied OLR, but the conductivity value increased with the increase in the OLR due to the addition of dissolved salts to the UAFR to adjust the pH of the effluents. The BOD5/COD ratios of the effluents were 0.15, 0.34 and 0.45 at OLRs of 5, 10 and 15 kgCOD m-3 d-1, respectively, indicating the presence of residual or-ganic matter and the low efficiency level of the an-aerobic process when the OLR was increased. Based on the observed anaerobic behavior, an OLR of 10 kgCOD m-3 d-1 and an HRT of 5 days were selected as the best operational conditions for the UAFR-based digestion of vinasse, the product of which would be further treated using an ozonation process.
Effect of the Ozonation Process on the Reduction of COD, Color and Turbidity from the Digested Effluent
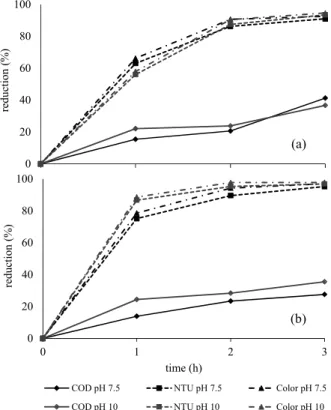
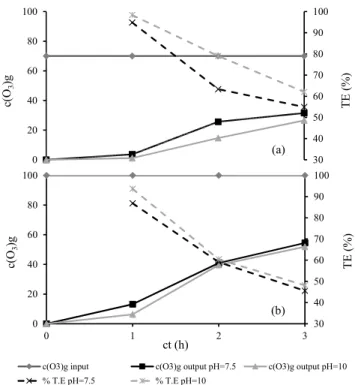
The effluent obtained using the selected opera-tional conditions for the UAFR was processed by ozonation. The aim of this post-treatment was to attain further reductions of the COD, color and tur-bidity. Figure 4 (a and b) presents the average results of ozonation at pH values of 7.5 and 10 and gas-ozone concentrations of 70 and 100 mgO3 L-1 for a contact time of 3 h.
0 20 40 60 80 100
0 1 2 3
re
duc
tio
n (
%
)
time (h)
COD pH 7.5 NTU pH 7.5 Color pH 7.5
COD pH 10 NTU pH 10 Color pH 10
(b) 0
20 40 60 80 100
re
duc
tion (
%
)
(a)
Reduction of the Chemical Oxygen Demand (COD)
Using an ozone concentration of 70 mgO3 L-1, the level of COD reduction of the digested effluent was slightly higher at pH 7.5 than at pH 10 after 3 hours of contact. However, when the ozone concentration was 100 mgO3 L-1, the level of COD reduction was slightly higher (8%) at pH 10 compared to the results obtained at pH 7.5. The latter result might be due to the organic compounds being mineralized at the basic pH, which would have strongly inhibited the reaction between hydroxyl radicals and organic ma-terials. Therefore, increased pH values did not favor high-level COD reduction (Peña et al., 2003). In the present study, the total alkalinity values were high (21.61 g L-1), and the COD level was reduced by 30% and 40% after 3 h of contact.
These results were superior to those obtained by Peña et al. (2003), who reported achieving 15% and 25% COD reduction when vinasse was treated using a combined anaerobic/aerobic process at a rate of 1.6 to 11.5 g O3 h-1.
Reduction of the Turbidity and Color Levels
The high levels of reduction of compounds that contributed to turbidity and color exhibited a similar behavior at both of the tested pH values of 7.5 and 10 at the lower ozone concentration evaluated. The color level was reduced by more than 90% due to the double-bonded chains of the phenolic and sugar-containing compounds, as well as those in the mela-noidins (color contributors), being strongly and rap-idly oxidized by ozone at a low level of ozone con-sumption (Rodriguez et al., 2008; Peña et al., 2003). When the ozone concentration was 100 mgO3 L-1, the best color reduction levels were obtained at pH 10, with 87% of the color removed during the first hour of ozonation.
The reduction in the turbidity level showed a simi-lar behavior at 70 mgO3 L-1 and pH values of 7.5 or 10. When the ozone concentration was 100 mgO3 L-1, the level of turbidity reduction was slightly greater, reaching approximately 90% between the first and second hours of ozonation at pH 10.
Peña et al. (2003) reported a color reduction rate of between 80% and 90% achieved during the first 30 min of ozonation at a rate of 3.7 g O3 h-1. In the present study, between 60 and 80% of the color was removed when ozone was applied at rates of 1.05 and 1.5 g h-1 during the first hour of contact. The differences might be attributed to the high COD of the digested effluent (12.45 gCOD L-1) and the lower
rate of ozonation applied in this study. Therefore, investigating the ozonation of effluents biologically treated in an anaerobic system with a higher COD-reduction efficiency is recommended to reduce the applied ozone dose and contact time.
Ozonation Efficiency
The transfer efficiency (TE) of the ozone dose applied and that consumed was evaluated. These doses were related to the ozone concentrations at the input and output of the ozonation reactor operating at a particular gas-flow rate, with a particular volume of residue to be treated and a particular contact time. Figure 5 (a and b) presents the increase in the ozone concentration at the output over time with respect to the ozone concentration at the input. The rate of ozone consumption was high during the first hour of ozonation due to the reaction of ozone with the easily oxidized organic compounds, which were the most prominent contributors to color and turbidity. The transfer efficiency during this period reached high values (87-98%) at both ozone concentrations and pH values. After this period, the TE decreased to an average of 52% due to the presence of a high salt content. These salts were not easily degraded or oxidized in the ozone reactor during the tested contact period.
30 40 50 60 70 80 90 100
0 20 40 60 80 100
0 1 2 3
TE (
%
)
c(
O3
)g
ct (h)
c(O3)g input c(O3)g output pH=7.5 c(O3)g output pH=10 % T.E pH=7.5 % T.E pH=10
(b)
30 40 50 60 70 80 90 100
0 20 40 60 80 100
TE
(%)
c(
O3
)g
(a)
Best Conditions for Ozone Treatment
Based on the results of the statistical analysis, the contact time had a significantly positive effect on COD reduction as well as on color and turbidity reduction. Additionally, the ozone concentration had a positive effect on color and turbidity reduction. Table 5 summarizes the results of the multiple-range tests. X denotes the variables that had a significant effect on the reduction of various factors. As shown, the ozone concentration (c(O3)g) had a significant effect on color and turbidity reduction, which was due to the larger amount of oxidant being available to react with the organic compounds in the vinasse effluents. Therefore, ozonation should be conducted at 100 mgO3 L-1.
Table 5: Summary of the results of the multiple-range tests.
Variable % COD
red
% Color
red
% Turbidity
red C(O3)g (mgO3 L
-1
) - X X
pH - - -
tc. (1-3) h X X X
Because the pH value did not significantly affect the reduction rates, it was preferable to conduct ozo-nation at the pH value of the anaerobically processed effluent (pH 7.5). This criterion is in agreement with the recommendation of Peña et al. (2003). A longer contact time was also recommended to increase the rate of nutrient degradation and the amount of salts that could be recovered for use in future processes.
The statistical modeling equations that described the reduction in the COD, color and turbidity were as follows:
2
COD 10.76 8.10 * tc
R 87.5%
( )
= +
=
3
3( (g)
g)
2
Color 26.60 1.03* CO
37.95* tc – 0.31* CO * tc
(R 84.3%)
= − +
+ =
3(g)
3(g)
2
Turbidity 28.04 1.01* CO
37.12 * tc – 0.30 * CO * tc
(R 85.2%)
= − +
+ =
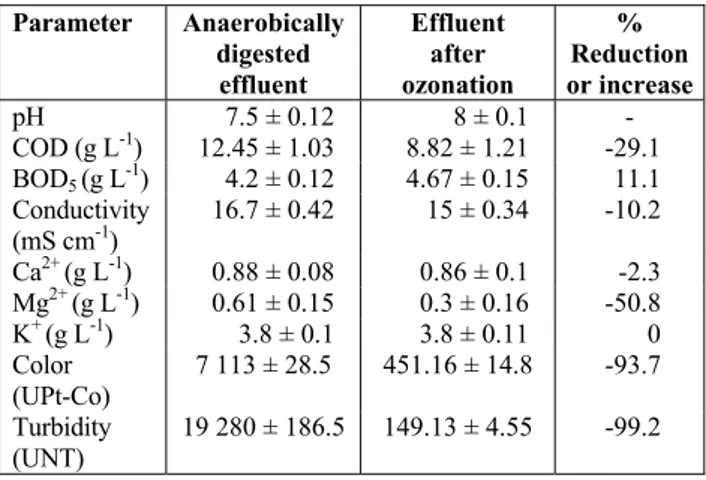
Results for the Combination of Anaerobic Diges-tion and OzonaDiges-tion Process
The digested effluent was subjected to the ozona-tion process using the best operaozona-tional condiozona-tions obtained via the anaerobic digestion process. This effluent was treated under the conditions of c(O3)g = 100 mgO3 L-1, tc = 3 h and pH = 7.5. The results ob-tained are shown in Table 6. The ozonation treatment increased the biodegradability (BOD5/COD) of the effluent from 0.34 to 0.53. This increase might be due to the organic matter having been solubilized to a degree that was previously unattained. Regarding the COD reduction, the efficiencies are close to 30%, similar to the efficiency reported by Rodriguez et al.
(2008). These authors noted that less than 50% of the COD had been removed after the ozonation process was completed due to the presence of ozone-resistant compounds in the residual material, as well as the presence of carbonates and bicarbonates that cause the decomposition of hydroxyl radicals.
Table 6: Characteristics of the anaerobically di-gested effluent before and after ozonation treat-ment.
Parameter Anaerobically digested
effluent
Effluent after ozonation
% Reduction or increase
pH 7.5 ± 0.12 8 ± 0.1 -
COD (g L-1) 12.45 ± 1.03 8.82 ± 1.21 -29.1 BOD5 (g L
-1
) 4.2 ± 0.12 4.67 ± 0.15 11.1
Conductivity (mS cm-1)
16.7 ± 0.42 15 ± 0.34 -10.2
Ca2+ (g L-1) 0.88 ± 0.08 0.86 ± 0.1 -2.3 Mg2+ (g L-1) 0.61 ± 0.15 0.3 ± 0.16 -50.8
K+ (g L-1) 3.8 ± 0.1 3.8 ± 0.11 0
Color (UPt-Co)
7 113 ± 28.5 451.16 ± 14.8 -93.7
Turbidity (UNT)
19 280 ± 186.5 149.13 ± 4.55 -99.2
The concentrations of compounds such as potas-sium salts were unaffected by the ozonation process; these elements are highly valuable for conducting future recovery processes and for agricultural use. The magnesium and calcium concentrations were decreased by the ozonation process, which increased the pH of the treated material slightly due to the re-duction of Ca2+ and Mg2+ to Ca and Mg, respectively. It might be due to a precipitation process of car-bonates if the constant for the product of solubiliza-tion was exceeded during the ozonasolubiliza-tion procedure.
The results of this study confirmed the efficacy of utilizing a combined process with anaerobic-diges-tion and ozonaanaerobic-diges-tion as the final step of raw vinasse treatment. The combination of UAFR treatment and ozonation of raw vinasse was appropriate for attain-ing reductions of 82.4, 81.4, 93.8 and 99.3% in the COD, BOD5, color and turbidity levels, respectively. The use of this combination might improve the final disposal of treated vinasse and the quality of soils, groundwater and bodies of waters.
CONCLUSIONS
This study showed that it was feasible to treat raw vinasse biologically using an UAFR at 10 kgCOD m-3d-1 and a HRT of 5 days. Under these conditions, the methane yield was 0.315 m3CH4 kgCODr-1, with 75.1% COD reduction and 82.6% BOD5 reduction achieved. The digested effluent was post-treated by ozonation using the best conditions of 100 mgO3 L-1 for the ozone concentration and a contact period of 3 h. This ozonation process resulted in a 29.1, 93.7 and 99.2% reduction in the COD, color and turbidity of the effluent, respectively, indicating that this procedure was appropriate for the final disposal of digested vinasse effluents. This study demonstrated that the pH value did not significantly affect the re-duction of the COD, color or turbidity, which recom-mends conducting the ozonation procedure at the same pH as that of the digested effluent. The results of this study proved that the combination of UAFR treatment and ozonation of raw vinasse was appro-priate for attaining reductions of COD, BOD5, color and turbidity levels for a better final disposal of vi-nasse in different receptors.
ACKNOWLEDGEMENT
This research study was supported by CAPES/ MES Project 117/11.
REFERENCES
Acharya, B. K., Mohana, S. and Madamwar, D., Anaerobic treatment of distillery spent wash – A study on upflow anaerobic fixed film bioreactor. Bioresource Technology, 99, 4621- 4626. (2008). Ahn, D. H., Chang, W. S. and Yoon, T. I., Dyestuff
wastewater treatment using chemical oxidation, physical adsorption and fixed bed biofilm pro-cess. Process Biochemical, 34, 429-439 (1999).
APHA, AWWA, WEF, Standard Methods for Exami-nation of Water and Wastewater, 21st Ed., Ameri-can Public Health Association/AmeriAmeri-can Water Works Association/Water Environment Federa-tion, Washington DC, USA (2005).
Beltrán, F., Encinar, J. and González, J., Industrial wastewater advanced oxidation. Part 2. Ozone combined with hydrogen peroxide or UV radia-tion. Wat. Res., 31(10), 2415-2428 (1997).
Benítez, F. J., Real, F. J., Acero, J. L., Garcia, L. and Sánchez, M., Kinetics of the ozonation and aero-bic biodegradation of wine vinasse in discontinu-ous and continudiscontinu-ous processes. Journal of Hazard-ous Materials, B101, 203-221 (2003).
Biswas, A. K., Mohanty, M., Hati, K. M. and Misra, A. K., Distillery effluents effect on soil organic carbon and aggregate stability of a Vertisol in In-dia. Soil & Tillage Research, 104, 241-246 (2009). Bories, A. and Raynal, J., Anaerobic digestion of
high-strength distillery wastewater (Cane molas-ses stillage) in a fixed-film reactor. Biological Wastes, 23, 251-267 (1988).
Cabrera, A. D. and Díaz, M. A. M., Tratamiento de vinaza cubana en un reactor anaerobio empacado de flujo ascendente. Revista de Ingeniería Hidráu-lica y Ambiental. XXXIV (2) 41- 49 (2013). (In Spanish).
Chen, Y., Cheng, J. J. and Creamer, K. S., Inhibition of anaerobic digestion process: A review. Biore-source Technology, 99, 4044-4064 (2008).
España, E., Mijangos, J., Barahona, L., Domíguez, J., Hernández, G. and Alzate, L., Review: Vi-nasse: Characterization and treatments. Waste Management & Research, 29, 1235-1250 (2011). Figaro, S., Avril, J. P., Brouers, F., Ouensanga, A.
and Gaspard, S., Adsorption studies of molasse’s wastewaters on activated carbon: Modelling with a new fractal kinetic equation and evaluation of kinetic models. Journal of Hazardous Materials, 161, 649- 656 (2009).
Fuess, L. T. and Garcia, M., Review. Implications of stillage land disposal: A critical review on the im-pacts of fertigation. Journal of Environmental Management, 145, 210 -229 (2014).
Hati, K. M., Biswas, A. K., Bandyopadhyay, K. K. and Misra, A. K., Soil properties and crop yields on a vertisol in India with application of distillery effluent. Soil & Tillage Research, 92, 60-68 (2007).
Inanc, B., Ciner, F. and Ozturk, I., Color removal from fermentation industry effluents. Wat. Sci. Tech., 40(1), 331-338 (1999).
distillery effluent irrigation on groundwater qual-ity. Environmental Monitoring and Assessment, 110, 243-255 (2005).
Kumar, S. K., Anaerobic Biotechnology for Bioen-ergy Production: Principles and Applications. A John Wiley & Sons Ltd., Publication, Inc., USA (2008).
Kumar, S., Sahay, S. S. and Sinha, M. K., Bioassay of distillery effluent on Common Guppy, Lebistes reticulates (Peter), Bull. Environ. Contam. Toxi-col., 54, 309-316 (1995).
Lossie, U. and Pütz, P., Targeted control of biogas plants with the help of FOS/TAC. Practice Re-port, Germany (2008).
Lyra, M. R. C. C., Rolim, M. M. and da Silva J. A. A., Toposseqüência de solos fertigados com vin-haça: Contribuição para a qualidade das águas do lençol freático. Toposequence of soils fertigated with stillage: Contribution towards the quality of ground water table. Revista Brasileira de Engen-haria Agrícola e Ambiental, 7(3) 525-532 (2003). (In Portuguese).
McCarty, P. L., Anaerobic Waste Treatment Funda-mentals. Part Two. Environmental Requirements and Control, Public Works for October 123-126 (1964).
Mohana, S., Acharya, B. K. and Madamwar, D., Distillery spent wash: Treatment technologies and potential applications. Journal of Hazardous Ma-terials, 163, 12-25 (2009).
Moraes, B. S., Junqueira, T. L., Pavanello, L. G., Cavalett, O., Mantelatto, P. E., Bonomi, A. and Zaiat, M., Anaerobic digestion of vinasse from sugarcane biorefineries in Brazil from energy, en-vironmental, and economic perspectives: Profit or expense? Applied Energy, 113, 825-835 (2014). Peña, M., Coca, M., González, G., Rioja, R. and
Gar-cía, M. T., Chemical oxidation of wastewater from molasses fermentation with ozone. Chemo-sphere, 51, 893-900 (2003).
Rajagopal, R., Mehrotra, I., Kumar, P. and Torrijos, M., Evaluation of a hybrid upflow anaerobic sludge-filter bed reactor: Effect of the proportion of packing medium on performance. Water Science
& Technology, 61(6), 1441- 1450 (2010). Ramakritinan, C. M., Kumaraguru, A. K.,
Balasubra-manian, M. P., Impact of distillery effluent on car-bohydrate metabolism of freshwater fish, Cypri-nus carpio. Ecotoxicology, 14, 693-707 (2005). Rivera, A., González, J. S., Castro, R., Guerrero, B.
and Nieves, G., Tratamiento de efluentes de des-tilería en un filtro anaerobio de flujo ascendente. Rev. Int. Contaminación Ambiental, 18(3) 131-137 (2002). (In Spanish).
Rodriguez, T., Botelho, D. and Cleto, E., Tratamiento de efluentes industriales de naturaleza recalci-trante usando ozono, peróxido de hidrógeno y ra-diación ultravioleta. Rev. Fac. Ing-Univ. An-tioquia, 46, 24-38 (2008). (In Spanish).
Sangave, P. C., Gogate, P. R., Pandit, A. B., Combi-nation of ozoCombi-nation with conventional aerobic oxi-dation for distillery wastewater treatment. Chemo-sphere, 68, 32-41 (2007).
Satyawali, Y. and Balakrishnan, M., Removal of color from biomethanated distillery spentwash by treatment with activated carbons. Bioresource Technology, 98, 2629-2635 (2007).
Siles, J. A., García-García, I., Martín, A., Martín, M. A., Integrated ozonation and biomethanization treatments of vinasse derived from ethanol manu-facturing. Journal of Hazardous Materials, 188, 247-253 (2011).
Subha, B. and Muthukumar, M., Optimization of ozonation process for the reduction of excess sludge production from activated sludge process of sago industry wastewater using central compo-site design. The Scientific World Journal, 2012, 1-7 (2012).
Martins, S. I. F. S. and van Boekel, M. A. J. S., A kinetic model for the glucose/glycine Maillard re-action pathways. Food Chemistry, 90(1), 257-269 (2005).