Variation analysis efects of square and rectangular
columns section with diferent longitudinal
reinforcement rates in the main reinforcement two pile
caps analysis
Análise dos efeitos da variação da seção de pilares
quadrados e retangulares com diferentes taxas de
armadura longitudinal na armadura principal de tração de
blocos sobre duas estacas
Abstract
Resumo
The pile-cap structural elements are used as a transition between the columns of buildings and foundations. The most appropriate method for the pile caps design is the Strut and Tie model. In most cases in the structural project is not considered the inluence of certain parameters: the col -umns cross section and the amount of longitudinal reinforcement col-umns. This paper studies the efect of the variability of the geometric section of square and rectangular columns, with diferent longitudinal reinforcement rates, in the main reinforcement traction two pile caps. The basis for study was development experimental program in the Structures Laboratory of EESC-USP. The traction reinforcement bars strains are reduced the pile-caps central section to pile-caps sections that approximate cutting axis shows the experimental results. In models with columns of elongated rectangular section and with great reinforcement rates this reduction is smaller.
Keywords: pile caps, reinforced concrete, foundations, method of strut and tie.
Os blocos sobre estacas são elementos estruturais utilizados para transição entre os pilares de edifícios e as fundações em estacas ou tubulões. O método das Bielas e Tirantes é recomendado para o projeto de blocos rígidos sobre estacas, mas, não considera a inluência de parâmetros no comportamento do bloco, tais como: a forma da seção transversal e a área das barras da armadura longitudinal dos pilares. Este artigo tem o obje -tivo de estudar a inluência da variação da seção de pilares quadrados e retangulares, com diferentes taxas de armadura longitudinal, na armadura principal de tração de blocos rígidos de concreto sobre duas estacas. Para isso foi desenvolvido um programa experimental em que doze modelos reduzidos de blocos sobre duas estacas foram construídos e ensaiados no Laboratório de Estruturas da EESC-USP. Os resultados experimentais demonstraram que as deformações nas barras de armaduras do tirante são reduzidas da seção central do bloco para as seções que se aproximam do eixo da estaca. Esta redução é menor em modelos com pilares de seção retangular alongada e com grandes taxas de armadura.
Palavras-chave: concreto armado, blocos sobre estacas, fundações, modelo de bielas e tirantes.
a Centro Paula Souza, FATEC, Faculdadede Tecnologia de Jahu, Jaú, SP, Brasil;
b Universidade de São Paulo, Escola de Engenharia de São Carlos, Departamento de Engenharia de Estruturas, São Carlos, SP, Brasil.
F. S. MUNHOZ a [email protected]
1. Introduction
The pile caps “are volume structures used to transmit foundation forc -es for the pil-es” is deined by the NBR 6118: 2014 [1]. The pile caps in Brazil are widely used as the foundation of buildings, and must re -ceive special attention, as when in operation, the inspection is diicult. The behavior of pile caps is deined as rigid or lexible. The rigids pile caps behavior is deined by work will bending in both direc -tions, working shear in both directions and forces transmitted to column essentially compression struts. Strut and tie method as the best model to pile caps design.
In Brazil, the most common method for pile caps design is is based on research Blévot & Frémy [2]. These authors recommend an ap -plication of the Strut and tie model based on experimental models tested by them. The method Blévot and Frémy [2] is recommended for forces centered on the columns and all piles need to be equally spaced from tthe centre column. This method can also be used for non centered forces from assuming that all piles remain subject to the most active force. The initial idea of the method is designed for columns of square section and centered forces.
There are variations of the geometric parameters of the comuns in the structural designs pile caps, the cross sections may be square, rectangular or circular, that changes the scheme to be adopted and the nodal region to be checked. The pile caps may be subjected to diferent types of actions: vertical loads, mom For a given pile cap, there may be many models of trusses representing ields statically balanced and plastically permissible stresses..ents and horizontal loads, and this can also change the truss model to be considered. Research have been seeking to study the various factors that can inluence the strut and tie model applied to pile caps. There are questions about inluence area and the shape of the section of the column: which model can be used in the design pile caps that receive columns sections composed of several rectangles? which the association model various columns on the same pile caps? There are few studies that show the inluence of diferent types of foundation piles in the adopted calculation model.
This paper aimed to study the inluence of the column section with diferent rates of longitudinal reinforcement in the ties rigid two pile caps reinforcement.
The research proposal led to the perception that the design of pile caps with rectangular columns is not equal to considered for square columns. According to Fusco [3] when there are diferent reinforcement ratios in columns force is transmitted for the pile caps at diferent heights, which can change the height of the truss (analysis subject in the diferent methods) changing forces in the tensile reinforcement bars. In this research was chosen do an ex-perimental analysis of models with diferent sections of columns and diferent reinforcement ratios, were not found in literature stud -ies with pile caps which varied these parameters.
2. The pile caps design
2.1 Analytical methods
The method based on research and Blévot Frémy [2] applies to rigid pile caps with forces centered on the columns and all equally spaced piles of the column center.
The tests performed by Blévot & Frémy [2] pile caps were analyzed containing two, three and four piles, for ive pile caps adapted to formulation existing for the model with four piles. This method is limited to these models.
Blévot & Frémy [2] method is based on hypotheses that difer from Strut and Tie method. The method does not deine the nodal re -gions and tensions that need to be checked. This method makes a check of the compressive stress in the struts, not the nodal re -gions as suggested by the model strut and tie. Blévot & Frémy [2] method does not deine dimensions strut and tie is therefore similar to a truss model.
A procedure also used by some designers structures is the method suggested by the CEB-FIP [4]. This routine design is applied to pile caps with a distance between the faces of the column to the axis of the furthest pile varying between one third and half the pile cap height. The method suggests a calculated bending consider-ing an internal reference section relative to the face of the column, and measured distance of 0.15 from the side of the column in the considered direction. For veriication of the resistance capacity of shear force, is deined the distant external reference section of the face of the column of a length equal to half the pile cap height. In case of surrounding the column piles, which are distant less than half the pile cap height, the section considered coincides with the face of the column.
The two main methods are based on diferent assumptions. The Blév -ot & Frémy [2] method adopts a model truss and checks compressive stresses considering the sections of the column and the piles pro-jected in the direction perpendicular to the axis of the strut; CEB-FIP [4] method indicates safety checks to normal and shear stresses with the internal forces determined in particular cross sections.
The present study been used Fusco [3] recommendations for the design of experimental models. Fusco [3] suggests Strut and Tie method for the design of pile caps, the author adopts particular characteristics in the analytical model. In verifying the security of struts compressed, the author considers that the stress acting on the column decreases along a height (x) in block, this height is inluenced by the section of the column (square or rectangular) and the longitudinal reinforcement ratio of the column. Fusco [3] concludes that the diagonal struts are formed from this horizontal section at a depth x where the active stress on the column can be considered smaller because the collaboration of reinforcement column. With these deductions it is concluded that the struts incli-nation is reduced, the resultant force inluencing tie force.
The anchoring of traction reinforcement bars is also an important factor in the pile caps design. Some authors recommend proce-dures that may consider reductions in these lengths. This anchor -age length in the pile caps can be measured from the plane con-taining the of the pile center or plane tangential the pile the block and the internal. In this research the experimental results allowed the discussion of anchoring the reinforcement of pile caps.
2.2 Normative instructions
The Brazilian standard NBR 6118: 2007 [5] classiies the structural behavior of pile caps as: rigid and lexible. For rigid pile caps the structural model adopted for design can be three-dimensional, lin-ear or non-linlin-ear models and three-dimensional Strut and tie mod-el, which are preferred by better deine the distribution of forces. The NBR 6118: 2007 [5] does not provide in its text a script for checks and design.
The latest Brazilian standard NBR 6118: 2014 [1] has chapter deal -ing about struts and tie models, as well as other international stan-dards. In this chapter are recommended parameters resistance limits of nodal regions for strut and tie models.
EHE [6] recommendation is used for each case of pile caps, a diferent strut and tie model. The standard suggests dimensioning equations for the primary and secondary reinforcement of the most common pile caps models. According to the Spanish standard to check the resistance of nodes usually is not necessary if the piles are molded in place and that the columns and the piles have com -pression strength of concrete equal to the pile caps. Other cases need the checks in the nodal regions. For pile caps considered lexible to EHE [6] recommends the time to calculate bending in critical section, these criteria are similar to CEB-FIP [4] method. When the distance between piles is greater than twice the pile caps height are the American code-ACI 318-08 [7] veriication is recom -mended to checking bending. For cases of pile caps in which the ratio of the distance between the piles is less than twice the pile caps height is used strut and tie models according to the recom-mendations of Appendix A ACI 318-08-code [7]. This appendix was included in the American standard since 2002 and presents a gen-eral procedure for elements of design using strut and tie a model, such as limits for stresses in the struts and nodal regions and mini-mum values of the inclination struts.
This section can be ended that most of the standards does not
have oriented models or scripts for the design, except for the EHE [6], which provides models for the most common cases, and sug -gests consideration of models for particular cases.
2.3 Recent research with emphasis on pile caps
design criteria conducted in Brazil
In the 70s and 80s, in Brazil, there was little research on the sub-ject, but from the 90s began to emerge some work.
Miguel [8] conducted numerical and experimental analysis in order to study the behavior of rigid three pile caps. It´s important to use the same main reinforcement positioned on piles and varied areas , in the tested models. In order to study the development of cracks and failure modes it´s possible to reinforcement that. The models tested by the researcher broke by splitting the compressed strut, and after reached yield strength of steel. The author concludes that the Blévot and Frémy [2] method provides conservative re -sults as all experimental models reached ultimate load greater than those estimated by the theoretical model.
Souza [9] investigated methods Finite Element Method and Stringer-Panel Method. The main elements that the author stud -ied were the deep beams and pile caps. This concrete elements wasn´t considered the Bernoulli hypothesis. The author pro -poses to establish variation limits for cracking strength and ulti -mate strength, especially when you have no experimental data. According to the author, a linear analysis can lead to building a model, and nonlinear analysis provides answers the service elements. Comparing numerical results and analytical Souza [9] found a diference of 20% in the results of ultimate strength. The author also observes that the analytical model limiting the stress equal to 1.4 fck is conservative. In general, the researcher found that for complex structures, such as pile caps, an alternative de
-Table 1
Measures of columns, pile caps and piles and longitudinal reinforcement ratio
Concrete Pile caps
Series Models Cross section
sign is to use in conjunction Strut and tie a Method and Finite Element Method. It also concludes that Strut and tie a Method is safe for the design of rigid pile caps.
Delalibera [10] conducted experimental and numerical analysis of two pile caps models. The researchers tested 14 models in real scale. In models tested researcher varies reinforcement arrange -ments, pile caps height, the sections of the columns and the posi-tion of applicaposi-tion of compressive strength. The models tested by Delalibera [10] broke by splitting the compressed strut. The rupture of the concrete (the strut) occurred near the column, and in some cases close to pile, formed a break-up along the pile caps height caused by shear strength. Delalibera [10] proposed models strut and tie for case studies based on the results obtained by means of experimental and numerical analysis.
Buttignol [11] conducted numerical analysis with two and three pile caps. The researcher made a comparison of numerical results and experimental results of other authors observed parameters such as stifness, low stresses, plastic deformation, type of failure and bearing capacity. The researcher made some changes in the mod -els to check variations in the low stress and the reinforcement. Analyzing the results obtained Buttignol [11] reached some impor -tant conclusions: numerical models showed similar results to the experimental. The numerical model was more rigid than the ex-perimental, n three pile caps was failure by breaking the concrete, splitting the compressed strut and after reached yield strength of steel, in two and three pile caps of the tensile reinforcement an-choring hooks had small stresses, Strut and tie a Method is safe for the design of pile caps.
In this section it was found that the research has advanced in Bra -zil contributing to the design criteria for pile caps.
3. Experimental program and materials
This section describes the design, construction of models and description of the tests performed An analysis of the steel and concrete materials was done previously. Subsequently they were designed, constructed and tested twelve models of two pile caps in 1: 2. The models were built without the side laps for better understanding of the deformations in the concrete face. This stage was conducted in the Structures Laboratory of the Department of Structural Engineering School of Engineering of São Carlos - USP.
3.1 Design of experimental models
The initial idea was to study pile caps in the case of columns with diferent areas of cross sections. With the literature review noted that there were no experimental studies that considered the column reinforcement ratio with the transmission of forces on the pile caps and the inluence of these factors on the main reinforcement (ties) of the pile caps. experimental models were adopted with the sections of the columns: 12.5 cm x 12.5 cm, 12.5 cm x 25.0 cm, 12.5 cm x 37.5 cm and 12.5 cm x 50.0 cm . The reinforcement of the columns rates were 1%, 2.5% and 4%, totaling 12 diferent types of columns. They were adopted the same height for all pile caps and the same angle of inclina-tion of the compressed struts. The design of the scale models was made from measurements in real size considering the geo-mérica scale 1: 2.
The models were divided into four diferent series. The terminator used was based on the distance between the axes of the piles
Figure 1
(this distance is varied to maintain the same angle of inclination), the extent of the column section in the axis direction that contains piles, and the reinforcement adopted rates column. For example, the B110P125R1 model B110 refers to the block with a distance of 1.10 m between axes piles P125 column with edge of 12.5 cm and R1 refers to reinforcement ratio of 1%. The main measures of the models are shown in Table 1.
All columns were constructed of 35 cm, the blocks were 40 cm and piles 40 cm. For all piles was adopted a square cross section of 12.5 cm x 12.5 cm. Figure 1 also shows the main dimensions of the pile caps models.
For the design of the pile caps and columns adopted the character -istic compressive strength of concrete (fck) of 25 MPa for piles were considered fck = 50 MPa and the steel bars were CA-50 category (fyk = 500 MPa ). In experimental models were not adopted safety factors in the design of the columns and blocks, they were only considered in the design of the piles. The justiication for adoption
of these parameters is possible that during the test did not occur premature failure of the piles.
For the design of the models they used the method of Blévot & Frémy [2] the recommendations of NBR 6118: 2007 [5] and Fusco [3]. A summary of calculated reinforcement is shown in Table 2. To calculate the anchoring of strut reinforcement bars adopted the procedure proposed by Burke [12]. The favorable efect of com -pression of struts was found by increasing the a adhesion strength. The pile axis had considered by the anchor bars star point (perpen -dicular to the pile caps).
3.2 Construction of models
The irst step of building was the assembly of the wooden mold laminated 15mm thick. Following analyzes were made of the ma -terials used, concrete and steel.
Previously discussed in the construction of models were used
Table 2
Summary of reinforcement of experimental models
Columns Pile caps Piles
Series Models Longitudinal reinforcement
Steel stirrups
Tie reinforcement
Steel stirrups
Longitudinal reinforcement
Steel stirrups
CC1 B110P125R1 4ɸ8,0 ɸ5,0 c/2cm
4ɸ12,5 ɸ6,3
c/10cm 4ɸ10,0
ɸ5,0 c/4cm
CC0 B110P125R25 4ɸ12,5 (strapping)
CA1N B110P125R4 4ɸ16,0 ɸ5,0 c/4cm
CA0N B115P250R1 6ɸ8,0 ɸ5,0 c/2cm
4ɸ12,5 ɸ6,3
c/10cm 4ɸ10,0
ɸ5,0 c/4cm
CA1R B115P250R25 8ɸ12,5 (strapping)
CA0R B115P250R4 8ɸ16,0 ɸ5,0 c/4cm
CC1 B120P375R1 10ɸ8,0 ɸ5,0 c/2cm
6ɸ12,5 ɸ6,3
c/10cm 4ɸ10,0
ɸ5,0 c/4cm
CC0 B120P375R25 10ɸ12,5 (f strapping)
CA1N B120P375R4 10ɸ16,0 ɸ5,0 c/4cm
CA0N B127P500R1 14ɸ8,0 ɸ5,0 c/2cm
5ɸ16,0 ɸ6,3
c/10cm 4ɸ16,0
ɸ5,0 c/4cm
CA1R B127P500R25 14ɸ12,5 (strapping)
CA0R B127P500R4 14ɸ16,0 ɸ5,0 c/4cm
Figure 2
Initial stages of construction of experimental models
diferent concrete compressive strength. For pile caps and col -umns was used ready-mix concrete with compressive strength of 50 of 25 MPa. For piles the characteristic concrete with compres -sive strength of 50 Mpa. Had been done it is little concrete of the piles was done in the Structures Laboratory of EESC-USP. They were used for reinforcement CA-50 steel bars with nominal diam-eters of 6.3 mm, 8.0 mm, 10.0 mm, 12.5 mm and 16.0 mm, CA-60 steel diameter 5.0 mm The reinforcement strain were measured with the use of strain gages placed in the tensile reinforcement pile caps, prior to the concreting of the models.
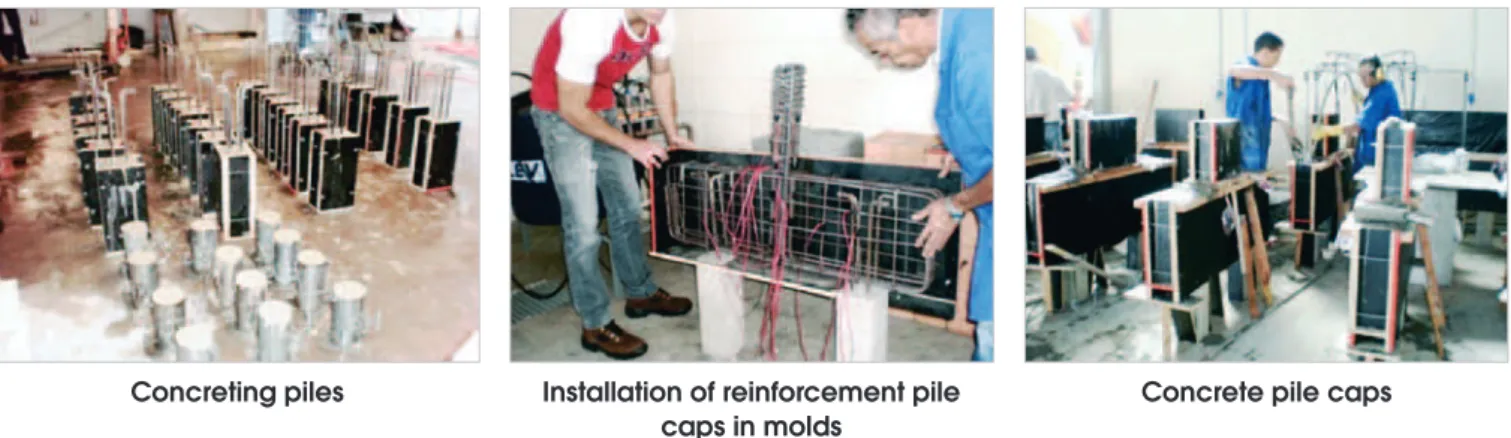
Figure 2 shows the initial stages of construction of the models. The concreting of the pile caps models was done in two stages. First, they were concreted piles and then the pile caps and col -umns. Figure 3 shows the inal steps in the construction of experi -mental model.
3.3 Equipment, instruments and materials
for testing
The Structures Laboratory of EESC-USP performed the tests. The main equipment used was the Instron 8506 machine with a nomi-nal capacity of 2500 kN force, the possibility of using this machine was given by to rehearse models reduced in scale 1: 2. For data acquisition, system used a computer System 500. Figure 4 shows details of the equipment.
They were also used two load cells with 2000 kN capacity for ac -tion of forces in the piles. For measurements of the displacements at the base and sides of the models were used ive displacement transducers. Autotest-2000 machine has been used to test speci-mens for analysis of materials.
Figure 3
Stages of construction of experimental models
Concreting piles Installation of reinforcement pile
caps in molds Concrete pile caps
Figure 4
Equipment for testing
Instron 8506
4. Results presentation
The experimental results sought to assess the form of failure the analyzed pile caps and the inluence of variations in measure -ments of the long sides and longitudinal reinforcement rates of the columns in deformation of the main reinforcement bars of traction pile caps. Additional data can be obtained in Munhoz [13].
4.1 Description of tests
The models were tested with equipment that applies force on the upper surface of the column via a piston controlled by displace -ment. The piston displacement speed was 0,002 mm/s. Models had similar behavior in the tests. The cracks coniguration had similar developments in all models. The irst cracks appeared at the bottom of the pile caps, with an increase of forces appeared inclined cracks in the lateral face of the pile caps in the column direction and pile, inclined cracks evolved in length and opening until failure models. Figures 5 and 6 show the evolution of cracking had been tested in models.
In all models after failure observed arcing, outlining the path of low
of compressive stresses. Cracking did not occur in the regions lo -cated at the top edges and corners. In models of B127 series it was observed that in the region below the column an integral region without formation of cracks.
4.2 Open cracks and failure strengths analysis
In tests the forces that caused the irst cracks were been recorded. monitoring of the cracks openings was made.
The openings of the cracks in the tested models blocks have val -ues between 0.5 mm and 0.8 mm, considering the inal stage of force. NBR 6118: 2007 [5] predicts 0.40 mm openings limits, struc -ture in service, with the purpose of reinforcement corrosion protec -tion. In this research reinforcement cover were lower than recom -mended by the standard. Importantly, maximum values presented are the structure failure.
Important data with respect to the openings of the cracks is the index that indicates the percentage of strength in that the irst crack occurred (Fr) compared the failure strength (Fu) . These data are shown in Table 3.
It is possible to analyze in Table 3 B110 models series with
Figure 5
Evolution of cracks in models of two pile caps
Initial cracks visible in the lower part of the block
quadradadas columns presented irst cracking later. other models showed irst cracking with values between 20% and 27% of the failure strength.
Theoretical ultimate loads were calculated using the method of Blévot & Frémy [2], irst utilizandos expressions 1 (limit strength in the upper nodal zone) and 2 (limit strength in the inferior nodal
Figure 6
Configuration of cracking in the tested models
Propagation inclined cracks
Opening inclined cracks (failure models)
Table 3
Failure Strength x Strength causes first crack
Series Models Fu (kN) Fr (kN) Fr / Fu (%)
B110
B110P125R1 431,11 225,00 52,2
B110P125R25 577,08 198,00 34,3
B110P125R4 590,73 240,00 40,6
B115
B115P250R1 712,67 158,00 22,2
B115P250R25 736,02 148,00 20,1
B115P250R4 763,64 154,00 20,2
B120
B120P375R1 850,78 235,00 27,6
B120P375R25 807,13 198,00 24,5
B120P375R4 924,26 201,00 21,7
B127
B127P500R1 1028,30 276,00 26,8
B127P500R25 979,88 247,00 25,2
zone) the equaling stresses in struts along the column and piles.
(1)
(2)
where:
Ap – Column cross-sectional area; Ae – Pile cross-sectional area; Fteo,e – Normal force from the pile;
Fteo,p – Normal force from the column;
,
zn s
σ
– strength in the upper nodal zone;,
zn i
σ
– strength in the inferior nodal zone.Theoretical ultimate loads by using the expressions (1) and (2) were been calculated initially, it is expected characteristic of the concrete compressive strength of 25 MPa. The mean compressive strength of concrete was 33.85 MPa, used in models of pile caps, considering that it should multiply by 0.9 so that there is equiva -lence between specimen and structure, is estimated to average strength of concrete compression equal to 30.47 MPa. Whereas the theoretical ultimate load should be smaller force between the
Table 4
Experimental and theoretical strength
Series Models Fu,exp Fu,teo Fu,teo / Fu,exp
B110
B110P125R1 431,11 299,67 0,70
B110P125R25 577,08 299,67 0,52
B110P125R4 590,73 299,67 0,51
B115
B115P250R1 712,67 609,73 0,86
B115P250R25 736,02 609,73 0,83
B115P250R4 763,64 609,73 0,80
B120
B120P375R1 850,78 620,23 0,73
B120P375R25 807,13 620,23 0,77
B120P375R4 924,26 620,23 0,67
B127
B127P500R1 1028,3 630,83 0,61
B127P500R25 979,88 630,83 0,64
B127P500R4 969,35 630,83 0,65
Figure 7
determined veriication criteria presented in Table 4 was made a comparative analysis between the experimental and theoretical ultimate strength.
Table 4 we analyzed models B110 series with the increase in rein -forcement rate in the columns was been increased in the ultimate experiment strength. In the series B115 and B120 the greatest ul-timate strength was achieved by models with higher reinforcement rates in columns, B115P250R4 and B120P375R4. Same analy -sis for series B127, the greatest ultimate strength occurred in the model with lower reinforcement rate, B127P500R1, this was due to the inluence of diferent reinforcement rates.
The B110 series were the models showed lower values of relation -ship Fu,teo / Fu,exp, except B110P125R1 model, which had prema -ture failure of the column. All models showed higher experimental strength than the theoretical strength.
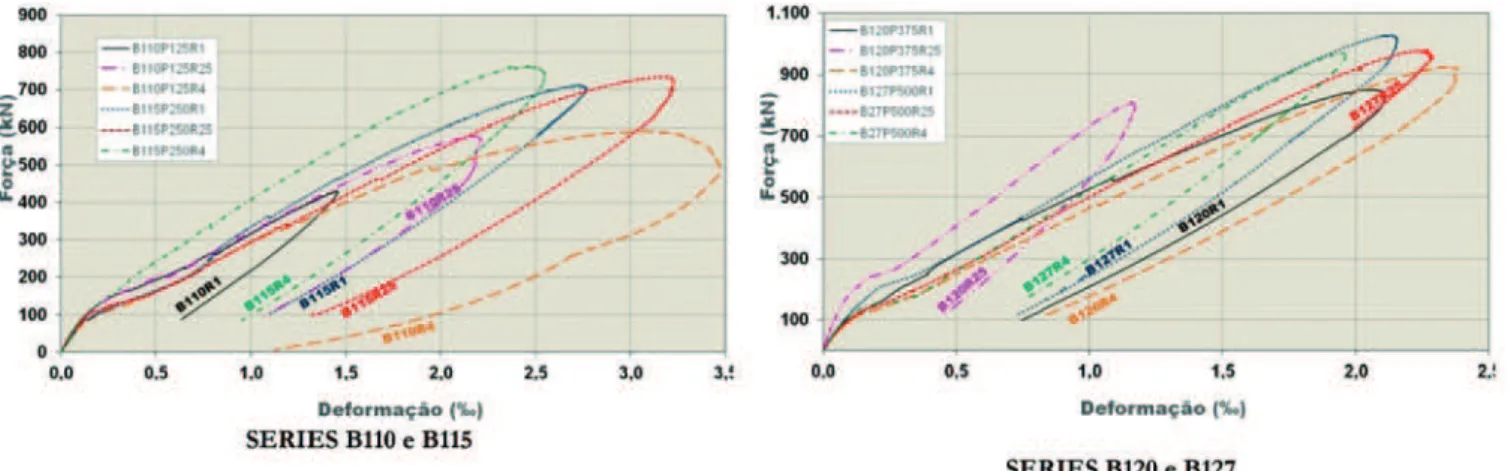
4.3 Strain measured on the bars of tie reinforcement
Two pile caps strain measured on the bars of tie reinforcement measured with strain gages. They were instrumented two bars, as shown in Figure 7, strain gages were bonded in the sections co -incident with the pile caps center (e2 and e4) and in the position that coincides with the axis of the pile (e1 and e3). Considering the symmetry instrument to one side of the pile caps.
The gages points chosen allowed the calculation of the stress in the tie reinforcement, enabling analysis of experimental and theo -retical results. The pile caps of the series B120 and B127 were designed with bar reinforcement in the second layer, had one of the second instrumented layer bars in the center position (e25). The gages 1, 2, 3 and 4 leased in the same position, but in difer -ent bars, showed similar performance can be considered that all
Figure 8
Mean measured strains in strain gages e2 and e4 (central position)
Table 5
Strain measured by strain gages x ultimate experimental strength
Models Ultimate experimental
strength (kN)
Strain measured e1 e e3 (‰)
Strain measured e2 e e4 (‰)
B110P125R1 431,11 0,55 1,45
B110P125R25 577,08 1,31 2,18
B110P125R4 590,73 1,28 3,10
B115P250R1 712,67 1,12 2,71
B115P250R25 736,02 1,30 3,19
B115P250R4 763,64 1,48 2,46
B120P375R1 850,78 0,96 2,06
B120P375R25 807,13 0,80 2,32
B120P375R4 924,26 1,13 2,32
B127P500R1 1028,30 0,29 2,13
B127P500R25 979,88 0,76 2,27
the bars had the same strain in equivalent positions. It was used mean strain between e1 and e3, e2 and e4 to make a comparative analysis of the models of the same series. The graphs of mean measured strains in strain gages e2 and e4 (central position) are shown in Figure 8.
The analysis means deformations in the center of the tie bars B110 models showed an increase in strain with increasing rate column reinforcement. The series B 115 most strain occurred on the pile caps with rate of 2.5% of the column reinforcement, B115P250R25. At B120 and B127 sets the values of strain measured in the cross section are similar in all, the increase in strain is not signiicant with increasing reinforcement ratio of the column. Table 5 shows the mean values of strain measured by strain gages related steps ultimate experimental strength
Table 5 shows the mean values of strain measured at the center of the strut reinforcement bars (e2 and e4) and sections contain-ing the axes of the piles (e1 and e3). The purpose of uscontain-ing these strain gages at the positions that coincide with the axes of the pile was verifying the bar is deformed along its length. In most designs had been observed that this strain has a value close to 1 ‰, and this value is smaller than the average strain value in the yield, but being a very non-zero value, which means that it has to provide for anchoring in hook these bars.
4.4 Force estimated the tie
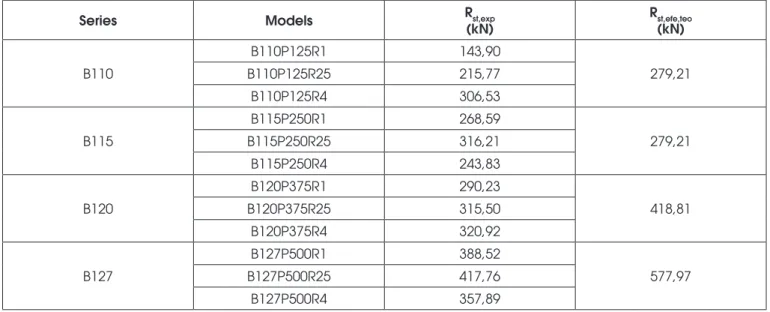
With the strain measured in strain gages, in the main tensile re-inforcement bars, it was possible to estimate the force in the tie (Rst,exp). Considering that all the reinforcement bars of the sec-tion are subject to the same stress (instrumented were two of the four bars) was made an average between the gages and calcu -lated the experimental force Rst,exp.
The values of the forces (Rst,exp) estimated with the deformations of the reinforcement bars, registered by the strain gages e2 and
e4 are shown in Table 6. For this calculation, we used the elastic modulus, obtained to the test of the reinforcement bars, the val -ues obtained were 198.02 GPa to 12.50 mm diameter bars (series B110, B115, B120); and 202.56 GPa to 16mm bars (B127). The values of the forces used in the project, are also shown in Table 6, the theoretical value of the project efective force (Rst,efe,teo) had been calculated for a medium compressive strength of concrete 30.47 MPa, and medium strength yield of steel bars 558.41 MPa. As shown in Table 6, the values of experimental forces on the tiés are changed with the variation rates of reinforcement in columns. Making a comparative analysis between the experimental forces estimated with the bars strains and the theoretical efective force calculated by method Blévot and Frémy [2], the models of the B110 series only B110P125R4 model showed greater strength than the theoretical. For models of the B115 series, only the B115P250R25 model had the tie experimental force than theoretical. In the B120 and B127 series experimental values in all models were lower.
4.5 Strength parameters determined
experimentally for inferior nodal zone
The design of compression struts, considered in a calculation mod-el, is closely linked to how the compressive stresses are distributed in structural element. In experimental models studied in the inves -tigation of strains in the face of the pile caps it was not possible to deine a strut strength parameter. However it was found that in some models was the failure by rupture of the concrete in com -pression strut zone. Therefore, as strength parameter takes lower values than the compression strength of concrete.
Stress in the inferior nodal zone had been checked in the region in which the tie reinforcement is intercepted by the compression strut, perpendicular to the width of the strut. The limits stresses pa-rameters in this region involve the angle of inclination of the strut, set them based on the experimental results is not good alternative
Table 6
Force R
stcalculated on the strut reinforcement bars
Series Models Rst,exp
(kN)
Rst,efe,teo (kN)
B110
B110P125R1 143,90
279,21
B110P125R25 215,77
B110P125R4 306,53
B115
B115P250R1 268,59
279,21
B115P250R25 316,21
B115P250R4 243,83
B120
B120P375R1 290,23
418,81
B120P375R25 315,50
B120P375R4 320,92
B127
B127P500R1 388,52
577,97
B127P500R25 417,76
Table 7
Stress in the inferior nodal zone
Models Pile reaction (kN)
Effective stress (MPa)
Effective stress /
fc Ɵexp
Strut stress (MPa)
Strut stress / fc
B110P125R1 236,00 15,10 0,50 56,30 12,57 0,41
B110P125R25 286,01 18,30 0,60 53,20 14,66 0,48
B110P125R4 308,13 19,72 0,65 43,90 13,67 0,45
B115P250R1 356,34 22,81 0,75 53,00 18,21 0,60
B115P250R25 375,37 24,02 0,79 49,30 18,21 0,60
B115P250R4 402,27 25,75 0,84 57,40 21,69 0,71
B120P375R1 436,90 27,96 0,92 55,70 23,10 0,76
B120P375R25 436,24 27,92 0,92 51,90 21,97 0,72
B120P375R4 466,33 29,85 0,98 55,20 24,51 0,80
B127P500R1 519,31 33,24 1,09 52,90 26,51 0,87
B127P500R25 494,76 31,66 1,04 49,60 24,11 0,79
B127P500R4 493,22 31,57 1,04 53,60 25,41 0,83
Note: fc = 0,9*fcm because the studied pile caps remained the same angle of
inclina-tion of the struts.
To deine the strength parameters, this research stresses the inferior nodal zone (piles) were obtained in each model, considering the ulti-mate force (Fu), and considering the greater reaction in piles. To calculate the stress in the inferior nodal zones is irst calculated efective stress, considering the area of 156,25 cm2 pile; was cal-culated, also a stress strut in considering the projected area pile on an inclined plane the inclination was adopted in accordance with θexp angle calculated from experimental values of tie strain. The cal -culated stresses were related to the average strength of concrete fc compression (calculated with experimental values) multiplied by 0.9 (coeicient of the relationship between the specimen and real structure). These relations and the values of the stress in the infe -rior nodal zone are shown in the table 7.
Based on the values of Table 7 nodal stresses in the pile zone were higher in models of the B127 series. Making a comparison between models of the same series it can be said that for B110 series, B115 and B120 larger stresses in nodal areas occurred for models with larger reinforcement rates column (B110P125R4, B115P250R4, B120P375R4) in B127 series the highest stress value occurred to B127P500R1 model (lower rate).
In designs in series B127 relationships between efective stress and the average compressive strength of the concrete were higher than those recommended, a fact that may have been established that rupture of the concrete in that zone. In the B120 series this value was close to one and in the other series the values were well below proving that there was no rupture of the concrete in that zone.
5. Discussion of results
Initially we present a table 8 with a summary of the main inluences
of reinforcement ratio values of columns in the operation of the models pile caps.
Analyzing the strain reinforcement tie in the central sections, can be said, except for the models B110 and B120 series, the latest average strain were higher in models with smaller geometric rein -forcement ratio of the column. In models of the B120 series of the strain gages has been damaged, hampering the analysis.
The strain measured in pile caps tensile reinforcement, the section containing the axis of the pile, there seems to be a great inluence of of the column section because in models of the B127 series reducing strain along the reinforcement bar was lower in models greater reinforcement rate column.
These indings lead to some conclusions about the anchoring bars of the main reinforcement in two pile caps. Some authors sug-gest that the anchoring start point of the bar is from the of the pile center, and others, recognize that this point is located in the inner plane tangent the pile. The Value of anchoring force is considered in some methods the calculated force equals tie and others sug-gest the mitigation of this force as there is a favorable efect of the compression strut, improving the anchoring condition. It is clear that the pile caps designs practical considerations are adopted, moreover, there is no consensus on what to adopt and how to proj -ect. The main reinforcement bars must be considered in this article and it is always anchored with hooks at the ends where pile caps that receive columns of elongated rectangular section.
Table 8
Summary of the main influences of column reinforcement rate variation
Models
Columns
Influence of reinforcement ratio values of columns Cross section (cm) Reinforcement ratio (%) B110P125R1 12,5x12,5
1,0 Higher rate of reinforcement showed higher ultimate
experimental force
Higher rate of reinforcement showed greater strain in the central position of the strut
B110P125R25 2,5
B110P125R4 4,0
B115P250R1
12,5x25,0
1,0 Higher rate of reinforcement showed higher ultimate
experimental force
Higher rate of reinforcement showed less strain in the central position of the strut
B115P250R25 2,5
B115P250R4 4,0
B120P375R1
12,5x37,5
1,0 Higher rate of reinforcement showed higher ultimate
experimental force
Column reinforcement ratio had little influence on the tie reinforcement strain
B120P375R25 2,5
B120P375R4 4,0
B127P500R1
12,5x50,0
1,0 Lower rate of reinforcement showed higher ultimate experimental
force
Higher rate of reinforcement showed less strain in the central position of the strut
B127P500R25 2,5
B127P500R4 4,0
Note: in all models the strains of the reinforcement in the position of the axis of the piles was low for columns with lower reinforcement ratio
differences between columns of square section and columns of rectangular section. In general, relations for square sec-tion columns parameters are smaller. There is no significant influence of the different columns of reinforcement rates in these parameters. Making a comparative analysis between the experimental values and the parameters suggested by NBR 6118: 2014 [1] and considering that the experimental values no safety factors, it can be said that the smaller experimentally estimated ratios are close to the values suggested by ABNT NBR 6118: 2014 [1]. With this analysis it is clear that there is influence of the section of the elongated columns in the resis-tance of the inferior nodal zones.
6. Conclusion
With the results obtained in this study, it was possible to analyze the inluence of square and rectangular columns and the inluence of diferent longitudinal reinforcement ratios of columns in pile caps tensile reinforcement.
The results corroborated the Fusco [3] method because showed that section of the columns and diferent reinforcement rates inlu -ence the two pile caps’s behavior.
It was concluded that the experimental ultimate forces in the main reinforcement bars of the pile caps occur in the central regions, and the cross sections coincide with planes containing the axes of the piles showed lower strengths. This fact can be understood as the inluence of compressive stress ields in the distribution of tensile stresses in these regions. In models with elongated rect-angular columns this reduction was smaller. This fact shows that the cross section of the columns inluences on requests tie. It is
suggested, therefore, that the tie reinforcement bars in such cases must have been anchored to the hook.
This showed that the strains in the tie reinforcement bars are cut from the central section to the sections containing the axis of the pile. This reduction is smaller in models with elongated rectangular columns and large reinforcement rates, thus reducing the anchor-age lengths and no provision hooks on the main reinforcement tie can be a misconception, and should be analyzed more criterion each case.
The analysis also performed proved the inluence of column sec -tions and reinforcement rates in the tensions that limit the nodal zones of the model, with the possible adoption of criteria that take this into account.
7. Acknowledgments
The authors would like to acknowledge CAPES and CNPq for i -nancial support and the Department of Structural Engineering, School of Engineering of São Carlos, University of São Paulo.
8. References
[1] ASSOCIAÇÃO BRASILEIRA DE NORMAS TÉCNICAS. NBR 6118:2014 – Projeto de estruturas de concreto- Pro -cedimento. Rio de Janeiro, 2014.
[2] BLÉVOT, J.; FRÉMY, R. Semelles sur piex. Analles d’Institut Techique du Bâtiment et des Travaux Publics, Paris, v. 20, n. 230, 1967, p. 223-295, fev.
[3] FUSCO, P. B. Técnica de armar as estruturas de concreto. São Paulo, Editora Pini Ltda, 1994.
Recommandations particulières na calcul et à l’execution des semelles de fundations. Bulletin D’Information. Paris, n. 73, 1970.
[5] ASSOCIAÇÃO BRASILEIRA DE NORMAS TÉCNICAS. NBR 6118:2007 – Projeto de estruturas de concreto. Rio de Janeiro, 2007.
[6] COMISIÓN PERMANENTE DEL HORMIGÓN - EHE: In -strucción Española de Hormigón Armado. Ministerio de Fo -mento, Centro de Publicaciones, Madrid, 2008.
[7] AMERICAN CONCRETE INSTITUTE - ACI 318-08 – Build -ing Code Requirements for Structural Concrete and Com-mentary, Farmington Hills, USA, 2008.
[8] MIGUEL, G. M. Análise experimental e numérica de blocos sobre três estacas. Tese de doutorado, Escola de Engen -haria de São Carlos, USP, São Carlos, Brasil, 2000. [9] SOUZA, R. A. Concreto estrutural: análise e dimension
-amento de elementos com descontinuidades. Tese de dou-torado, Escola Politécnica da Universidade de São Paulo, São Paulo, Brasil, 2004.
[10] DELALIBERA, R. G. Análise experimental e numérica de blocos de concreto armado sobre duas estacas submetidos à ação de força centrada e excêntrica. Tese de doutorado, Escola de Engenharia de São Carlos, USP, São Carlos, Bra -sil, 2006.
[11] BUTTIGNOL, T. E. T. Análise Computacional de Blocos so -bre Estacas. Campinas. Dissertação de Mestrado. Facul -dade de Engenharia Civil, Arquitetura e Urbanismo, Univer -sidade Estadual de Campinas, Campinas, Brasil, 2011. [12] BURKE JUNIOR., J. U. (1978). Blocos rígidos sobre apoios
diretos. São Paulo, Maubertec, 1978.