Clinical utility of prostate-specific antigen mass ratio for
prediction of prostate cancer detection on a repeated
prostate biopsy
_______________________________________________
Won Ki Lee
1, Sangchul Lee
2, Sung Kyu Hong
2, Sang Eun Lee
2, Won Suk Choi
3, Seok-Soo Byun
21Department of Urology, Hallym University Chuncheon Sacred Heart Hospital, Chuncheon; 2Department
of Urology, Seoul National University Bundang Hospital, Seongnam and 3Department of Urology, Choi
Won Suk Urology Clinic, Yongin, Korea
ABSTRACT
ARTICLE
INFO
______________________________________________________________ ______________________
Purpose: To assess the clinical utility of the prostate-specific antigen mass ratio (PSA--MR), a newly developed PSA derivative, simply defined as the (i) PSA density (PSA-D) multiplied by the plasma volume or (ii) total PSA amount in circulation per prostate volume, for predicting prostate cancer (PCa) among men undergoing repeated prostate biopsy (PBx).
Materials and Methods: Patients (n = 286), who underwent a repeated PBx, were analyzed. The various parameters associated with PCa detection were noted in each patient. PSA-MR was also calculated.
Results: PCa was detected in 63 (22.0%) of 286 patients. PSA-MR was the independent predictor in the univariate- and multivariate logistic regression analyses (OR = 3.448, p = 0.001 and OR = 13.430, p = 0.033, respectively). A nomogram that incorporated PSA--MR was considered a useful tool (predictive accuracy: 79.2%, 95% CI: 0.726-0.858, p < 0.001). Furthermore, a nomogram that incorporated PSA-MR would have avoided 59.6% of unnecessary repeated PBx. The predictive accuracy of PSA-MR was also su-perior to that of PSA or PSA-D (p = 0.013 and 0.009, respectively).
Conclusions: PSA-MR was an independent predictor, and its consideration would have avoided 59.6% of unnecessary repeated PBx for PCa detection. PSA-MR was also supe-rior than PSA or PSA-D. Our results support the use of PSA-MR to facilitate counseling with patients after a negative initial PBx, and use of PSA-MR might reduce further unnecessary biopsies.
Key words:
Prostatic Neoplasms; Prostate--Specific Antigen; Biopsy; Mass Screening
Int Braz J Urol. 2014; 40: 484-92
_____________________
Submitted for publication: August 18, 2013
_____________________
Accepted after revision: October 09, 2013
INTRODUCTION
Thirty percent of prostate cancer (PCa) cases are unfortunately missed during the initial pros-tate biopsy (PBx), although PBx is the diagnostic procedure of choice for PCa detection (1,2). Since negative initial PBx cannot conclusively exclude the presence of PCa, many men undergo repeated
Various clinical and pathological findings have historically been considered risk factors for PCa after a negative initial PBx. These include age, digital rectal examination (DRE), prostate volume, prostate-specific antigen (PSA), and its derivati-ves such as PSA velocity (PSA-V) and PSA density (PSA-D), high grade prostatic intraepithelial neo-plasia (HGPIN), and atypical small acinar prolife-ration (ASAP) (4). Among these risk factors, PSA--related parameters are widely used to predict PCa after a negative initial PBx. However, clinical evi-dence is lacking with regard to the ability of PSA--related parameters to identify patients for whom repeated PBx is warranted (5,6).
The parameter called the PSA mass ratio (PSA-MR) was recently suggested as a PCa scree-ning tool by Choi et al. (7). One of the biggest draw-backs of the PSA test is that various factors can in-fluence the PSA level (8-12). Therefore, the authors examined the effects of various factors on PSA le-vels in a screening population, and finally devised the PSA-MR. PSA-MR is simply defined as the (i) PSA-D multiplied by the plasma volume or (ii) total PSA amount in circulation per prostate volume. The authors suggested that the PSA-MR might be more stable than PSA, when the body mass index (BMI), plasma volume, and prostate volume change.
The present study assessed the clinical uti-lity of PSA-MR for predicting PCa among men un-dergoing repeated PBx.
MATERIALS AND METHODS
After receiving approval from the rele-vant institutional review board, a PBx database maintained at a single institution was reviewed. Between May 2003 and March 2011, a total of 292 patients underwent a repeated multi (≥ 12)-core transrectal ultrasonography (TRUS)-guided PBx after a negative initial PBx. A repeated PBx was performed based on suspicious findings on DRE (n = 17), TRUS (n = 46), previous ASAP (n = 35), HGPIN (n = 15) and/or PSA > 4.0ng/mL (n = 263). Among these patients, those who had undergone prior PBx at other institutions, who had been sur-gically treated for prostatic disease prior to repea-ted PBx, or who were taking medication known to influence PSA levels such as 5-α reductase
inhi-bitors were excluded. Finally, 286 patients were included in this study.
The parameters noted for each patient were age, BMI, DRE and TRUS findings, prostate volume, number of cores removed, interval between initial and repeated PBx, pathologic characteristics of ini-tial PBx such as HGPIN and ASAP, and PSA, and its derivatives such as the percentage of free PSA (%fPSA), PSA-V, PSA doubling time (PSA-DT), and PSA-D. PSA-MR was also calculated and noted for each patient.
DRE and TRUS findings were classified as normal or suspicious for PCa. The prostate volume was routinely measured according to the prolate ellipsoid formula via TRUS before undergoing PBx. The prostate was routinely bilaterally biopsied near the apex, mid-gland, and base, with 6 biopsies per side. Suspicious lesions were additionally biopsied. Pathologic PBx findings were assessed by the refer-red pathologist. The %fPSA was calculated as the ratio of free-to-total PSA, multiplied by 100. PSA--V was calculated based on the slope obtained by fitting a linear regression analysis, using all PSA values and the equation: p = at + b (13). PSA-DT was calculated based on the natural logarithm of 2-divided by the slope obtained through fitting a li-near regression of the natural logarithm of PSA on time (14). PSA-D was calculated as the PSA value divided by the prostate volume.
PSA-MR (µg/mL) was defined as the (i) PSA-D multiplied by the plasma volume or (ii) the total PSA amount in circulation per prostate volu-me. Body surface area, plasma volume, PSA mass, and PSA-MR were estimated using the following equations (7):
Body surface area (m2) = body weight
(kg)0.425 x height (m)0.725 x 0.007184 (15).
Plasma volume (l) = body surface area (m2) x 1.670 (16).
PSA mass (µg)=PSA (ng/mL) x plasma vo-lume (l) (17).
PSA-MR (µg/mL)=PSA mass (µg)/prostate volume (mL).
Chi-square test were used in the comparison of continuous and categorical variables, respectively. A univariate logistic regression analysis was used to assess the associations between the parameters and PCa prediction on repeated PBx. Subsequen-tly, a multivariate logistic regression analysis was performed with the statistically significant parame-ters from the univariate analysis, in order to assess the independence of PSA-MR. PSA-D was exclu-ded in the multivariate analysis that incorporated PSA-MR, due to multi-collinearity issue (tolerance value = 0.303). Nomograms that did and did not incorporate PSA-MR were generated with the mul-tivariate regression coefficients. Next, receiver ope-rating characteristic (ROC)-derived areas under the curves (AUCs) were estimated and compared with the DeLong et al. test. The ROC curve cut-off value was estimated with the maximum Youden index. Furthermore, the sensitivity, specificity, positive predictive value (PPV) and negative predictive va-lue (NPV) were calculated, and compared with the proportional paired test. The proportion of avoided unnecessary repeated PBx (PAB) was also estimated with the following equation (5): (number of false positives nomogram not incorporating PSA-MR - number of false positives nomogram incorporating PSA-MR) ÷ number of false positives nomogram not incorporating PSA-MR. At fixed sensiti-vity thresholds, which were set at 90 and 95%, the specificity, PPV, NPV and PAB were also calculated and compared, in order to specifically simulate the requirements of a PSA-MR.
To compare PSA-MR individually with PSA and other derivatives, ROC-AUCs were used and compared with the DeLong et al. test.
All p values were 2-sided, and p < 0.05 was considered significant.
RESULTS
Table-1 shows the descriptive characteris-tics of the 286 patients who underwent a repeated PBx. PCa was detected in 63 (22.0%) of these 286 patients. Patients with PCa differed significantly from those without PCa in several parameters. Pa-tients with PCa tended to be older (p = 0.004) and to have higher suspicious DRE finding ratios (p = 0.026), smaller prostates (p = 0.001), and greater previous ASAP ratios (p = 0.001). The mean
PSA--V and PSA-MR levels were also higher in patients with PCa (p = 0.001 and 0.025, respectively). In contrast, there was no association with respect to PSA (p = 0.526), %fPSA (p = 0.084), PSA-DT (p = 0.421), or PSA-D (p = 0.306).
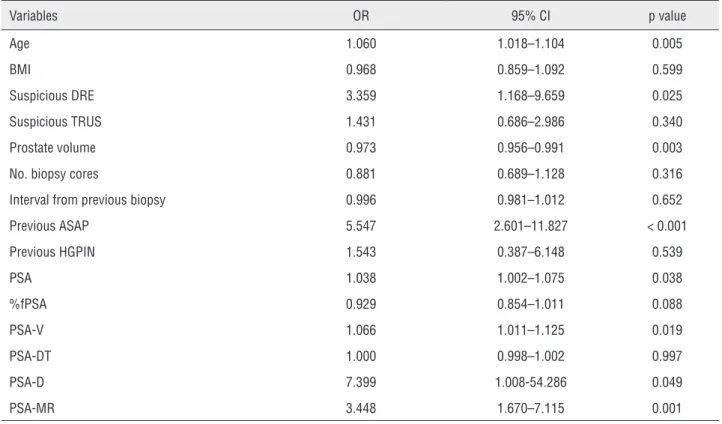
In univariate logistic regression analyses (Table-2), age (odds ratio (OR) = 1.060, p = 0.005), a suspicious DRE finding (OR = 3.359, p = 0.025), prostate volume (OR = 0.973, p = 0.003), previous ASAP (OR = 5.547, p < 0.001), PSA (OR = 1.038, p = 0.038), V (OR = 1.066, p = 0.019), and PSA--D (OR = 7.399, p = 0.049) were significantly as-sociated with the repeated PBx outcome. PSA-MR was also significantly associated with outcome (OR = 3.448, p = 0.001). A multivariate logistic regres-sion model that did not incorporate PSA-MR sho-wed that age (OR = 1.090, p = 0.001), prostate vo-lume (OR = 0.940, p < 0.001), and previous ASAP (OR = 7.261, p < 0.001) were independent predic-tors of the repeated PBx outcome (Table-3). When PSA-MR was incorporated into the multivariate logistic regression model, age and previous ASAP remained independent predictors (OR = 1.115 and 8.946, respectively; p < 0.001 for both). PSA-MR was also an independent predictor of the repeated PBx outcome (OR = 13.430, p = 0.033; Table-3).
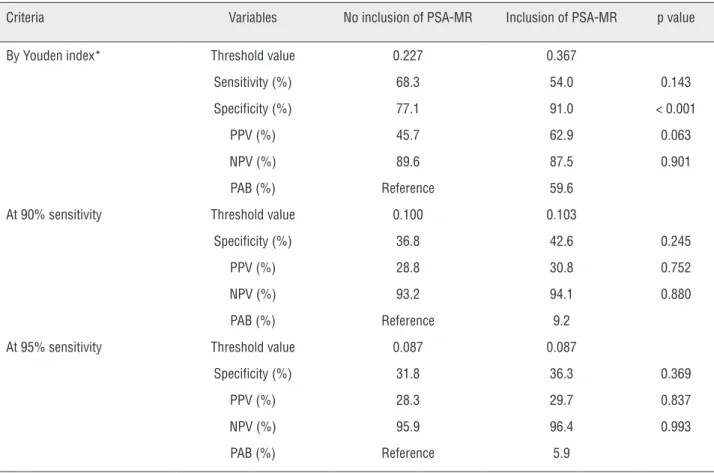
A multivariate model that incorporated PSA-MR was considered a useful tool (predicti-ve accuracy = 79.2%, 95% CI = 0.726-0.858, p < 0.001). The model that incorporated PSA-MR was not inferior with respect to predictive accuracy (p = 0.853), sensitivity (p = 0.143), PPV (p = 0.063) or NPV (p = 0.901), when compared with the mo-del that did not incorporate PSA-MR. Furthermore, the model that incorporated PSA-MR was superior with respect to specificity (p < 0.001), and use of this model would have avoided 59.6% of unne-cessary repeated PBx (Table-4). At fixed sensitivity thresholds of 90% and 95%, use of the model that incorporated PSA-MR would also have avoided 9.2% and 5.9% of unnecessary repeated PBx, res-pectively (Table-4).
Table 1 - Associations of different variables according to the presence of prostate cancer in the entire repeated biopsy cohort.
Variables Total cohort (n = 286)
Prostate cancer (n = 63)
No prostate Cancer (n = 223)
p value
Age, years, mean ± SD 64.5 ± 7.8 67.0 ± 6.7 63.9± 7.9 0.004 BMI, kg/m2, mean±SD 24.3 ± 2.3 24.2 ± 2.3 24.4 ± 2.3 0.600
Suspicious DRE, n (%) 15 (5.2) 7 (11.1) 8 (3.6) 0.026 Suspicious TRUS, n (%) 45 (15.7) 12 (20.7) 33 (15.4) 0.338 Prostate volume, mL, mean ± SD 50.5± 21.9 43.4 ± 16.2 52.6 ± 22.9 0.001* No. biopsy cores, mean ±SD 13.2 ± 1.2 13.1 ± 1.1 13.3 ± 1.2 0.317 II Interval from previous biopsy, months,
mean ±SD
27.2±19.0 26.2 ± 22.3 27.4 ± 17.9 0.214*
Previous ASAP, n (%) 33 (11.5) 18 (28.6) 15 (6.7) 0.001 Previous HGPIN, n (%) 10 (3.5) 3 (4.8) 7 (3.1) 0.463 PSA, ng/mL, mean±SD 9.99±7.21 11.73 ± 10.94 9.50 ± 5.67 0.526* %fPSA, %, mean ±SD 19.65±10.64 15.52 ± 6.94 20.99 ± 11.33 0.084 PSA-V, ng/mL/year, mean±SD 2.58 ± 4.63 3.87 ± 6.09 2.21± 4.07 0.001* PSA-DT, months, mean ± SD 83.40 ±176.46 83.48 ± 173.47 83.38 ± 177.84 0.421* PSA-D, ng/mL/mL, mean ±SD 0.23 ±0.13 0.26 ± 0.17 0.22 ± 0.12 0.306* PSA-MR, ug/mL, mean ±SD 0.49 ±0.38 0.65 ± 0.59 0.45 ± 0.28 0.025*
SD = standard deviation; IQR = interquartile range; BMI = body mass index, DRE = digital rectal examination; TRUS = transrectal ultrasonography; No. = number, ASAP = atypical small acinar proliferation; HGPIN = high grade prostatic intraepithelial neoplasia; PSA = prostate-specific antigen; %fPSA = percent of free prostate-specific antigen; PSA-V = prostate-specific antigen velocity; PSA-DT = prostate-specific antigen doubling time; PSA-D = prostate-specific antigen density, PSA-MR = prostate-specific antigen mass ratio.
* Non-parametric comparison.
DISCUSSION
After the introduction of the PSA test in the 1980s (18), PSA is among the most widely used pa-rameters for predicting PCa detection. Various PSA derivatives were also devised to enhance the predic-tive accuracy for PCa detection, and these have also become widely used (4). However, clinical evidence regarding the efficacy of PSA and its derivatives to identify PCa in patients referred for a repeated PBx is still lacking (5,6), although the clinical utilities of these parameters in guiding repeated PBx decisions have been reported (2,19-21).
Table 2 - Univariate logistic regression analyses of predictors of prostate cancer detection during a repeated biopsy.
Variables OR 95% CI p value
Age 1.060 1.018–1.104 0.005
BMI 0.968 0.859–1.092 0.599
Suspicious DRE 3.359 1.168–9.659 0.025 Suspicious TRUS 1.431 0.686–2.986 0.340 Prostate volume 0.973 0.956–0.991 0.003 No. biopsy cores 0.881 0.689–1.128 0.316 Interval from previous biopsy 0.996 0.981–1.012 0.652 Previous ASAP 5.547 2.601–11.827 < 0.001 Previous HGPIN 1.543 0.387–6.148 0.539
PSA 1.038 1.002–1.075 0.038
%fPSA 0.929 0.854–1.011 0.088 PSA-V 1.066 1.011–1.125 0.019 PSA-DT 1.000 0.998–1.002 0.997 PSA-D 7.399 1.008-54.286 0.049 PSA-MR 3.448 1.670–7.115 0.001
OR = odds ratio; CI = confidence interval; BMI = body mass index; DRE = digital rectal examination; TRUS = transrectal ultrasonography; No. = number; ASAP = atypical small acinar proliferation; HGPIN = high grade prostatic intraepithelial neoplasia; PSA = prostate-specific antigen; %fPSA = percent of free prostate-specific antigen; PSA-V =
prostate-specific antigen velocity; PSA-DT = prostate-specific antigen doubling time; PSA-D = prostate-specific antigen density; PSA-MR = prostate-specific antigen mass ratio.
Table 3 - Multivariate logistic regression analyses of predictors of prostate cancer detection during repeated biopsy, according to the incorporation of PSA mass ratio.
Variables No incorporation of PSA-MR Incorporation of PSA-MR
OR 95% CI p value OR 95% CI p value Age 1.090 1.038-1.145 0.001 1.115 1.058-1.174 < 0.001 Suspicious DRE 2.927 0.877-9.769 0.081 2.812 0.830-9.533 0.097 Prostate volume 0.940 0.911-0.970 < 0.001 0.976 0.945-1.008 0.142 Previous ASAP 7.261 3.028-17.407 < 0.001 8.946 3.683-21.732 < 0.001 PSA 1.104 1.000-1.218 0.050 0.936 0.826-1.062 0.306 PSA-V 1.037 0.959-1.121 0.368 1.026 0.943-1.116 0.548 PSA-D 0.050 0.001-8.628 0.255 *
PSA-MR - - - 13.430 1.240-145.478 0.033
OR = odds ratio; CI = confidence interval; DRE = digital rectal examination; ASAP = atypical small acinar proliferation; PSA = prostate-specific antigen; PSA-V = prostate-specific antigen velocity; PSA-D = prostate-specific antigen density; PSA-MR = prostate-specific antigen mass ratio.
Table 4 - Comparison of the utilities of nomograms for the prediction of prostate cancer during repeated biopsy, according to the incorporation of the prostate-specific antigen mass ratio.
Criteria Variables No inclusion of PSA-MR Inclusion of PSA-MR p value
By Youden index* Threshold value 0.227 0.367
Sensitivity (%) 68.3 54.0 0.143 Specificity (%) 77.1 91.0 < 0.001
PPV (%) 45.7 62.9 0.063 NPV (%) 89.6 87.5 0.901 PAB (%) Reference 59.6
At 90% sensitivity Threshold value 0.100 0.103
Specificity (%) 36.8 42.6 0.245 PPV (%) 28.8 30.8 0.752 NPV (%) 93.2 94.1 0.880 PAB (%) Reference 9.2
At 95% sensitivity Threshold value 0.087 0.087
Specificity (%) 31.8 36.3 0.369 PPV (%) 28.3 29.7 0.837 NPV (%) 95.9 96.4 0.993 PAB (%) Reference 5.9
PSA = prostate-specific antigen, PSA-MR = prostate-specific antigen mass ratio, PPV = positive predictive value, NPV = negative predictive value, PAB = proportion that avoided unnecessary repeated prostate biopsy.
*Threshold value was estimated using the Youden index maximum.
Table 5 - Comparison of predictive accuracies of prostate cancer detection for the prostate-specific antigen and its derivatives with the receiver-operating characteristic-derived area under the curve.
Variables ROC-derived AUC 95% CI p value of AUC
p value of comparison with AUC for PSA-MR
PSA-MR 0.592 0.506-0.678 0.025 Reference PSA 0.526 0.438-0.614 0.526 0.013 %fPSA 0.361 0.204-0.518 0.108 0.022 PSA-V 0.641 0.569-0.713 0.001 0.013 PSA-DT 0.474 0.391-0.557 0.527 0.019 PSA-D 0.542 0.456-0.628 0.306 0.009
AUC = area under the curve; CI = confidence interval; ROC = receiver operating characteristics; PSA-MR = prostate-specific antigen mass ratio; PSA = prostate-specific antigen; %fPSA = percent of free prostate-specific antigen; PSA-V = prostate-specific antigen velocity; PSA-DT = prostate-specific antigen doubling time; PSA-D =
The use of PSA-MR, the newly devised PSA derivative for PCa prediction, was recently proposed by Choi and colleagues (7). The authors examined the effects of plasma volume, insulin resistance (IR), prostate volume, and BMI on PSA in a general scre-ening population after adjusting for potentially in-fluencing factors, and finally devised the PSA-MR. This study is noteworthy because few studies have considered the combined effects of these variables on PSA levels. The authors suggested that PSA-MR might be more stable than PSA, when the BMI, plas-ma volume, and prostate volume change.
PSA-MR seems to be more attractive than other PSA-related parameters, because it considers confounding effects on PSA levels. Our study is the first to assess the clinical utility of PSA-MR for the prediction of PCa among men undergoing repea-ted PBx, and we have identified the possible cli-nical utility of the PSA-MR. Currently PSA-MR is an independent predictor of PCa detection, even af-ter adjusting for various parameaf-ters. The predictive accuracy of PSA-MR was also superior to that of PSA or most of its derivatives, including PSA-D. It is especially noteworthy that PSA-MR had a higher predictive accuracy than PSA-D, since PSA-MR is heavily correlated with PSA-D. This result suggests that PSA-MR might be a more valuable predictor than PSA-D, and might potentially replace PSA-D in the clinical setting. Furthermore, the model that incorporated PSA-MR was superior with respect to specificity, and its use would have avoided 59.6% of unnecessary repeated PBx. Even when compared at fixed sensitivity thresholds of 90% and 95%, which were specifically applied to simulate the require-ment for a PSA-MR to allow false-negative rates of only 10% or 5%, use of the model that incorpora-ted PSA-MR would have avoided 9.2% and 5.9% of unnecessary repeated PBx, respectively. Since none of predictors can be solely used to counsel an indi-vidual patient on the need to perform a PBx to rule out PCa (1), PSA-MR could potentially help physi-cians to counsel patients to pursue further PBx.
Recently, Hong et al. (22) investigated the value of PSA-MR in the prediction of PCa detec-tion among patients who underwent initial PBx. The authors reported that PSA-MR was an independent predictor of PCa detection, and was significantly more accurate than PSA. However, the replacement
of PSA level with MR or the addition of PSA--MR in the multivariate model was not associated with a significantly increased accuracy for predic-ting PCa detection via initial PBx. These results are similar to ours, which showed that PSA-MR was an independent predictor of PCa detection during repe-ated PBx. On the other hand, there are several di-fferent points between our study and that by Hong et al. (22). The previous study only analyzed initial PBx data, while we analyzed data from a repeated PBx database. Since approximately 30% of PCa ca-ses are missed during the initial PBx, the previous study was limited in terms of a precise reflection of the clinical utility of PSA-MR. Our analysis of results from a repeated PBx database could streng-then our understanding of the clinical utility of PSA-MR. Furthermore, since it is more difficult to decide whether to pursue a repeated PBx, compared to an initial PBx, it is more important to identify the parameters associated with the repeated PBx ou-tcome in the clinical setting. Another point is that we analyzed not only the predictive accuracy, but also other predictive parameters such as specificity, sensitivity, PPV, NPV and PAB. Our study showed that the specificity of the model that incorporated PSA-MR was superior to that of the model that did not incorporate PSA-MR. Furthermore, use of the model that incorporated PSA-MR would have sig-nificantly avoided unnecessary repeated PBx, even when the models were compared at fixed sensitivity thresholds of 90% and 95%. As aforementioned, the avoidance of unnecessary PBx is as important as PCa detection, especially when a repeated PBx is pursued.
Another strength of our study is that it is the first to compare PSA-MR with PSA and its de-rivatives, considering that PSA-MR is also a PSA derivative. In a logistic regression analysis that cluded PSA and its derivatives, PSA-MR was an in-dependent predictor of PCa detection during repea-ted PBx. From the viewpoint of predictive accuracy, PSA-MR was superior to PSA or most PSA deriva-tives. Therefore, PSA-MR might be a useful tool for predicting PCa during repeated PBx.
atte-nuate the value of PSA-MR. However, the clinical utility of PSA-MR cannot be entirely discounted because there are similar limitations for other PSA derivatives, which are already widely used. PSA-MR is the logical modification of PSA, as it is adjusted by the BMI, plasma volume, and prostate volume. Additionally, our study showed that PSA-MR was an independent predictor of PCa detection, and its use would have avoided 59.6% of unnecessary re-peated PBx. Its predictive accuracy was also supe-rior to that of most other PSA-related parameters, including PSA or PSA-D. Accordingly, PSA-MR is another potentially useful tool for predicting PCa during repeated PBx that could help physicians to counsel patients regarding further PBx.
Our study had a few limitations. First, not all patients with a negative initial PBx were inclu-ded in our study, resulting in a selection bias, al-though almost all previous studies in this field had the same limitation. However, we analyzed all data at a single institution to reduce the bias. Second, since all of our study subjects were Korean men, the PCa-related clinical characteristics might differ from those of other races (23). Therefore, our results may not be directly applicable to other races. Las-tly, new biomarkers such as prostate cancer gene-3 were not analyzed, although the clinical utilities of these new biomarkers have yet to be fully determi-ned (1). However, the most widely used predictors of PCa detection were analyzed.
CONCLUSIONS
PSA-MR was an independent predictor, and its use would have avoided 59.6% of unnecessary repeated PBx for PCa detection after a negative ini-tial PBx. PSA-MR was also superior to PSA or most of its derivatives, including PSA-D. Our results su-pport the use of PSA-MR as a helpful tool when counseling patients after a negative initial PBx, and as a means to reduce further unnecessary biopsies.
ABBREVIATIONS
PCa = prostate cancer PBx = prostate biopsy
PSA = prostate-specific antigen PSA-MR = psa mass ratio
PSA-V = psa velocity PSA-D = psa density
PSA-DT = psa doubling time %fPSA = percent of free PSA DRE = digital rectal examination TRUS = transrectal ultrasonography
HGPIN = high grade prostatic intraepithelial neo-plasia
ASAP = atypical small acinar proliferation BMI = body mass index
IR = insulin resistance
PPV = positive predictive value NPV = Negative predictive value
PAB = Proportion that avoided unnecessary repea-ted PBx
CONFLICT OF INTEREST
None declared.
REFERENCES
1. Heidenreich A, Bellmunt J, Bolla M, Joniau S, Mason M, Matveev V, et al.: EAU guidelines on prostate cancer. Part 1: screening, diagnosis, and treatment of clinically localised disease. Eur Urol. 2011; 59: 61-71.
2. Zaytoun OM, Jones JS: Prostate cancer detection after a negative prostate biopsy: lessons learnt in the Cleveland Clinic experience. Int J Urol. 2011; 18: 557-68.
3. Benecchi L, Pieri AM, Melissari M, Potenzoni M, Pastizzaro CD: A novel nomogram to predict the probability of prostate cancer on repeat biopsy. J Urol. 2008; 180: 146-9.
4. Scattoni V, Maccagnano C, Zanni G, Angiolilli D, Raber M, Roscigno M, et al.: Is extended and saturation biopsy necessary? Int J Urol. 2010; 17: 432-47.
5. Auprich M, Augustin H, Budäus L, Kluth L, Mannweiler S, Shariat SF, et al.: A comparative performance analysis of total specific antigen, percentage free prostate-specific antigen, prostate-prostate-specific antigen velocity and urinary prostate cancer gene 3 in the first, second and third repeat prostate biopsy. BJU Int. 2012; 109: 1627-35. 6. Catalona WJ, Southwick PC, Slawin KM, Partin AW, Brawer
MK, Flanigan RC, et al.: Comparison of percent free PSA, PSA density, and age-specific PSA cutoffs for prostate cancer detection and staging. Urology. 2000; 56: 255-60. 7. Choi HC, Park JH, Cho BL, Son KY, Kwon HT: Prostate
8. Klein LT, Lowe FC: The effects of prostatic manipulation on prostate-specific antigen levels. Urol Clin North Am. 1997; 24: 293-7.
9. Marks LS, Andriole GL, Fitzpatrick JM, Schulman CC, Roehrborn CG: The interpretation of serum prostate specific antigen in men receiving 5alpha-reductase inhibitors: a review and clinical recommendations. J Urol. 2006; 176: 868-74.
10. Fowler JE Jr, Bigler SA, Kilambi NK, Land SA: Relationships between prostate-specific antigen and prostate volume in black and white men with benign prostate biopsies. Urology. 1999; 53: 1175-8.
11. Nogueira L, Corradi R, Eastham JA: Prostatic specific antigen for prostate cancer detection. Int Braz J Urol. 2009; 35: 521-9; discussion 530-2.
12. Barqawi AB, Golden BK, O’Donnell C, Brawer MK, Crawford ED: Observed effect of age and body mass index on total and complexed PSA: analysis from a national screening program. Urology. 2005; 65: 708-12.
13. Connolly D, Black A, Murray LJ, Napolitano G, Gavin A, Keane PF: Methods of calculating prostate-specific antigen velocity. Eur Urol. 2007; 52: 1044-50.
14. Ramírez ML, Nelson EC, Devere White RW, Lara PN Jr, Evans CP: Current applications for prostate-specific antigen doubling time. Eur Urol. 2008; 54: 291-300.
15. Du Bois D, Du Bois EF: A formula to estimate the approximate surface area if height and weight be known. 1916. Nutrition. 1989; 5: 303-11; discussion 312-3.
16. Boer P: Estimated lean body mass as an index for normalization of body fluid volumes in humans. Am J Physiol. 1984; 247: F632-6.
17. Bañez LL, Hamilton RJ, Partin AW, Vollmer RT, Sun L, Rodriguez C, et al.: Obesity-related plasma hemodilution and PSA concentration among men with prostate cancer. JAMA. 2007; 298: 2275-80.
18. Stamey TA, Yang N, Hay AR, McNeal JE, Freiha FS, Redwine E: Prostate-specific antigen as a serum marker for adenocarcinoma of the prostate. N Engl J Med. 1987; 317: 909-16.
19. Thompson IM, Tangen CM, Ankerst DP, Chi C, Lucia MS, Goodman P, et al.: The performance of prostate specific antigen for predicting prostate cancer is maintained after a prior negative prostatebiopsy. J Urol. 2008; 180: 544-7. 20. Catalona WJ, Partin AW, Slawin KM, Brawer MK, Flanigan
RC, Patel A, et al.: Use of the percentage of free prostate-specific antigen to enhance differentiation of prostate cancer from benign prostatic disease: a prospective multicenter clinical trial. JAMA. 1998; 279: 1542-7.
21. Keetch DW, McMurtry JM, Smith DS, Andriole GL, Catalona WJ: Prostate specific antigen density versus prostate specific antigen slope as predictors of prostate cancer in men with initiallynegative prostatic biopsies. J Urol. 1996; 156: 428-31.
22. Hong SK, Oh JJ, Byun SS, Hwang SI, Choo MS, Lee SE: Value of prostate-specific antigen (PSA) mass ratio in the detection of prostate cancer in men with PSA levels of ≤10 ng/mL. BJU Int. 2012; 110: E81-5.
23. Lee DH, Lee SH, Rha KH, Choi IY, Lee JY, Kim SW, et al.: The Establishment of K-CaP (the Multicenter Korean Prostate Cancer Database). Korean J Urol. 2013; 54: 229-33.
_______________________ Correspondence address: