Use of the probability of stone formation (PSF) score to
assess stone forming risk and treatment response in a cohort
of Brazilian stone formers
_______________________________________________
Benjamin Turney
1, William Robertson
2, Oliver Wiseman
3, Carmen Regina P. R. Amaro
4, Victor A. Leitão
5,
Isabela Leme da Silva
4, João Luiz Amaro
51Department of Urology, University of Oxford, Oxford; 2Deparment of Urolithiasis Research and 3Department of Urology, Cambridge University Hospitals Trust, Cambridge, United Kingdom; 4Department of Urinary Lithiasis Metabolism Service and 5Department of Urology, School of Medicine, São Paulo State University (UNESP), Botucatu, SP, Brazil
ABSTRACT
ARTICLE
INFO
______________________________________________________________ ______________________
Introduction: The aim was to confirm that PSF (probability of stone formation) changed appropriately following medical therapy on recurrent stone formers.
Materials and Methods: Data were collected on 26 Brazilian stone-formers. A baseli-ne 24-hour uribaseli-ne collection was performed prior to treatment. Details of the medical treatment initiated for stone-disease were recorded. A PSF calculation was performed on the 24 hour urine sample using the 7 urinary parameters required: voided volume, oxalate, calcium, urate, pH, citrate and magnesium. A repeat 24-hour urine sample was performed for PSF calculation after treatment. Comparison was made between the PSF scores before and during treatment.
Results: At baseline, 20 of the 26 patients (77%) had a high PSF score (> 0.5). Of the 26 patients, 17 (65%) showed an overall reduction in their PSF profiles with a medical treatment regimen. Eleven patients (42%) changed from a high risk (PSF > 0.5) to a low risk (PSF < 0.5) and 6 patients reduced their risk score but did not change risk category. Six (23%) patients remained in a high risk category (> 0.5) during both assessments.
Conclusions: The PSF score reduced following medical treatment in the majority of
patients in this cohort.
Key words:
Probability; Calculi; Lithiasis
Int Braz J Urol. 2014; 40: 507-12
_____________________
Submitted for publication: August 22, 2013
_____________________
Accepted after revision: March 22, 2014
INTRODUCTION
Stone disease is an increasingly prevalent condition throughout the world with a global ave-rage lifetime prevalence of around 10% (range 8 to 22%) (1-5). On average, the recurrence rate is 50% within 5 years but some patients form stones much more frequently (6). Treatment costs are high (7,8). Epidemiological studies have linked stone disease to obesity, metabolic syndrome, and also to fluid, pro-tein and salt intake (9-11). Lifestyle changes, dietary
pa-IBJU| USE OF THE PROBABILITY OF STONE FORMATION (PSF) SCORE TO ASSESS
508
tients before and during treatment to investigate the changes in their PSF scores. The aim was to confirm that PSF changed appropriately following medical therapy and to determine whether PSF might be used to help tailor treatment for recurrent stone formers.
MATERIALS AND METHODS
Data were collected on 26 Brazilian stone--formers attending Urolithiasis Metabolism Outpa-tient Clinics - Paulista State University (UNESP), São Paulo, Brazil. This study was approved by the Research Ethics Committee of the School of Medi-cine of Botucatu, UNESP (Protocol CEP 3331-2009) and all patients gave their informed consent. De-tails of patient age, gender, weight and height were recorded. A baseline 24-hour urine sample was collected from each patient prior to treatment for a full metabolic evaluation. PSF analysis included 7 urinary parameters: voided volume, oxalate, cal-cium, urate, pH, citrate and magnesium. The PSF algorithm is based on a Bayesian mathematical for-mula which weights each of the contributory risk factors according to a set of “risk curves” derived from frequency distributions in a large number of idiopathic stone-formers and their controls (22,23). The PSF algorithm produces values between 0 and 1 for 5 different patterns of stone (calcium oxalate, urate, calcium phosphate, mixed calcium oxalate and urate and mixed calcium oxalate and calcium phosphate). PSF scores greater than 0.5 suggest a high stone risk (23). All patients in this cohort re-ceived some form of medication for treating stone disease, many received polypharmacy. Details of the patients’ medication were recorded. All patients were advised to increase their fluid intake in order to mantain a colorless urine output (at least 2 li-ters per day). A repeat 24-hour urine sample was performed for PSF calculation during treatment. Repeat 24-hour urine collections were performed a minimum of 4 months after treatment commenced.
RESULTS
The cohort included 26 patients (15 women and 11 men) with a mean age of 45.4 years (median 46, range 28-67) and a mean BMI of 27.8 (median 28.1, range 15.6 - 39.9). All patients had complete
values for the 7 parameters required for the PSF calculation before and during treatment (Table-1).
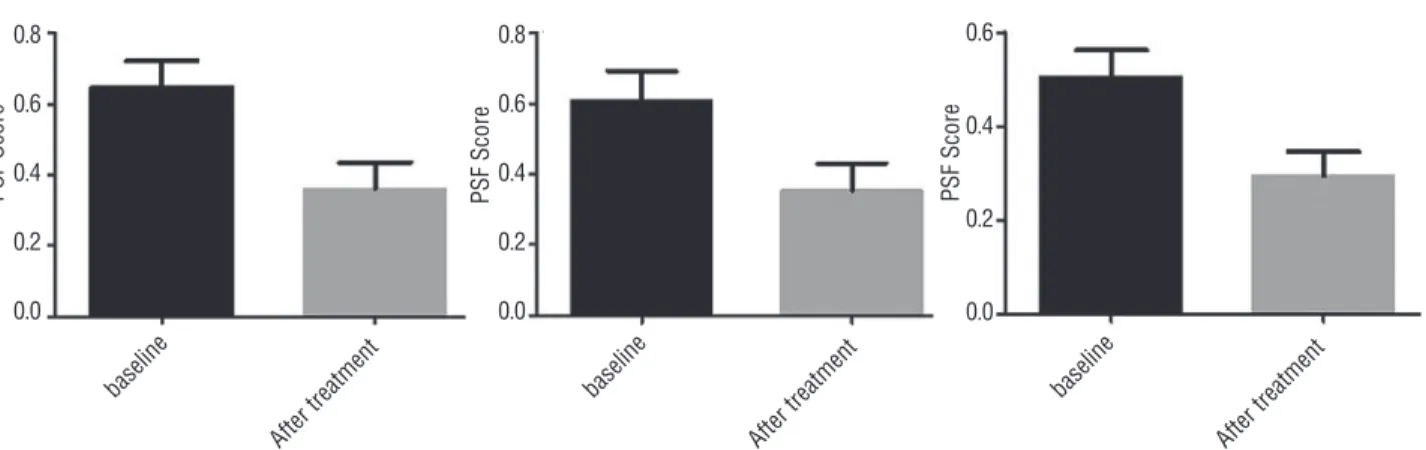
The majority of patients were high risk for calcium stones before treatment according to the PSF scores. For calcium oxalate (p = 0.0004), mi-xed calcium oxalate/calcium phosphate (p = 0.006) and calcium phosphate stone risks (p = 0.002) the-re wethe-re significant overall the-reductions in PSF sco-re within the cohort following tsco-reatment (paisco-red t-test) (Figure-1). There was only one patient in the cohort with a high PSF score (> 0.5) for uric acid stones (patient 3). This patient’s PSF score dropped to almost 0 after treatment. At baseline 20 of the 26 patients (77%) had at least one high PSF score amongst their 5 PSF scores (> 0.5) (Table-2). Of the 26 patients, 17 (65%) showed an reduction in their PSF profiles with an aggressive medical treatment regimen (Table-3). 11 patients (42%) changed from a high risk (PSF > 0.5) to a low risk (PSF < 0.5) in at least one of their PSF scores and 6 patients reduced their risk score but did not change risk ca-tegory. Six (23%) patients remained in a high risk category (> 0.5) in both assessments (Table-2). Two patients showed an increase in risk between tests - one because of a marked increase in urinary oxa-late (patient 19) and the other because of a major decrease in urine volume (patient 26). One patient was in the low risk category in both tests (Table-2).
DISCUSSION
IBJU | USE OF THE PROB
ABILITY OF ST
ONE FORMA
TION (PSF) SCORE T
O ASSESS
509
Baseline 24 hour urine values Post treatment 24 hour urine values
Patient Vol. litres pH Ca mmol UA mmol Cit mmol Ox mmol Mg mmol Vol. litres pH Ca mmol UA mmol Cit mmol Ox mmol Mg mmol
1 1.76 5.8 6.15 3.27 1.49 0.10 2.67 3.26 6.1 3.50 3.59 1.41 0.08 1.60
2 1.4 6.0 4.68 3.12 2.07 0.54 1.32 1.5 5.6 1.88 4.43 1.05 0.08 1.29
3 1.6 5.0 2.56 4.32 1.82 0.24 1.95 1.75 5.0 0.44 2.58 2.08 0.10 2.42
4 2.5 6.2 7.80 4.91 0.65 0.64 5.96 2.4 5.0 3.24 4.20 2.38 0.12 1.39
5 1.56 6.0 3.39 2.29 0.80 0.80 3.80 0.9 6.3 0.77 1.73 0.35 0.13 2.88
6 1.65 6.0 5.20 4.25 4.57 0.34 3.12 1.05 6.0 4.43 4.12 4.68 0.16 4.36
7 2.5 6.0 5.75 2.22 0.86 0.20 3.80 1.9 7.0 3.08 1.75 5.44 0.20 3.00
8 1.3 6.0 11.40 2.67 4.60 0.45 4.69 0.8 6.0 3.55 4.00 4.77 0.24 2.51
9 1.5 6.1 7.53 2.99 3.48 0.17 5.06 1.7 5.5 4.17 1.12 3.48 0.26 3.33
10 4.28 5.0 19.80 6.58 10.31 0.26 4.89 4.28 6.0 20.53 5.42 9.23 0.26 3.16
11 1.65 6.0 5.55 2.99 2.79 0.16 3.04 2.54 5.0 3.18 2.87 2.10 0.27 3.59
12 1.2 6.0 2.60 1.61 0.17 0.64 4.19 1.45 5.6 6.33 1.48 0.23 0.29 3.12
13 1.4 5.5 4.23 1.83 1.56 0.35 2.67 1.35 5.0 3.02 2.25 3.47 0.32 1.22
14 1.55 6.5 5.30 3.21 1.74 0.32 1.32 2.42 6.2 4.90 3.79 3.40 0.32 1.29
15 1.8 5.6 6.30 2.94 1.94 0.36 1.41 1.56 5.9 0.78 2.05 2.11 0.36 0.82
16 1 6.0 7.43 2.37 2.15 0.70 3.12 2 6.0 6.15 3.45 2.27 0.37 2.88
17 1.29 5.9 5.45 2.19 1.44 0.50 2.38 2 5.6 4.15 1.67 3.24 0.46 3.29
18 1.5 6.0 5.38 3.55 2.59 0.59 3.90 2.42 6.0 4.45 3.41 1.86 0.49 3.16
19 0.86 7.0 3.45 2.31 5.99 0.04 3.29 1.72 7.0 7.53 2.76 7.79 0.50 2.85
20 1.71 5.9 9.60 5.09 0.20 0.46 1.40 2 6.0 2.90 2.77 2.64 0.53 1.15
21 2 6.5 10.50 2.50 2.53 0.75 4.85 1.8 6.9 6.10 2.52 2.48 0.67 6.25
22 2.2 5.0 3.85 1.96 2.15 0.71 4.23 1.88 5.9 0.41 2.66 0.91 0.71 2.17
23 1.76 6.0 2.50 1.12 1.78 0.94 0.86 1.35 6.0 4.45 3.36 8.49 0.73 2.59
IBJU| USE OF THE PROBABILITY OF STONE FORMATION (PSF) SCORE TO ASSESS
510
As demonstrated by the patients in this cohort, there are often abnormalities in 24-hour urine collections and it is difficult for the treating physician to know which are most significant and which to treat. The PSF algorithm weights each of the parameters to produce an overall risk. Althou-gh single factors may be within normal or just outside normal limits they can alter the overall risk profile significantly.
These data also emphasise how important it is to determine which aspects of a patient’s urinary profile contribute most to stone risk. Several patients in this cohort remained at high risk despite medical treatment. For the most part, this was due to persis-tently high urinary oxalate levels which will not be addressed by the routine pharmacotherapy prescri-bed in this cohort.
The limitations of this study are its small co-hort size, the use polypharmacy which makes analy-sis of effect of individual drugs impossible, a single 24 hour urine collection before and after treatment and the absence of data on dietary influence or de-tails of stone type. Larger, more comprehensive stu-dies are required to validate further the use of PSF scoring in the management of stone disease over longer periods of treatment. Ideally, this should be correlated with a reduction in stone recurrence rate.
In order to reduce stone risk a holistic approach to risk determination must be taken and a personalized treatment plan including lifestyle, dietary advice, and pharmacotherapy should be advocated. Ideally, PSF score should be used in conjunction with dietary and lifes-tyle information to create a personalized tre-atment plan. Patients should be reviewed with repeat tests to check compliance.
CONCLUSIONS
In conclusion, the PSF score changed from high to low risk following medical treat-ment in the majority of patients in this cohort. This makes PSF score a potentially useful short--term surrogate marker to assess stone risk. PSF score may be used as part of a more comprehen-sive evaluation of stone risk to reduce the like-lihood of recurrent stones in individual patients.
CONFLICT OF INTEREST
Benjamin Turney, William Robertson, Oli-ver Wiseman, are directors of StoneScreen Ltd a company that provides advice for stone formers.
Other authors have no conflict of interest.
Figure 1 - Graphs to show mean PSF score and standard deviation in each PSF category for the 26 patients in the study. PSFs above 0.5 are considered high.
0.8
0.6
0.4
0.2
0.0
0.8
0.6
0.4
0.2
0.0
0.6
0.4
0.2
0.0
PSF Score
baseline baseline baseline
After treatment After treatment After treatment
IBJU | USE OF THE PROB
ABILITY OF ST
ONE FORMA
TION (PSF) SCORE T
O ASSESS
511
Baseline PSF Post treatment PSF
Patient UA UA / CaOx CaOx CaOx / CaP CaP UA UA / CaOx CaOx CaOx / CaP CaP
1 0.00 0.00 0.23 0.13 0.58 0.00 0.00 0.03 0.04 0.48
2 0.00 0.00 0.96 0.96 0.51 0.00 0.00 0.16 0.05 0.15
3 0.94 0.82 0.22 0.01 0.01 0.00 0.00 0.01 0.00 0.00
4 0.00 0.00 0.86 0.90 0.86 0.01 0.00 0.04 0.00 0.02
5 0.00 0.00 1.00 1.00 0.53 0.00 0.00 0.11 0.18 0.43
6 0.00 0.00 0.21 0.20 0.16 0.00 0.00 0.17 0.15 0.09
7 0.00 0.00 0.10 0.09 0.67 0.00 0.00 0.00 0.03 0.28
8 0.00 0.00 0.95 0.94 0.66 0.00 0.00 0.87 0.86 0.14
9 0.00 0.00 0.15 0.17 0.48 0.00 0.00 0.02 0.00 0.05
10 0.00 0.00 0.08 0.00 0.03 0.00 0.00 0.09 0.08 0.58
11 0.00 0.00 0.10 0.10 0.40 0.00 0.00 0.04 0.00 0.02
12 0.00 0.00 1.00 1.00 0.62 0.00 0.00 0.75 0.46 0.78
13 0.00 0.00 0.45 0.15 0.19 0.00 0.00 0.12 0.00 0.01
14 0.00 0.00 0.61 0.82 0.85 0.00 0.00 0.08 0.12 0.42
15 0.00 0.00 0.52 0.24 0.39 0.00 0.00 0.07 0.04 0.08
16 0.00 0.00 1.00 1.00 0.78 0.00 0.00 0.35 0.33 0.54
17 0.00 0.00 0.98 0.97 0.66 0.00 0.00 0.09 0.03 0.08
18 0.00 0.00 0.96 0.95 0.38 0.00 0.00 0.24 0.22 0.43
19 0.00 0.00 0.04 0.21 0.54 0.00 0.00 0.30 0.73 0.59
20 0.00 0.00 0.99 0.99 0.97 0.00 0.00 0.25 0.23 0.23
21 0.00 0.00 0.97 0.99 0.92 0.00 0.00 0.86 0.97 0.80
22 0.00 0.00 0.45 0.03 0.02 0.00 0.00 0.74 0.66 0.18
23 0.00 0.00 0.99 0.99 0.31 0.00 0.00 0.99 0.99 0.10
IBJU| USE OF THE PROBABILITY OF STONE FORMATION (PSF) SCORE TO ASSESS
512
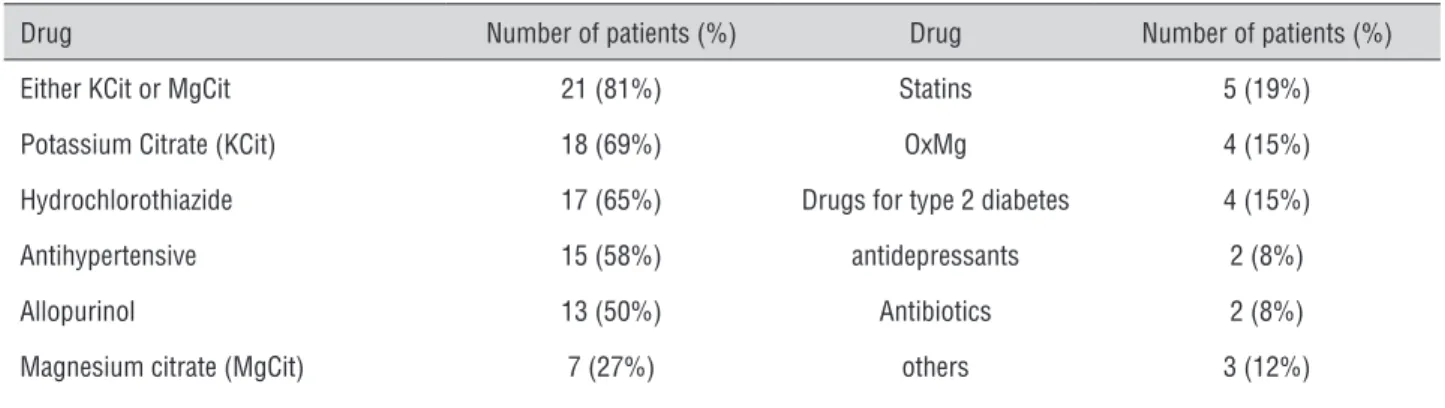
Table 3 - Medications used by patients in the cohort following baseline evaluation.
Drug Number of patients (%) Drug Number of patients (%)
Either KCit or MgCit 21 (81%) Statins 5 (19%)
Potassium Citrate (KCit) 18 (69%) OxMg 4 (15%)
Hydrochlorothiazide 17 (65%) Drugs for type 2 diabetes 4 (15%)
Antihypertensive 15 (58%) antidepressants 2 (8%)
Allopurinol 13 (50%) Antibiotics 2 (8%)
Magnesium citrate (MgCit) 7 (27%) others 3 (12%)
REFERENCES
1. Romero V, Akpinar H, Assimos DG: Kidney stones: a global
picture of prevalence, incidence, and associated risk factors. Rev Urol. 2010; 12: e86-96.
2. Turney BW, Reynard JM, Noble JG, Keoghane SR: Trends in
urological stone disease. BJU Int. 2012; 109: 1082-7.
3. Scales CD Jr, Smith AC, Hanley JM, Saigal CS; Urologic Diseases in America Project: Prevalence of kidney stones in the United States. Eur Urol. 2012; 62: 160-5.
4. Boyce CJ, Pickhardt PJ, Lawrence EM, Kim DH, Bruce RJ:
Prevalence of urolithiasis in asymptomatic adults: objective determination using low dose noncontrast computerized tomography. J Urol. 2010; 183: 1017-21.
5. Robertson WG: Stone-formation in the Middle Eastern Gulf
States – a review. Arab J Urol. 2012; 10: 265-72.
6. Worcester EM, Coe FL: Clinical practice. Calcium kidney stones. N Engl J Med. 2010 2; 363: 954-63.
7. Saigal CS, Joyce G, Timilsina AR; Urologic Diseases in America
Project: Direct and indirect costs of nephrolithiasis in an employed population: opportunity for disease management? Kidney Int. 2005; 68: 1808-14.
8. Pearle MS, Calhoun EA, Curhan GC; Urologic Diseases of America Project: Urologic diseases in America project: urolithiasis. J Urol. 2005; 173: 848-57.
9. Curhan GC, Willett WC, Knight EL, Stampfer MJ: Dietary factors
and the risk of incident kidney stones in younger women: Nurses’ Health Study II. Arch Intern Med. 2004 26; 164: 885-91. 10. Taylor EN, Stampfer MJ, Curhan GC: Obesity, weight gain, and
the risk of kidney stones. JAMA. 2005 26; 293: 455-62. 11. Taylor EN, Stampfer MJ, Curhan GC: Dietary factors and the risk
of incident kidney stones in men: new insights after 14 years of follow-up. J Am Soc Nephrol. 2004; 15: 3225-32.
12. Borghi L, Schianchi T, Meschi T, Guerra A, Allegri F, Maggiore U, Novarini A: Comparison of two diets for the prevention of recurrent stones in idiopathic hypercalciuria. N Engl J Med. 2002 10; 346: 77-84.
13. Strohmaier WL: Economic aspects of evidence-based metaphylaxis. Urologe A. 2006; 45: 1406-9.
14. Goldfarb DS, Coe FL: Prevention of recurrent nephrolithiasis. Am Fam Physician. 1999 15; 60: 2269-76.
15. Robertson WG: Is prevention of stone recurrence financially worthwhile? Urol Res. 2006; 34: 157-61.
16. Robertson WG: Measurement of ionized calcium in biological fluids. Clin Chim Acta. 1969; 24: 149-57.
17. Werness PG, Brown CM, Smith LH, Finlayson B: EQUIL2: a BASIC computer program for the calculation of urinary saturation. J Urol. 1985; 134: 1242-4.
18. Tiselius HG, Larsson L: Biochemical evaluation of patients with urolithiasis. Eur Urol. 1981; 7: 31-4.
19. Tiselius HG: A simplified estimate of the ion-activity product of calcium phosphate in urine. Eur Urol. 1984; 10: 191-5.
20. Laube N, Hergarten S, Hoppe B, Schmidt M, Hesse A: Determination of the calcium oxalate crystallization risk from urine samples: the BONN Risk Index in comparison to other risk formulas. J Urol. 2004; 172: 355-9.
21. Shekarriz B, Stoller ML: Uric acid nephrolithiasis: current concepts and controversies. J Urol. 2002; 168: 1307-14. 22. Robertson WG, Peacock M, Heyburn PJ, Marshall DH, Clark PB:
Risk factors in calcium stone disease of the urinary tract. Br J Urol. 1978; 50: 449-54.
23. Robertson WG: A risk factor model of stone-formation. Front Biosci. 2003; 8: s1330-8.
______________________ Correspondence address: