Test-Retest of Long Latency Auditory Evoked
Potentials (P300) with Pure Tone and Speech Stimuli
Ana Paula Perez
1,2Karin Ziliotto
1Liliane Desgualdo Pereira
11Department of Phonoaudiology, Escola Paulista de Medicina
-UNIFESP, São Paulo, SP, Brazil
2Department of Phonoaudiology Specialization, Universidade Federal
Fluminense, Nova Friburgo, Rio de Janeiro, RJ, Brazil
Int Arch Otorhinolaryngol 2017;21:134–139.
Address for correspondence Ana Paula Perez, PhD, Universidade Federal Fluminense - FEF (Formação específica em Fonoaudiologia), Rua Dr. Silvio Henrique Braunie 22 Nova Friburgo Rio de Janeiro 28625650, Brazil (e-mail: [email protected]).
Introduction
Long latency auditory evoked potentials (LLAEP) have been used to monitor neurophysiological changes that compro-mise the cortical regions of the auditory pathway, in relation to skills such as cognitive processing, memory, attention, and auditory discrimination.
The P300 is considered an endogenous potential, since it reflects the individual’s functional use of the stimulus and does not depend directly on their physical characteristics.1It is related to cognitive skills, perception, and attention. The P3 component occurs when individuals consciously recognize a change in auditory stimulus.2,3
Keywords
►
event-related
►
potentials
►
auditory perception
►
reliability
►
evoked potentials
Abstract
Introduction
Long latency auditory evoked potentials, especially P300, have been
used for clinical evaluation of mental processing. Many factors can interfere with
Auditory Evoked Potential - P300 results, suggesting large intra and inter-subject
variations.
Objective
The objective of the study was to identify the reliability of P3 components
(latency and amplitude) over 4
–
6 weeks and the most stable auditory stimulus with the
best test-retest agreement.
Methods
Ten normal-hearing women participated in the study. Only subjects without
auditory processing problems were included. To determine the P3 components, we
elicited long latency auditory evoked potential (P300) by pure tone and speech stimuli,
and retested after 4
–
6 weeks using the same parameters. We identi
fi
ed P300 latency
and amplitude by waveform subtraction.
Results
We found lower coef
fi
cient of variation values in latency than in amplitude,
with less variability analysis when speech stimulus was used. There was no signi
fi
cant
correlation in latency measures between pure tone and speech stimuli, and sessions.
There was a signi
fi
cant intrasubject correlation between measures of latency and
amplitude.
Conclusion
These
fi
ndings show that amplitude responses are more robust for the
speech stimulus when compared with its pure tone counterpart. The P300 indicated
stability for latency and amplitude measures when the test-retest was applied. Reliability
was higher for amplitude than for latency, with better agreement when the pure tone
stimulus was used. However, further research with speech stimulus is needed to clarify
how these stimuli are processed by the nervous system.
received
March 16, 2016
accepted
March 28, 2016
published online
April 26, 2016
DOI http://dx.doi.org/ 10.1055/s-0036-1583527.
ISSN 1809-9777.
Copyright © 2017 by Thieme-Revinter Publicações Ltda, Rio de Janeiro, Brazil Original Research
The exact location of the origin of the P300 wave remains unknown. The possible neural generators of N200 and P300 waves result from the joint participation of several neural structures, that is, multiple generators. They involve areas of the supratemporal auditory cortex (N2), frontal cortex, and hippocampus (P300).3,4LLAEPs evaluate the cortical activity involved in discrimination, integration, and attention skills.3,5 To elicit the P300, a wide variety of paradigms have been used, of which the“oddball”paradigm is the most utilized. In a process of active attention, different stimuli, with the same modality and different characteristics,6 are presented in a series such that one of them occurs relatively infrequently, that is, the oddball.7
The amplitude of the P300 wave is highly influenced by individual characteristics and latency over the time neural activity takes to travel along the auditory pathway, including time spent in synaptic transmission and neural conduction.8 Several authors9–17have demonstrated that P300 latency and/or amplitude values in normal adults are replicable and stable, with no statistically significant test-retest differences at different time intervals. By contrast, other studies18,19have exhibited test-retest variability in the P300 wave.
Studies have reported that a large number of factors can interfere in P300 results, although without reaching consen-sus. Primarily the attention component,3,4stimulus intensity interferes directly in measures of wave amplitude and latency.20Advancing age leads to variations in P300 values such as increased latency,21,22 decreased amplitude,23 and cognitive development.24 In children, the development changes observed in AEPs are related not only to anatomical and functional elements, but also to organizational patterns that occur with behavior and learning.24 Normal variation results from the association between age and cognitive maturity.3,24–26There are also reports of sex and menstrual cycle interference.19,27
In light of the vast clinical applications of LLAEPs and the significant intra and interindividual variation, the test-retest stability of the P300 wave should be investigated.
Objective
The aim of the present study was to analyze test-retest (4–6 weeks apart) amplitude and latency variability of the P300 wave, using different auditory stimuli (pure tone and speech) in young adult women, without auditory processing disorders (APD).
Methods
The study was approved under protocol number 1376/11, and all participants gave their informed consent.
Participants
We selected the sample by convenience and was justified by the profile of students in the speech therapy course. Ten women, non-smoking, ranging in age between 17 and 30 years participated in the study.
As for some studies’conclusion that menstrual cycle and use of oral contraceptives do not affect the P300 wave or other
ERP components,28–30 we decided against controlling this variable.
Inclusion criteria were having a normal peripheral audito-ry system and auditoaudito-ry processing. Exclusion criteria were the presence of hearing loss, history of neurological and/or cognitive disorders, and the use of drugs acting on the central nervous system. Subjects received orientation for testing of AEPs as follows: avoid taking tea, coffee, and chocolate in the preceding 24 hours.
Procedures
The individuals underwent a basic audiological assessment consisting of tonal audiometry, vocal audiometry, and imitanci-ometry. Next, auditory processing behavior was assessed as a diagnostic criterion and only individuals with no auditory processing disorders were included in the present study.
LLAEP- P300 was recorded with a two-channel Smart EP USB Jr system (Intelligent Hearing System, Miami, USA), in a quiet setting. We placed electrodes on the vertex (Cz) and on each side of the ear (A1for the left ear and A2for the right ear), with the ground electrode (Fpz) on the forehead, in accordance with the international 10–20 system.31We assessed the right and left ears separately, using ER-3A insert earphones. Skin was cleansed with gauze and abrasive paste. Surface electrodes were then placed over electrolytic paste (for optimizing elec-trical conductivity) andfixed with microporous adhesive tape. Accepted electrode impedance was up tofive ohms, with a difference of up to two ohms between electrodes.
We used the following parameters to acquire P300: 300 monaural acoustic stimuli at frequencies of 1000 Hz for the frequent (85%) and 2000 Hz for the rare (15%), intensity of 75 dB SPL; recording window of 510 milliseconds; filter between 1 (high-pass) and 30 Hz (low-pass); speed presen-tation of 1.1 stimuli per second. Rare and frequent stimuli were randomly presented (oddball paradigm).7Individuals remained seated and were instructed to pay attention and count out loud the number of occurrences of the rare stimu-lus, and to avoid artifact contamination caused by eye move-ment, subjects were asked to keep their eyes fixed on a target.32After we recorded P300 results with the pure tone, we elicited P300 by speech, using the same parameters. The /DA/ and /BA/ syllables were used for the rare and frequent acoustic stimulus, respectively.
We performed the analysis of P300 by waveform subtrac-tion. The third waveform resulted from subtracting the frequent from the rare waveform, and we selected the wave with the highest positive peak after the N1-P2-N2 com-plex.5,24We marked the latency and amplitude of P300 on this curve. To obtain amplitude values of the P300 wave, the cursor was placed on the positive polarity wave (P300) as far as the negative polarity (N2). The latency reference values used were 225 to 365msec,3while those for amplitude ranged between 5 and 20 micro V.4
Statistical Analysis
Pearson’s coefficient of variation, a measure of relative dispersion used to estimate the accuracy of experiments, represents the standard deviation expressed in percentage of the mean. Inferential analysis involved the following methods: Intra-subject agreement regarding measures of latency and amplitude was assessed by the intraclass corre-lation coefficient (ICC),33 and we analyzed the variation in these measures between stimuli (pure tone and speech) or between the left and right ears using the Wilcoxon signed-rank test.
We evaluated the normal distribution of latency and amplitude measures by the Shapiro-Wilks test. We adopted a 5% significance level, and processed the statistical analysis using SAS 6.11 software (SAS Institute, Inc., Cary, North Carolina).
Results
We studied latency (msec) and amplitude (μV) of the P300 wave in response to right and left ear stimulation for each variable (acoustic stimulus) and between sessions. We found no statistically significant differences between the right and left ears, in the electrophysiological assessment of AEP-P300. Thus, we grouped the ears (n¼20) for analyses.
Lower coefficient of variation values was found for latency, indicating that this is a more accurate measure, that is, with less response variability. The coefficient of variation of latency with speech stimulus was lower than that using pure tone (►Table 1). The values obtained were similar at the two assessment sessions, with a lower mean for speech stimulus than pure tone. The variation in latency between pure tone and speech stimuli exhibited a descriptive level of p¼0.75 at test andp¼0.17 at retest, that is, no significant variation between assessments.
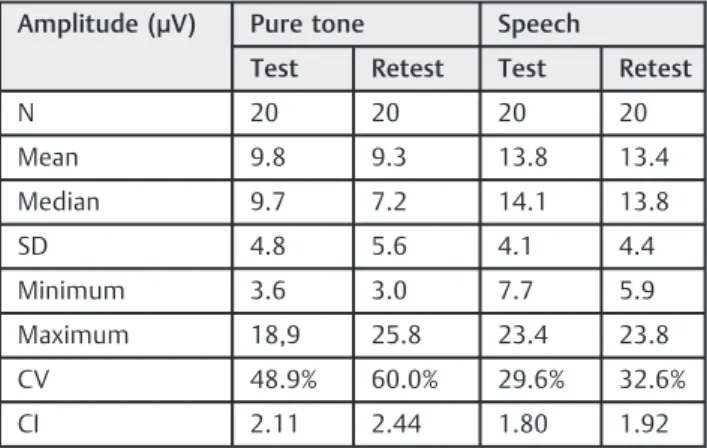
►Table 2shows that measures of amplitude were similar between sessions, and that the mean values found for the pure tone stimulus were lower than those obtained for the speech stimulus. The coefficient of variation was more
accurate using the speech than the pure tone stimulus. At the 5% level, there was a significant increase in amplitude using the speech stimulus compared with the pure tone, for p¼0.0003 at test andp¼0.004 at retest.
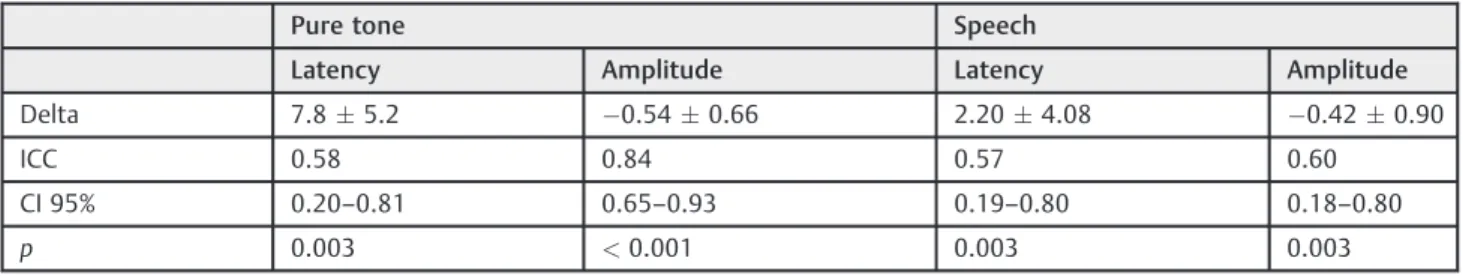
The intraclass correlation coefficient (ICC) was used to determine intrasubject agreement on the test-retest with measures of latency and amplitude using pure tone and speech stimuli.►Table 3contains the intraclass correlation coefficient (ICC), its respective 95% confidence interval (CI) and p-value for the measures of latency and amplitude. A significance value of 1% was considered to obtain more robust interpretations.
There was statistical significance for intra-subject test-retest, in measures of latency and amplitude. Agreement for latency was moderate, using both auditory stimuli. For amplitude, agreement was excellent for pure tone and good for speech.
►Figs. 1and2illustrate the distribution of P300 amplitude and latency, for pure tone and speech stimuli between sessions.
Discussion
Normative data collected during the present study reflect that the P300 wave was significantly stable between sessions. The reliabilities found generally correspond well to those reported by others.
Ears were grouped (n¼20) since between the ears P300 latency and amplitude showed no statistically significant difference.
Mean latency of the P300 wave in the test-retest for the pure tone was 279.6msec and 287.3msec, respectively, and for the speech stimulus 276.7msec and 278.9msec. The mean values obtained were lower than in other studies with normal adults, all of which reported a mean of more than 300msec.10,11,17,19,27,34 This disagreement may have occurred in the present study because auditory processing behavior was assessed, thereby reducing the interference of difficulties in the perceptual proc-essing of auditory information in the nervous system.
Table 2 Measures of P300 amplitude with pure tone and speech stimuli, at test and retest
Amplitude (µV) Pure tone Speech
Test Retest Test Retest
N 20 20 20 20
Mean 9.8 9.3 13.8 13.4
Median 9.7 7.2 14.1 13.8
SD 4.8 5.6 4.1 4.4
Minimum 3.6 3.0 7.7 5.9
Maximum 18,9 25.8 23.4 23.8
CV 48.9% 60.0% 29.6% 32.6%
CI 2.11 2.44 1.80 1.92
Abbreviations: CI, confidence interval; CV, coefficient of variation; n of subjects, number of subject; SD, standard deviation.
Table 1 Measures of P300 latency with pure tone and speech stimuli, at test and retest
Latency (msec)
Pure tone Speech
Test Retest Test Retest
n 20 20 20 20
Mean 279.6 287.3 276.7 278.9
Median 275.5 291.5 276.5 277.0
SD 26.0 25.8 17.9 20.6
Minimum 241 241 254 248
Maximum 323 327 306 324
CV 9.3% 9.0% 6.5% 7.4%
CI 11.39 11.29 7.85 9.04
The variation in latency was between 241msec and 327msec with the pure tone and 248msec and 324msec with speech. The values obtained are within the range proposed in the literature3for adolescents and adults (17 to 30 years). There was a slight increase in the general latency mean in the retest for both stimuli, which also occurred in another study that analyzed test-retest using the pure tone stimulus.19 The results suggest that there was no learning effect in the second assessment, the task did not become easier, and non-auditory factors such as attention and lack of motivation may have influenced the response. These data disagree with severalfindings that showed a slight decline in latency in the second assessment.10,12,14,17The authors put forward several factors to explain the changes observed, such as the learning effect or a decrease in task difficulty due to previous experience, reduced anxiety, and greater fatigue control.10,12
Pure tone amplitude exhibited mean values of 9.8µV and 9.3µV in the test-retest, respectively, with a minimum value of 3.0µV and maximum of 25.8µV. For the speech stimulus the means were 13.8µV (test) and 13.4µV (retest), with a mini-mum of 5.9µV and maximini-mum of 23.8µV. The minimini-mum and maximum amplitude values obtained in the sample are outside the ranges between 10 and 20µV2and between 5 and 20µV4suggested in the literature. However, they agree with another study27that used a pure tone stimulus to assess adult women, where amplitude ranges were between 3.24µV
and 24.9µV. This greater variability in responses may be due to interference from the menstrual cycle, which was not controlled in the present study and, according to the authors, can influence amplitude values.19,27
The auditory stimuli used exhibited a statistically signifi -cant difference in response values, with higher speech amplitudes. Test-retest analysis showed no statistical differ-ence between-session, indicating that the wave exhibited no habituation process.14 The physiology of the P300 wave is controversial, but there are literature reports that P300 amplitude is correlated with the number of neural sources that the attention system needs to perform the task, and can be used to infer the difficulty in detecting and discriminating the stimulus.35,36In relation to task difficulty, it is suggested that amplitudes be higher for easier discrimination tasks, and lower for more difficult tasks. Likewise, latency declines when the discrimination task is easier and rises for more difficult tasks.35
The data show that the speech stimulus generates a more robust response than a pure tone. Following the assumption of task complexity, this study exhibited greater facility with speech stimulus, showing lower latencies and higher ampli-tudes for the P300 wave. Ourfindings corroborate those of authors37that compared nonverbal and verbal stimuli. They used one word (mommy) as rare stimulus and a 1000 Hz tone as frequent stimulus. There was no statistically significant difference for P300 latency and P300 amplitudes were higher Table 3 Intra-subject agreement in measures of latency and amplitude with pure tone and speech stimuli
Pure tone Speech
Latency Amplitude Latency Amplitude
Delta 7.85.2 0.540.66 2.204.08 0.420.90
ICC 0.58 0.84 0.57 0.60
CI 95% 0.20–0.81 0.65–0.93 0.19–0.80 0.18–0.80
p 0.003 <0.001 0.003 0.003
Abbreviations: CI 95%, confidence interval of 95% for ICC; Delta, was expressed by the meanstandard error; ICC, intraclass correlation coefficient.
with verbal stimulus, with a statistically significant differ-ence. These results differ from those of another study38 showing a statistically significant difference with higher latency and lower P300 amplitude, when the verbal stimulus is used.
The use of speech stimulus showed a lower SD for both test sessions, as well as lower coefficient of variation values when compared with pure tones. These data suggest that the speech stimulus exhibits lower response variability for the P300 wave. Since most studies performed with LLAEP prioritized the use of nonverbal (pure tones) stimulus to capture the P300 wave, it is important that further studies be conducted to compare how these stimuli are processed by the nervous system, thereby contributing to understanding the different changes that can involve the auditory system.
The AEP-P300 indicated stable latency and amplitude measures on the test-retest, with statistically significant agreement. Reliability of P300 amplitude was higher than latency in the present study, as well as in earlier investiga-tions.10,11,14,15,17P300 reliability was assessed in other stud-ies and considered satisfactory at different time intervals, such as intrasession,13–15 days,10,14,15 months,14 and years.13,16,17The results indicate that P300 amplitude, calcu-lated based on the difference between waves, is a stable marker for assessment between sessions, with better repro-ducibility for the pure tone stimulus. The greater reliability and methodological advantages of amplitude in relation to latency should encourage future efforts to clarify its func-tional significance.
Several studies11,13–15,17 have investigated P300 reli-ability, using the auditory oddball paradigm, with record-ings at the Cz site, and reported intersession reliability (Pearson’s correlation coefficient) for P300 latency ranging from 0.48 to 0.73, and amplitude between 0.51 and 0.62.13–15,17 Studies that conduct a retest at the same session, with recordings at Cz, obtained values ranging between 0.43 and 0.93 for latency10,11,13–15,17 and 0.50 and 0.89 for amplitude.11,13–15,17For young adults, studies have shown satisfactory correlation for the retest at the same session or with intervals. However, correlations were slightly higher when they were retested at the same session than with intervals of years. It is believed that when participants return to a new session after a period of time, they may be in another state, that is, more or less tired, alert, healthy, among others, which suggests lower correlation with higher time intervals.17
The correlation coefficients for latency using both auditory stimuli in the present study are within the range reported in the literature,15indicating moderate agreement. For analysis of amplitude, agreement was excellent for pure tones and good for speech. This study obtained high response reproduc-ibility, confirming that the P300 wave is a reliable measure, with significant stability in repetition measures, as well as for observing differences caused by physiological changes.10 Thesefindings are in agreement with the literature, which indicates good reliability in P300 measures, in normal young adults, when test-retest is conducted, and favor its applica-tion for the study of normal and altered cognitive processes.
Conclusion
In conclusion, the present study provided data indicating more robust amplitude responses for the speech stimulus when compared with pure tones, with a statistically signifi -cant difference. The LLAEP-P300 exhibited stability in latency and amplitude measures when the test-retest is applied, and statistically significant agreement. Amplitude reliability was higher than that of latency, with excellent agreement when the pure tone stimulus was used.
References
1 Sutton S, Braren M, Zubin J, John ER. Evoked-potential correlates of stimulus uncertainty. Science 1965;150(3700):1187–1188 2 Musiek FE, Baran JA, Pinheiro ML. Neuro-Audiology: Case Studies.
San Diego: Singular Publishing Company; 1994:20–21
3 McPherson DL. Late potentials of the auditory system. San Diego: Singular Publishing Group, Inc.; 1996
4 Hall JW. Handbook of auditory evoked responses. 3nd ed. Massa-chusetts (Boston): Allyn and Bacon; 1990
5 Kraus N, McGee T. Potenciais auditivos de longa latência. In: Katz J. Tratado de audiologia clínica. São Paulo: Manole; 1999:403–20 6 Duarte JL, Alvarenga KdeF, Banhara MR, Melo AD, Sás RM, Costa
Filho OA. P300-long-latency auditory evoked potential in normal hearing subjects: simultaneous recording value in Fz and Cz. Braz J Otorhinolaryngol 2009;75(2):231–236
7 Squires NK, Squires KC, Hillyard SA. Two varieties of long-latency positive waves evoked by unpredictable auditory stimuli in man. Electroencephalogr Clin Neurophysiol 1975;38(4):387–401 8 Eggermont JJ. Electric and magneticfields of synchronous neural
activity. In: Burkard RF, Don M, Eggermont JJ (Eds.). Auditory evoked potentials. Baltimore: Lippincott William & Wilkins; 2006:2–21
9 Polich J, Howard L, Starr A. P300 latency correlates with digit span. Psychophysiology 1983;20(6):665–669
10 Sklare DA, Lynn GE. Latency of the P3 event-related potential: normative aspects and within-subject variability. Electroencepha-logr Clin Neurophysiol 1984;59(5):420–424
11 Polich J. Normal variation of P300 from auditory stimuli. Electro-encephalogr Clin Neurophysiol 1986;65(3):236–240
12 Kileny PR, Kripal JP. Test-retest variability of auditory event-related potentials. Ear Hear 1987;8(2):110–114
13 Segalowitz SJ, Barnes KL. The reliability of ERP components in the auditory oddball paradigm. Psychophysiology 1993;30(5): 451–459
14 Kinoshita S, Maeda H, Nakamura J, Kodama E, Morita K. Reliability of the probability effect on event-related potentials during repeat-ed testing. Kurume Mrepeat-ed J 1995;42(4):199–210
15 Kinoshita S, Inoue M, Maeda H, Nakamura J, Morita K. Long-term patterns of change in ERPs across repeated measurements. Physiol Behav 1996;60(4):1087–1092
16 Sandman CA, Patterson JV. The auditory event-related potential is a stable and reliable measure in elderly subjects over a 3 year period. Clin Neurophysiol 2000;111(8):1427–1437
17 Walhovd KB, Fjell AM. One-year test-retest reliability of auditory ERPs in young and old adults. Int J Psychophysiol 2002;46(1): 29–40
18 Matas CG, Hataiama NM, Gonçalves IC. Estabilidade dos potenciais evocados auditivos em indivíduos adultos com audição normal. Rev Soc Bras Fonoaudiol. 2011;16:37–41
20 Covington JW, Polich J. P300, stimulus intensity, and modality. Electroencephalogr Clin Neurophysiol 1996;100(6):579–584 21 Goodin DS, Squires KC, Henderson BH, Starr A. Age-related variations
in evoked potentials to auditory stimuli in normal human subjects. Electroencephalogr Clin Neurophysiol 1978;44(4):447–458 22 Polich J. P300 in clinical applications: meaning, method, and
measurement. Am J EEG Technol 1991;31(3):201–231
23 Verleger R, Neukäter W, Kömpf D, Vieregge P. On the reasons for the delay of P3 latency in healthy elderly subjects. Electroence-phalogr Clin Neurophysiol 1991;79(6):488–502
24 Polich J, Ladish C, Burns T. Normal variation of P300 in children: age, memory span, and head size. Int J Psychophysiol 1990;9(3):237–248 25 Squires K, Goodin D, Starr A. Event-related potentials in develop-ment, aging and dementia. In: Lehman D, Callaway E, eds. Human evoked potentials. New York: Plenum Publishing Co; 1979 26 Musiek FE. Probing brain function with acoustic stimuli. ASHA
1989;31(8):100–106, 55
27 Machado CSS, Carvalho ACO, Silva PLG. Standard characterization of P300 in young adults. Rev Soc Bras Fonoaudiol. 2009;14(1):83–90 28 Fleck KM, Polich J. P300 and the menstrual cycle.
Electroencepha-logr Clin Neurophysiol 1988;71(2):157–160
29 Fagan PL, Church GT. Effect of the menstrual cycle on the auditory brainstem response. Audiology 1986;25(6):321–328
30 Howard R, Mason P, Taghavi E, Spears G. Brainstem auditory evoked responses (BAERs) during the menstrual cycle in women
with and without premenstrual syndrome. Biol Psychiatry 1992; 32(8):682–690
31 Jasper HH. Report of the committee on methods of clinical examination in electroencephalography. Eletroenceph Clin Neu-rophysiol. 1958;10:370–375
32 Vaughan HG Jr, Ritter W. The sources of auditory evoked responses recorded from the human scalp. Electroencephalogr Clin Neuro-physiol 1970;28(4):360–367
33 Bartko JJ, Carpenter WT Jr. On the methods and theory of reliability. J Nerv Ment Dis 1976;163(5):307–317
34 Schochat E, Matas CG, Samelli AG, Mamede Carvallo RM. From otoacoustic emission to late auditory potentials P300: the inhibi-tory effect. Acta Neurobiol Exp (Warsz) 2012;72(3):296–308 35 Polich J. Task difficulty, probability, and inter-stimulus interval as
determinants of P300 from auditory stimuli. Electroencephalogr Clin Neurophysiol 1987;68(4):311–320
36 Kok A. On the utility of P3 amplitude as a measure of processing capacity. Psychophysiology 2001;38(3):557–577
37 Lew HL, Slimp J, Price R, Massagli TL, Robinson LR. Comparison of speech-evoked v tone-evoked P300 response: implications for predicting outcomes in patients with traumatic brain injury. Am J Phys Med Rehabil 1999;78(4):367–371