Relationship between visual prostate score (VPSS) and
maximum flow rate (Q
max) in men with urinary tract
symptoms
_______________________________________________
Mazhar A. Memon
1, M. Hammad Ather
11 Aga Khan University, Surgery karachi, Sind, Pakistan
ABSTRACT
ARTICLE
INFO
______________________________________________________________ ______________________
Objective: To evaluate correlation between visual prostate score (VPSS) and maximum flow rate (Qmax) in men with lower urinary tract symptoms.
Material and Methods: This is a cross sectional study conducted at a university Hospital. Sixty-seven adult male patients>50 years of age were enrolled in the study after signing an informed consent. Qmax and voided volume recorded at uroflowmetry graph and at the same time VPSS were assessed. The education level was assessed in various defined groups. Pearson correlation coefficient was computed for VPSS and Qmax.
Results: Mean age was 66.1±10.1 years (median 68). The mean voided volume on
uro-flowmetry was 268±160mL (median 208) and the mean Qmax was 9.6±4.96mLs/sec (me-dian 9.0). The mean VPSS score was 11.4±2.72 (11.0). In the univariate linear regression analysis there was strong negative (Pearson’s) correlation between VPSS and Qmax (r=-848, p<0.001). In the multiple linear regression analyses there was a significant correla-tion between VPSS and Qmax (β-http://www.blogapaixonadosporviagens.com.br/p/caribe. html after adjusting the effect of age, voided volume (V.V) and level of education. Mul-tiple linear regression analysis done for independent variables and results showed that there was no significant correlation between the VPSS and independent factors including age (p=0.27), LOE (p=0.941) and V.V (p=0.082).
Conclusion: There is a significant negative correlation between VPSS and Qmax. The VPSS can be used in lieu of IPSS score. Men even with limited educational background can complete VPSS without assistance.
Key words:
IPSS; Prostate; Urinary Tract; Lower Urinary Tract Symptoms
Int Braz J Urol. 2016; 42: 321-6
_____________________
Submitted for publication: January 16, 2015
_____________________
Accepted after revision: June 28, 2015
INTRODUCTION
Lower Urinary Tract Symptoms (LUTS) are common among both aging men and women (1, 2). In several communities based studies it has been reported that LUTS are more common among individuals more than 50 years of age. LUTS are now recognized to be multifactorial. They may be related to body habitus dietary intake, fluid intake and alcohol consumption, age related and from
LUTS, IPSS is the most preferred one (8, 9).
One of the most significant causes of male LUTS is obstruction; uroflowmetry (UFM) is a sim-ple and non-invasive tool to assess obstruction. UFM determines volume of urine passed per unit of time. It has numeric and graphic representa-tion, which evaluates multiple parameters out of which Voided Volume (VV) and Maximum Flow Rate (Qmax), the most important (10). It has been observed that 30-70% of men can not complete the IPSS because the questions are difficult to un-derstand as they are wordy and people with lower level of education can not complete it (11, 12). In order to obviate these difficulties, Visual Prostra-te Symptoms Score (VPSS) has been introduced. VPSS is a pictorial assessment version of IPSS (1). There is dearth of data on the utility of VPSS in men presumed to have benign prostatic obstruc-tion (BPO). The current study aims to study the re-lationship between VPSS and maximum flow rate (Qmax) in men with lower urinary tract symptoms related to BPO.
MATERIALS AND METHODS
The study was conducted at a tertiary care hospital in a developing country from March 2013 to July 2013. Prior approval was obtained from Institutional Ethical Review board for the study. The prospective approach was taken and cross--sectional study design was used. In order to re-cruit participants, non-probability sampling i.e. consecutive sampling strategy was used. Sam-ple size of 67 was determined using r=0.36 and 1-α=95%. Inclusion and exclusion criteria were pre-determined. Participants who were male and were more than 50 years old with voided volu-me of>150mL were included. Participants who were unable to fill out the form due to mental or psychological disturbances, patients who refu-sed to participate, patients who could not undergo UFM and patients who experienced other causes including neurogenic bladder or meatal stenosis were excluded from the study.
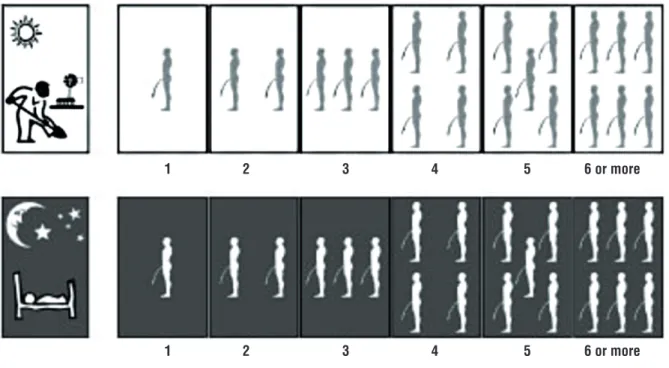
The data collected included demographic information of participants. In addition, it inclu-ded VPSS (Figure-1) (http://www.einj.org/journal/
Level of education was operationally categorized into five categories that included Primary (Gra-de 1 to 5), Middle (Gra(Gra-de 6 to 8), High (Gra(Gra-de 9 and 10 leading to Secondary School Certificate), Intermediate (Grade 11 and 12 leading to Higher Secondary School Certificate), and University pro-grams leading to undergraduate and graduate de-grees. Data was entered and analyzed using SPSS version 19. Mean, median, and standard deviation was computed for continuous variables. Percen-tages and proportion was computed for categori-cal variables. Pearson correlation coefficient was computed for VPSS and Qmax. Moreover, multiple linear relationships were computed to identify re-lationship between VPSS and Qmax.
RESULTS
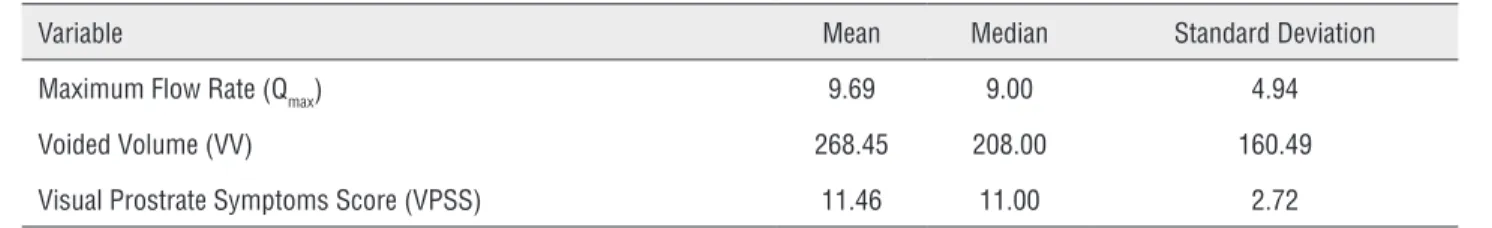
In total, 67 participants were recruited. The age of study participants ranged from 66–68±10 years. Around 48% of the study participants were not educated, whereas 22% were up to high gra-de and 30% were Intermediate and above. The mean Qmax was 9.69±4.94mL/sec. The mean voi-ded volume recorvoi-ded for study participants was 268.45±160.49mL. Moreover, the mean VPSS re-corded was 11.46±2.72 (Table-1).
In order to identify the relationship betwe-en VPSS and Qmax, Pearson correlation revealed strong negative relationship (r=-0.848, P<0.001) among these variables. The univariate linear re-gression analysis revealed that both Qmax (P<0.001) and VV (P=0.036) were significantly associa-ted with VPSS. Moreover, multivariate regres-sion analysis revealed significant relationship (P <0.001) between VPSS and Qmax while adjusting for the effect of age, VV and level of education (Table-2).
DISCUSSION
Figure 1 - Pictorial display of the visual IPSS (VPSS score), assessing daytime and nighttime frequency, flow rate and QoL.
1 2 3 4 5 6 or more
1 2 3 4 5 6 or more
0 1 2 3 4 5 6
Assessment of LUTS is essential to identi-fy and plan management. There are a number of tools available to evaluate LUTS. Among all tools, VPSS has proved to be an effective tool especially for less educated or not educated individuals. It has proved to be an effective tool to assist medi-cal practitioners in making treatment related deci-sions. In the current study half of the participants were not educated (14, 15).
In line with the findings of the current stu-dy, Van der Walt et al. also identified that VPSS correlated with Qmax. They recruited 96 participants over the period of one year. The identified rela-tionship was negative in nature. They also suppor-ted that VPSS is a reliable tool for assessing sub-jective symptoms of patients experiencing LUTS (13). Similarly, other studies have also reported significant association between VPSS and Qmax. In our study, the total number of patients was 67 and it was a six months study whereas in previous stu-dies the time period was at least of one year. Yeon Won Park et al. have the highest participant num-ber of 240 and our study was done only during
colleagues (17) similarly noted in rural Indonesian areas that VPSS correlated significantly with the IPSS and could be completed without assistance by a greater proportion of men with low levels of education.
It has been proven that patients defined their symptoms accurately proving the strength of VPSS scoring system. Moreover, this can also be interpreted that the patient understands pic-togram of VPSS in a proper manner. The actual VPSS score is 23 but as we have excluded the factor quality of life, the total VPSS analysis was 17 instead of 23 and the reason for exclusion is defined above. The comparative study by Van der Walt et al. has weighed all components of VPSS but the drawback of that study is that they have not mentioned mean VPSS score. In our study mean VPSS was 11.4±2.72 and it is a valuable Fi-gure for interpretation. Whereas in another study conducted by Yeon Won Park the mean VPSS was 9, which is slightly lower when compared with our study, but comparable with other study con-ducted by Heyns et al. (14). In our study the mean
Table 1 - Descriptive Analysis of Study Variables.
Variable Mean Median Standard Deviation
Maximum Flow Rate (Qmax) 9.69 9.00 4.94
Voided Volume (VV) 268.45 208.00 160.49
Visual Prostrate Symptoms Score (VPSS) 11.46 11.00 2.72
Table 2 - Univariate and Multivariate Linear Regression Analysis.
Variable Odds Ratio Confidence Interval (95%) P-value
Univariate Linear Regression
Maximum Flow Rate (Qmax) -0.47 -0.54, -0.39 <0.001
Voided Volume (VV) -0.004 -0.008, 0.00 0.036
Multivariate Linear Regression
Maximum Flow Rate (Qmax) -0.46 -0.54, -0.39 <0.001*
slightly lower compared to other studies. About 50 percent of our population was less educated and it was almost comparable to the other stu-died.
The findings of our study also revealed that age, voided volume and level of education are independent variables. After the multivaria-te analysis with VPSS we found that there was no significant difference between each other and the calculated P-value for age was 0.460, VV was 0.151 and for LOE P=0.999. Similarly, the study by Heyns et al. (14) also identified that there is no significant association between age and VPSS. In multivariate analysis, when Qmax was correla-ted to VPSS it was observed a significant p value (<0.0001). In our study there was strong negative correlation (-0.848) between VPSS and Qmax and when compared to the other studies it was more negative. Although IPSS and VPSS are predomi-nantly used in the evaluation of male LUTS se-condary to BPO, Wessel and Heynes (18) noted that they could be effectively used for urethral stricture related LUTS. They noted that VPSS cor-relates significantly with IPSS, Qmax, and urethral diameter in men with urethral stricture disease and takes significantly less time to complete. A combination of VPSS>8 and Qmax<15mL/s can be used to avoid further invasive evaluation during follow-up in men with urethral strictures.
Our study proved that level of education doesn’t have significant association with VPSS. This supports that less educated or uneducated patient can provide better conclusion when they filled these pictorial form of VPSS, which is used for objective evidence for LUTS. The main draw-back of our study is that we have not compared the VPSS with IPSS and also with other parame-ters of uroflowmetry.
CONCLUSIONS
The current study has shown a signifi-cant negative correlation between VPSS and Qmax. VPSS is a pictorial form rather than descriptive and can be completed without assistance by men with limited education.
CONFLICT OF INTEREST
None declared.
REFERENCES
1. Avasarala KA, Ahmed SM, Nandagiri S, Tadisetty S. Epidemiological differences of lower urinary tract symptoms among female subpopulations and group level interventions. Indian J Urol. 2008;24:498-503.
2. Homma Y, Kawabe K, Tsukamoto T, Yamanaka H, Okada K, Okajima E, et al. Epidemiologic survey of lower urinary tract symptoms in Asia and Australia using the international prostate symptom score. Int J Urol. 1997;4:40-6. Erratum in: Int J Urol 1997;4:232.
3. Berghmans LC, Hendriks HJ, Bo K, Hay-Smith EJ, de Bie RA, van Waalwijk van Doorn ES. Conservative treatment of stress urinary incontinence in women: a systematic review of randomized clinical trials. Br J Urol. 1998;82:181-91. 4. Oelke M, Bachmann A, Descazeaud A, Emberton M, Gravas
S, Michel MC, et al. EAU guidelines on the treatment and follow-up of non-neurogenic male lower urinary tract symptoms including benign prostatic obstruction. Eur Urol. 2013;64:118-40.
5. Boyle P, Robertson C, Mazzetta C, Keech M, Hobbs R, Fourcade R, et al. The relationship between lower urinary tract symptoms and health status: the UREPIK study. BJU Int. 2003;92:575-80.
6. Roehrborn CG. Benign prostatic hyperplasia: an overview. Rev Urol. 2005;7:S3-S14.
7. Irwin DE, Milsom I, Hunskaar S, Reilly K, Kopp Z, Herschorn S, et al. Population-based survey of urinary incontinence, overactive bladder, and other lower urinary tract symptoms in five countries: results of the EPIC study. Eur Urol. 2006;50:1306-14.
8. Agrawal CS, Chalise PR, Bhandari BB. Correlation of prostate volume with international prostate symptom score and quality of life in men with benign prostatic hyperplasia. Nepal Med Coll J. 2008;10:104-7.
9. Wadie BS, Ebrahim el-HE, Gomha MA. The relationship of detrusor instability and symptoms with objective parameters used for diagnosing bladder outlet obstruction: a prospective study. J Urol. 2002;168:132-4.
10. Ather MH, Memon A. Uroflowmetry and evaluation of voiding disorders. Tech Urol. 1998;4:111-7.
12. Johnson TV, Schoenberg ED, Abbasi A, Ehrlich SS, Kleris R, Owen-Smith A, et al. Assessment of the performance of the American Urological Association symptom score in 2 distinct patient populations. J Urol. 2009;181:230-7. 13. van der Walt CL, Heyns CF, Groeneveld AE, Edlin RS, van
Vuuren SP. Prospective comparison of a new visual prostate symptom score versus the international prostate symptom score in men with lower urinary tract symptoms. Urology. 2011;78:17-20.
14. Heyns CF, van der Walt CL, Groeneveld AE. Correlation between a new visual prostate symptom score (VPSS) and uroflowmetry parameters in men with lower urinary tract symptoms. S Afr Med J. 2012;102:237-40.
15. Wessels SG, Heyns CF. Prospective evaluation of a new visual prostate symptom score, the international prostate symptom score, and uroflowmetry in men with urethral stricture disease. Urology. 2014;83:220-4.
16. Park YW, Lee JH. Correlation between the visual prostate symptom score and international prostate symptom score in patients with lower urinary tract symptoms. Int Neurourol J. 2014;18:37-41.
17. Afriansyah A, Gani YI, Nusali H. Comparison between visual prostate symptom score and international prostate symptom score in males older than 40 years in rural Indonesia. Prostate Int. 2014;2:176-81.
18. Wessels SG, Heyns CF. Prospective evaluation of a new visual prostate symptom score, the international prostate symptom score, and uroflowmetry in men with urethral stricture disease. Urology. 2014;83:220-4.
_______________________ Correspondence address: