O R I G I N A L P A P E R
Hydrogeochemical and Flow Modeling of Aquitard
Percolation in the Cariri Valley-Northeast Brazil
Carlos Jose´ Freire MachadoÆMaria Marlu´cia Freitas SantiagoÆ
Luiz Alberto Ribeiro Mendonc¸aÆHorst FrischkornÆJosue´ Mendes Filho
Received: 17 March 2006 / Accepted: 5 June 2007 / Published online: 5 July 2007 Springer Science+Business Media B.V. 2007
Abstract Flow modeling and hydrogeochemical inversion calculations were performed on the aquifer systems of the Crato-Juazeiro Graben in the Araripe Sedimentary Basin of the Cariri Valley, Northeast Brazil, in order to assess aquifer interconnections through an aquitard of the Araripe Plateau. Steady state hydraulic head numeric calculations with the finite difference method used Modflow software with hydrologically based boundary conditions and a piezometric surface as initial condition. Hydrogeochemical inversion with PHREEQC was performed for two water samples representing typical initial and final waters along the flow path. Flow simulation shows that approximately 20% of all recharge water from the superior aquifer system passes through the Santana aquitard reaching the middle aquifer system. Quantification of mineral dissolution/precipitation processes, ion exchange and microbiological redox reactions taking place in the aquifer systems also
C. J. F. Machado
Universidade Federal do Para´/Campus de Santare´m, Fı´sica, PA CEP 68040-070, Brazil
e-mail: cjfm@ufpa.br
M. M. F. SantiagoJ. Mendes Filho
Depto. de Fı´sica, Universidade Federal do Ceara´, Fortaleza, Ceara CEP 60455-760, Brazil
M. M. F. Santiago
e-mail: marlucia@fisica.ufc.br L. A. R. Mendonc¸a
Depto. Hidrologia, CENTEC, Juazeiro do Norte, Fortaleza, Ceara´, Brazil
e-mail: martaluiz@yahoo.com.br H. Frischkorn (&)
Depto. Engenharia Hidra´ulica e Ambiental, Universidade Federal do Ceara´, Fortaleza, Ceara´, Brazil
e-mail: cariri@ufc.br J. Mendes Filho
indicates hydraulic interconnection of the superior and middle aquifer systems through the Santana aquitard.
Keywords HydrogeochemistryPHREEQCModflowAraripe Sedimentary Basin
Cariri Valley
1 Introduction
During the last two decades flow modeling has become a routinely used tool for solving hydrogeologic problems. Over the last decade hydrochemical modeling, mainly using PHREEQC, has also proved a powerful instrument for chemical simulation (Parkhurst
1995; van der Kemp et al.2000; Wurl et al.2003; Dai and Samper2004; Lecomte et al.
2005, and others). In this study we have used both flow and hydrogeochemical modeling to determine whether or not aquifer recharge on the top of the Araripe Plateau contributes to groundwater storage in the Cariri Valley. This problem is rather controversial, as the superior aquifer system (Plateau) and the middle aquifer system are separated by the limestone Santana Formation, considered by many hydrogeologists (DNPM 1996) an aquiclude because its hydraulic conductivity is estimated to be on the order of 1010m/s. However, based on isotope and hydrochemical characteristics of groundwater in the Valley, Santiago et al. (1997) proposed a model in which rainfall waters on the Plateau percolate the sandstone formations Exu and Arajara (constituting the Superior Aquifer System (SAS)) and pass through fractures in the Santana Formation, reaching the Rio da Batateira Formation of the Middle Aquifer System (MAS) in the Cariri Valley. Aquifer functioning is an important matter in the Valley as it is a rapidly growing urban region exclusively supplied by groundwater. In addition, large-scale agricultural projects have been proposed for the Plateau. In the present study we use Modflow (McDonald and Harbaugh1984) for regional flow modeling and PHREEQC (Parkhurst and Appelo1999) for hydrogeochemical inversion for identifying the contribution of groundwater flow through the Santana aquitard (of unknown hydraulic conductivity) to Cariri Valley aquifers.
2 Materials and Methods
2.1 Study Area
In the State of Ceara´, where in 75% of the area crystalline basement rock outcrops, the Cariri aquifers represent the biggest and the most important groundwater resources of the State. They extend over 11,500 km2 where wells yielding more than 100 m3/h of low-salinity water (below 500 mg/l) are common. These resources are the driving force for agricultural, industrial and socio-economic development of the region that comprises 26 townships, being responsible for 10% of the internal gross product of the State.
annual rainfall in the Cariri is unequal: more than 1,000 mm, in the central part, only
&500 mm in the east.
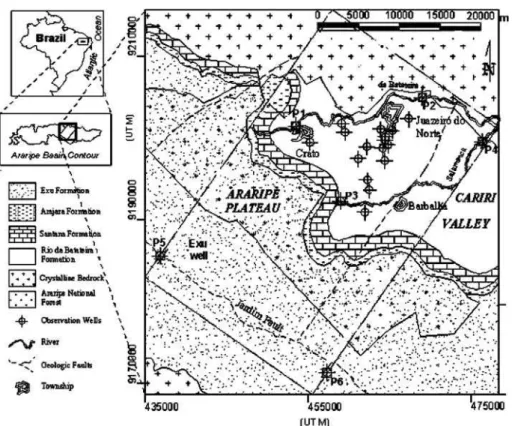
The Crato-Juazeiro Graben is located in the Araripe Sedimentary Basin, Northeast Brazil, containing the townships of Crato, Juazeiro do Norte and Barbalha (Fig.1). The Cariri Valley and the Araripe Plateau, at about 400 m above the Valley, define its topography. Sedimentary Basin aquifers are important groundwater reservoirs in the semi-arid Northeast of Brazil. The Basin is delimited in the north and south by outcropping crystalline basement rock. The narrow strips of the Arajara and Santana Formations rep-resent the cliff that rims the Plateau.
2.2 Litho-stratigraphic Profile
The Exu Formation lithology constitutes a monotonous sequence of unconsolidated clayey sandstone, and intercalation of lenses of course conglomerated, unconsolidated sandstone, with lithofacies typical of fluvial deposits (Ponte and Appi1990). Soils are 99% hyaline quartz with adhering ferruginous matter and 1% clayey ferruginous concretions (Jacomine et al.1973).
The Arajara Formation (Fig. 1) consists of a sequence of siltites, argillite and fine-grained clayey sandstones with typical lacustrine lithofacies (Ponte and Appi1990). The Santana Formation is composed, from top to bottom, of Romualdo, Ipubı´ and Crato
Members (Beurlen1971). The Romualdo Member consists of shale intercalations, marls, limestone and unconsolidated sandstone lenses with up to 60 m thickness (Oliveira1988). The Ipubı´ Member is characterized by evaporitic lenses of mainly gypsum and anhydrite with 30 m mean thickness (Silva1983,1988). The Crato Member is composed, from top to bottom, of micaceous clayey limestone and micaceous shale and is the central lithofacies of a depositional lacustrine system (Silva1983). There is a large amount of total organic carbon (up to*25% (Assine1992)) in this laminated 50 km section.
The Rio da Batateira aquifer lithology is constituted of medium and fine-grained clayey sandstones, clayey siltite and bituminous shale with fossils, with an approximate thickness of 200 m (Ponte and Appi 1990). Mineralogy shows vitreous colorless quartz with fer-ruginous adhering matter, manganous concretions, clayey ferfer-ruginous concretions and weathered K-feldspar (Jacomine et al.1973).
2.3 Flow Modeling
Modflow software was used for steady-state regional groundwater flow modeling. Speci-fied head boundary conditions were imposed by the rivers Salamanca and Batateira, the level of springs discharging from the Arajara/Santana Formations interface and Jardim Fault (that acts as a water divide on the Plateau) connecting points P5 (Exu well) and P6 (Fig.1) for which hydraulic heads were linearly interpolated. Due to the scarcity of data on the Plateau, the head for the Exu well, exploiting the Jardim fault, was attributed to the entire fault in the Rio da Batateira aquifer. This procedure seems reasonable as the hydraulic gradient is expected to be small in the longitudinal direction of the Plateau. A well database (COGERH2003; DNPM 1996) of topographic positions and static levels was used to interpolate hydraulic heads for any point of the 100-column/100-row grid covering an area of 1,000 km2. This hydraulic head surface was used in the calibration of the model, when hydraulic conductivity of the Santana Formation and local recharge to the Batateira Valley aquifer were adjusted. As the crystalline basement is impervious, corre-sponding cells were considered inactive.
Recharge on top of the Plateau depends on the characteristics of the area simulated. Mendonc¸a (2001), using the Green and Ampt (1911) model, calculated 4% of annual precipitation for forest areas, but only one-fifth of this value for deforested ones. For the mean annual rainfall of 1,000 mm/year this results in 40 and 8 mm/year, respectively.
Hydraulic conductivities were kE = 13.5 · 106 m/s for the Exu Formation,
kA= 1.7·106m/s for the Arajara Formation andkRBP= 6.9·106m/s for the Rio da
Batateira Formation underneath the Plateau (calculated by Mendonc¸a 2001), and
kRBV= 50·106 m/s for the Rio da Batateira Formation in the Valley (obtained from
DNPM1996).
2.4 Hydrogeochemical Inversion
the only well (P5 in Fig. 1) penetrating the entire Plateau and exploiting the Rio da Batateira Formation. This water is highly mineralized, with EC = 904mS/cm.
3 Results and Discussion
3.1 Flow Modeling
Steady-state numerical calculation was performed with boundary condition and initial hydraulic head distribution as described above. In total, 18 wells (Fig.1, Table1), 17 in the Valley and one (Exu well, P5) on the Plateau, were used for calibration, through which local Valley recharge and hydraulic conductivity, kS, of the Santana Formation were adjusted.
A Valley recharge of 130 mm/year was obtained. While this value seems high, one must keep in mind that recharge through water discharging from the springs at the SAS/Santana contact is included.
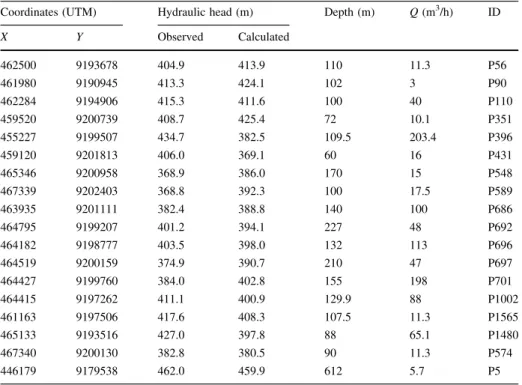
More important to the question of aquifer functioning is the hydraulic conductivity of the Santana Formation. Figure 2A represents error parameters that judge the quality of adjustment to the hydraulic head distribution: standard deviation (r), the mean absolute
deviation ðhj jiÞe for all wells, and the deviation for the Exu well only (eexu). All three
parameters are in good agreement:kS= 9·1011m/s is the best value (and is close to the
estimated 1010m/s). Figure2B presents Modflow simulated heads versus observed heads for the 18 calibration wells.
Table 1 Coordinates, hydraulic head (observed and calculated), depth, flow and identification labels (ID)
for calibration wells
Coordinates (UTM) Hydraulic head (m) Depth (m) Q(m3/h) ID
X Y Observed Calculated
462500 9193678 404.9 413.9 110 11.3 P56
461980 9190945 413.3 424.1 102 3 P90
462284 9194906 415.3 411.6 100 40 P110
459520 9200739 408.7 425.4 72 10.1 P351
455227 9199507 434.7 382.5 109.5 203.4 P396
459120 9201813 406.0 369.1 60 16 P431
465346 9200958 368.9 386.0 170 15 P548
467339 9202403 368.8 392.3 100 17.5 P589
463935 9201111 382.4 388.8 140 100 P686
464795 9199207 401.2 394.1 227 48 P692
464182 9198777 403.5 398.0 132 113 P696
464519 9200159 374.9 390.7 210 47 P697
464427 9199760 384.0 402.8 155 198 P701
464415 9197262 411.1 400.9 129.9 88 P1002
461163 9197506 417.6 408.3 107.5 11.3 P1565
465133 9193516 427.0 397.8 88 65.1 P1480
467340 9200130 382.8 380.5 90 11.3 P574
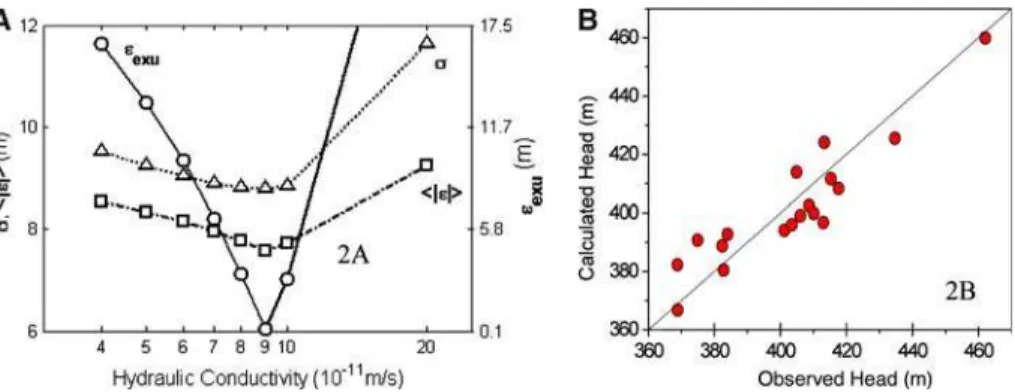
Figure 3 shows a cross-section of the simulation area with flow through the various formations indicated by (plane-projected) velocity proportional flow vectors.
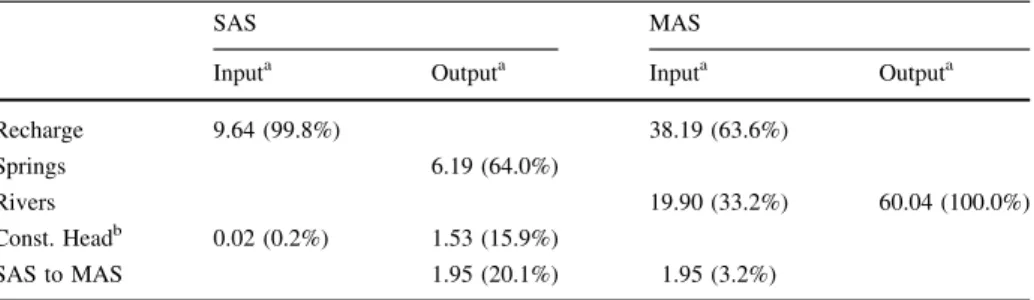
The hydraulic budgets for the two aquifer systems, SAS and MAS, are listed in Table2. Of a total recharge of 9.66·106m3/year on the top of the Plateau, 64% discharge from the
springs on the northern slope (due to the existence of the water divide along P5-P6), about 16% is directed to the southern slope (in the State of Pernambuco), and about 20% (amounting to&2·106 m3/year) percolates the Santana Formation, reaching the MAS
Rio da Batateira aquifer where it constitutes 3.2% of the total input.
3.2 Hydrogeochemical Inversion
Recharge through the Santana Formation suggested by numerical modeling should be manifest in the chemical evolution of Rio da Batateira groundwater. For this reason,
Fig. 2 (A) Errors versus conductivity for Santana Formation (left). (B) Simulated versus observed hydraulic
head (right)
25000 Rio da Batateira Formation
Dry cells 0 6 3 Noflow cells 0 0 7 2 8 0 2 15000 3 0 9 Constant Head 10000 0 2 7 0 3 6 5000 ) m( e d uti tl a 0 4 5 0 1 8 0 5 4
20000 35000 Arajara Formation
Santana Formation
Non saturated part of cell 30000
Exu Formation
(m) 40000
PHREEQC inversion was performed in order to see whether the chemical composition of Valley groundwater also indicates the influence of the hydrogeochemical Santana envi-ronment. Aquifers on the top of the Araripe Plateau are composed of low-solubility minerals with great resistance to weathering. As their hydraulic conductivity is high, this promotes the rapid passage of Plateau recharge through the SAS, reaching the Santana Formation with a conductivity of 40mS/cm (Santiago et al.1997). The dominant species are Na+and Cl, probably originating from marine aerosol. Part of this water percolates the Santana Formation where it suffers the influence of several formation-typical hy-drogeochemical processes. According to the lithological sequence (see Sect. 2.2), calcite and dolomite dissolution/precipitation occur in the Romualdo Member; subsequently, incongruent dissolution of gypsum occurs in the Ipubi Member, due to the Ca2+–Mg2+– HCO3 facies acquired during the first step, and the water becomes supersaturated in
CaCO3 precipitating calcite. Cl concentration is higher in the final than in the initial
water, requiring a Cldonor mineral (Table3). The Santana Formation has a high fraction of evaporite minerals and halite (NaCl), being highly soluble, may be responsible for the increase in Clconcentration. Due to high concentrations of Ca2+and Mg2+in the final water, exchange of these ions with Na+in clay minerals, abundant in the Rio da Batateira Formation, occurs in this final step (as may be seen from the last two lines of Table4).
Organic matter, present in elevated concentration in Rio da Batateira Formation water, gives rise to biological activities that influence groundwater composition. Since ferric iron (from goethite in the Rio da Batateira Formation) and sulfate (from gypsum in the Santana Formation) are present, redox reactions of iron and sulfate will occur:
CH2Oþ4Fe3þþH2OCO2þ4Fe2þþ4Hþ ð1Þ
4CH2Oþ2SO24þ3HþH2SþHSþ4CO2þ4H2O; ð2Þ
Table 3 Physicochemical groundwater parameters used in hydrogeochemical inversion
Sample pH T
(8C) CE (mS/ cm) Ca2+ (mmol/ l) Mg2+ (mmol/ l) Na+ (mmol/ l) K+ (mmol/ l) Fe2+ (mmol/ l) Cl (mmol/ l) SO42 (mmol/l) HCO3 (mmol/l)
Initial 6.0 26.8 40.0 0.18 0.15 0.65 0.12 – 0.91 0.009 0.35 Final 7.3 39.8 904 3.22 2.45 2.48 0.41 0.02 1.77 3.91 4.12
Table 2 Hydraulic budget for Superior (SAS) and the Middle Aquifer System (MAS)
SAS MAS
Inputa Outputa Inputa Outputa
Recharge 9.64 (99.8%) 38.19 (63.6%)
Springs 6.19 (64.0%)
Rivers 19.90 (33.2%) 60.04 (100.0%)
Const. Headb 0.02 (0.2%) 1.53 (15.9%)
SAS to MAS 1.95 (20.1%) 1.95 (3.2%)
a
106m3/year b
The stability diagram (Fig. 4) shows that pyrite (FeS2) has a redox potential slightly
higher than that of sulfide, meaning that this highly insoluble mineral precipitates as soon as sulfides exist in solution:
FeS2þ2Hþþ2eFe2þþ2HS
; K¼10
18:479 ð3Þ
The relative contributions of all these processes are determined by the thermodynamics of the reactions occurring in the system, transforming water from its initial to its final composition (Table3). With these constraints, PHREEQC (Parkhurst and Appelo1999)
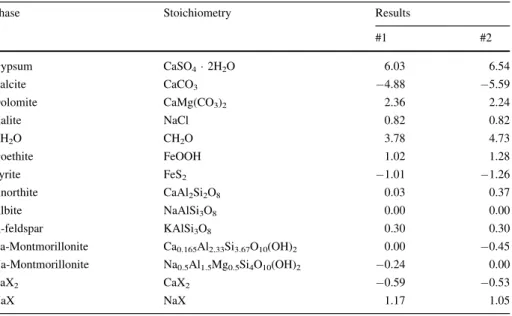
Table 4 PHREEQC simulated water transfer results (in mmol/l)
Phase Stoichiometry Results
#1 #2
Gypsum CaSO42H2O 6.03 6.54
Calcite CaCO3 4.88 5.59
Dolomite CaMg(CO3)2 2.36 2.24
Halite NaCl 0.82 0.82
CH2O CH2O 3.78 4.73
Goethite FeOOH 1.02 1.28
Pyrite FeS2 1.01 1.26
Anorthite CaAl2Si2O8 0.03 0.37
Albite NaAlSi3O8 0.00 0.00
K-feldspar KAlSi3O8 0.30 0.30
Ca-Montmorillonite Ca0.165Al2.33Si3.67O10(OH)2 0.00 0.45 Na-Montmorillonite Na0.5Al1.5Mg0.5Si4O10(OH)2 0.24 0.00
CaX2 CaX2 0.59 0.53
NaX NaX 1.17 1.05
calculates two possible sets of results, listed in Table4(where positive and negative values indicate addition and subtraction to water solution, respectively).
Both models have no difference in halite and K-feldspar dissolution, because these are the only donor phases for Cl, and K+. Neither model involves albite precipitation/dis-solution, indicating no substantial quantities of this mineral along the water flow path. The greatest difference between the two models is in clay precipitation. Result #1 shows Na-montmorillonite precipitation with relatively low-anorthite dissolution, whereas #2 sup-poses Ca-montmorillonite precipitation with anorthite dissolution 12 times higher than #1 to compensate for the decrease in Ca2+. The amount of calcite precipitation with dolomite and gypsum dissolution shows that dolomite and gypsum incongruent dissolution are important and common geochemical processes in this evolution. It is not possible to choose between these two sets of results in the absence of detailed information on mineralogy and water flow paths. In fact, a linear combination of the two models may be the best choice.
4 Conclusion
Results obtained from both flow modeling and hydrogeochemical inversion give a valuable contribution to understanding aquifer functioning in the Araripe Sedimentary Basin. Modflow indicates the percolation of 20% of recharge on the Plateau through the Santana Formation. PHREEQC hydrochemical simulation supports this flow model mainly through the strong influence of dolomite and gypsum dissolution. These minerals are typical of the limestone Santana Formation, but are absent in the sandstone aquifers of the Superior and Middle Aquifer Systems.
Thus, simultaneous application of Modflow and PHREEQC allowed the identification and quantification of Santana aquitard percolation and that way calls attention to the Araripe Plateau as recharge area to Cariri Valley aquifers that constitute the exclusive water suppliers to one of the most densely populated areas of Ceara´ State.
From the methodological point of view it is evident that the two modeling tools, using completely different data sets, lead to converging results, confers increased credibility on the conclusions drawn.
Acknowledgements The authors wish to thank COGERH (Companhia de Gesta˜o dos Recursos Hı´dricos
do Estado do Ceara´) and FUNCAP (Fundac¸a˜o de Amparo a` Pesquisa do Estado do Ceara´) for logistic and financial support, CAPES (Coordenac¸a˜o de Aperfeic¸oamento de Pessoal de Nı´vel Superior—Ministe´rio da Educac¸a˜o—Brazil) for a fellowship of one of the authors (Machado) during postgraduate studies. We thank Dr. A. Donegan for a critical reading of the manuscript and Aquatic Geochemistry reviewers for suggestions for improving it.
References
Assine ML (1992) Stratigraphic analysis of the Araripe Basin, Northeast Brazil (Ana´lise Estratigra´fica da Bacia do Araripe, Nordeste do Brasil). Revista Brasileira de Geocieˆncias 22:289–300
Beurlen K (1971) Facies and ecological conditions of the Santana formation in Araripe Plateau (Brazil Northeast) (As Condic¸o˜es Ecolo´gicas e Faciolo´gicas da Formac¸a˜o Santana, na Chapada do Araripe (Nordeste do Brasil)). Anais da Academia Brasileira de Cieˆncias, Rio de Janeiro 43:411–415 COGERH (Companhia de Gesta˜o dos Recursos Hı´dricos do Estado do Ceara´) (2003) Well Data Sheet
(Cadastro de poc¸os)
DNPM (Departamento Nacional de Produc¸a˜o Mineral) (1996) Araripe Sedimentary Basin hydrogeological avaliation project (Projeto Avaliac¸a˜o Hidrogeolo´gica da Bacia Sedimentar do Araripe). Recife, 101 pp Green WH, Ampt G (1911) Studies of soil physics, part I – the flow of air and water through soils. J Agric
Sci 4:1–24
Jacomine PK, Almeida JC, Medeiros LAR (1973) Levantamento explorato´rio – reconhecimento de solos do Estado do Ceara´. Recife. Technical Report 28 (Boletim Te´cnico 28), conveˆnio MA/DNPEA – SUD-ENE/DRN
Lecomte KL, Pasquini AI, Depetris PJ (2005) Mineral weathering in a semiarid mountain river: its assessment through PHREEQC inverse modeling. Aquat Geochem 11:173–194
McDonald MG, Harbaugh AW (1984) A modular three-dimensional finite-difference ground-water flow model. U.S. Geol. Surv. Water Resour. Invest. Rep. 83-875, Washington, 528 pp
Mendonc¸a LAR (2001) Water resources of Araripe Plateau (Recursos Hı´dricos da Chapada do Araripe). Doctoral dissertation, Universidade Federal do Ceara´, Fortaleza, 193 pp
Oliveira AA (1988) Laminated limestone of the Cariri, Ceara´ (Calca´reos Laminados do Cariri, Ceara´). Master Thesis, Universidade Federal do Ceara´
Parkhurst DL (1995) A computer program for speciation, reaction-path, advective-transport, and inverse geochemical calculations. U.S. Geol. Surv. Water Resour. Invest. Rep. 95-4227, 143 pp
Parkhurst DL, Appelo CAJ (1999) User’s guide to PHREEQC – a computer program for speciation, batch-reaction, one-dimensional transport, and inverse geochemical calculations. U.S. Geol. Surv. Water Resour. Invest. Rep. 99-4259, Colorado
Ponte FC, Appi CJ (1990) Proposta de revisa˜o da Coluna Estratigra´fica da Bacia do Araripe. Proc. XXXVI Congresso Brasileiro de Geologia, Natal, pp 211–226
Santiago MMF, Silva CMSV, Mendes Filho J, Frischkorn H (1997) Characterization of groundwater in the Cariri (Ceara´, Brazil) by environmental isotopes and electric conductivity. Radiocarbon 39:49–59 Silva MAM (1983) The Araripe Basin, Northeastern Brazil: regional geology and facies analysis of a lower
cretaceous evaporitic depositional complex. PhD Thesis, Columbia University, EUA, 290 pp Silva MAM (1988) Cretaceous evaporites of Araripe Basin: deposition environments and diagenetic story
(Evaporitos do Creta´ceo da Bacia do Araripe: ambientes de deposic¸a˜o e histo´ria diagene´tica). Bol Geoc PETROBRA´ S 2:53–63
Van der Kemp WJM, Appelo CAJ, Walraevens K (2000) Inverse chemical modeling and radiocarbon dating of palaeogroundwaters: the Tertiary Ledo-Paniselian aquifer in Flanders, Belgium. Water Resour Res 36:1277–1287