i
Analyzing Geospatial patterns of
Syrian refugee flows in
southeastern Turkey by use of
remote sensing and
complementary data.
Daniel Carlos dos Santos Machado
ii
Academic Thesis: Declaration Of Authorship
I hereby certify that this thesis has been composed entirely by me and is based on my
own work, unless stated otherwise. No other person’s work has been used without due
acknowledgement in this thesis. All references and verbatim extracts have been quoted, and all sources of information, including graphs and data sets, have been specifically acknowledged.
I, furthermore, confirm that:
1. This work was done wholly or mainly while in candidature for a research degree at Uni-Münster;
2. Where any part of this thesis has previously been submitted for a degree or any other qualification at this University or any other institution, this has been clearly stated;
3. Where I have consulted the published work of others, this is always clearly attributed;
4. Where I have quoted from the work of others, the source is always given. With the exception of such quotations, this thesis is entirely my own work;
5. I have acknowledged all main sources of help;
6. Where the thesis is based on work done by myself jointly with others, I have made clear exactly what was done by others and what I have contributed myself;
Signed: ………..
iii
Analyzing Geospatial patterns of Syrian refugee flows is southeastern
Turkey by use of remote sensing and complementary data.
Dissertation supervised by
Dr. Torsten Prinz, PhD
Institut für Geoinformatik,
Westfälische Wilhelms-Universität Münster
Münster, Germany
Dissertation co-supervised by
Christian Knoth, PhD
Institut für Geoinformatik,
Westfälische Wilhelms-Universität Münster
Münster, Germany
Dissertation co-supervised by
Professor Filiberto Pla, PhD
Departamento de Lenguajes y Sistemas Informatícos
Universitat Jaume I
Castellón, Spain
iv
ACKNOWLEDGMENTS
First of all, I would like to thank Dr. Torsten Prinz who suggest advised me this thesis, in
which such topic I created an identification.
Also, another thanks to Christian Knoth for giving me advices, recommendations in how
to proceed the work.
In addition, I am very thankful to Prof. Filiberto Pla for this remarks, feedbacks and tips
and useful comments in my research.
I would offer deep gratitude to Mark Padgham for his suggestions and tips. He was
willing to help in any possible way.
I am grateful to Jim Jones (Institut für Geoinformatik) for meeting 3 times and aid me
about Open linked Data and how this field could be connected to my research.
Thanks to all professors and university staff, I had in ULN-ISEGI, who supported me in
my academic/ professional life as well as personal too. Thanks, also, to IFGI for
providing a good facility and environment to study.
I am grateful to my family and my precious colleagues/friends I did along this course
who helped me reliving the pressure and motivating when I find myself a bit down.
Last but not least, I want to thank European Commission for giving me the opportunity
v
Analyzing Geospatial patterns of Syrian refugee
flows is southeastern Turkey by use of remote
sensing and complementary data.
1
Daniel Carlos dos Santos Machado
2Torsten Prinz
3
Christian Knoth
4Filiberto Pla
Abstract Crisis-affected communities and global organizations for international aid are becoming increasingly digital as consequence geotechnology popularity. Humanitarian sector changed in profound ways by adopting new technical approach to obtain information from area with difficult geographical or political access. Since 2011, turkey is hosting a growing number of Syrian refugees along southeastern region. Turkish policy of hosting them in camps and the difficulty created by governors to international aid group expeditions to get information, made such international organizations to investigate and adopt other approach in order to obtain information needed. They intensified its remote sensing approach. However, the majority of studies used very high-resolution satellite imagery (VHRSI). The study area is extensive and the temporal resolution of VHRSI is low, besides it is infeasible only using these sensors as unique approach for the whole area. The focus of this research, aims to investigate the potentialities of mid-resolution imagery (here only Landsat) to obtain information from region in crisis (here, southeastern Turkey) through a new web-based platform called Google Earth Engine (GEE). Hereby it is also intended to verify GEE currently reliability once the Application Programming Interface (API) is still in beta version. The finds here shows that the basic functions are trustworthy. Results pointed out that Landsat can recognize change in the spectral resolution clearly only for the first settlement. The ongoing modifications vary for each case. Overall, Landsat demonstrated high limitations, but need more investigations and may be used, with restriction, as a support of VHRSI.
Keywords: Object-based time-series; Google Earth Engine, Refugee camps monitoring, Retrospective analysis,
1 Institute for Geoinformatics, University of Münster, Germany ¨ e-mail: [email protected]
2 Institute for Geoinformatics, University of Münster, Germany ¨ e-mail: [email protected]
3 Institute for Geoinformatics, University of Münster, Germany ¨ e-mail: [email protected]
vi
Acronyms:
AAAS: American Association for the Advancement of Science;
API: Application Programming Interface;
CERN: European Organization for Nuclear Research
EO: Earth observation;
GIS: Geographic information System
GISci: Geographic information science;
GE: Google Earth;
GEE: Google Earth Engine;
IDP: Internally displaced persons;
L7_TOA: Landsat 7 top of atmosphere;
LC8_TOA: Landsat 8 top of atmosphere;
MPC: Migration Policy Centre;
RC: Refugee camps
SLC: Scan Line Corrector
UNHCR: United Nations High Commissioner for Refugees;
vii
Charts, Figures & Tables:
Chart 1: Total amount of uprooted people in the world in the last 10 years. Chart 2: Chart showing the abrupt raise of Syrian refugees from 2008 to 2013. Chart 3: Comparison chart between total and pop. Residing in camps.
Chart 4: RCs in Turkey.
Chart 5 Number of total pixels per month and total population.
Chart 6: Comparison of growing variance and area along the time-series. Chart 7: Comparison among blue descriptor and two moving average.
Chart 8: Normalized total population, blue mean band and its mean average during the shift period.
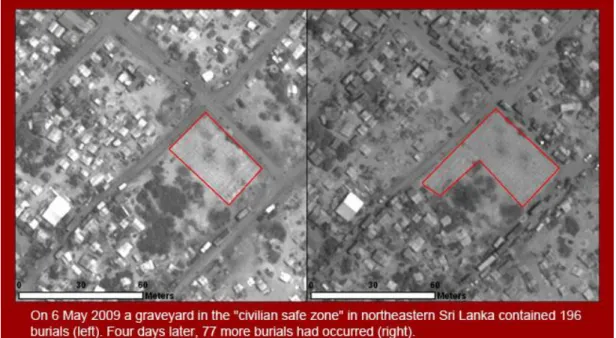
Figure 1: Graveyard in the "civilian safe zone" in northeastern Sri Lanka contained burials. Figure 2: Image showing where evidences of war crime were spotted.
Figure 3: In a) the whole refugee camp is seeing as a object, whereas in b) it can be seen there are various objects (I this case, tent) from the same refugee camp.
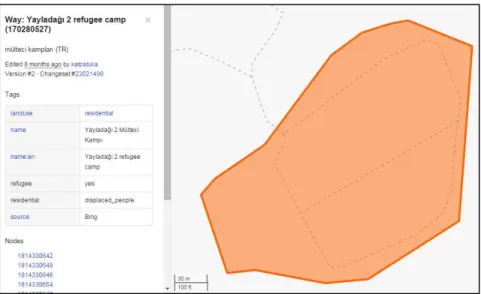
Figure 4: Yayladağı 2 refugee camp feature from OSM humanitarian map. All 22 camps were found as this example.
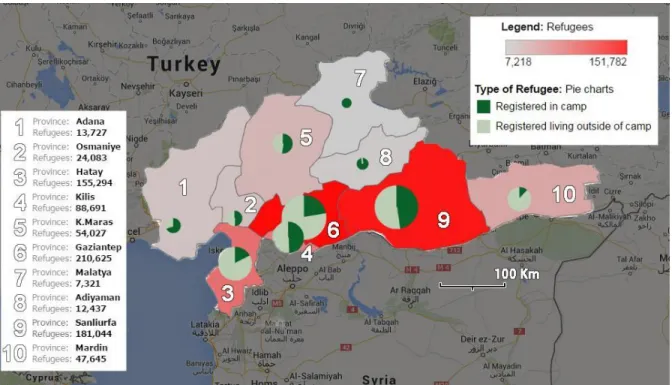
Figure 5: Map of number of Syrian refugees in Turkish provinces. Figure 6: Beydağı RC seem from Landsat 7 and from VHRSI. Figure 7: Sarıçam RC seem from VHRSI and Landsat 7.
viii Figure 10: Workflow of the present research
Figure 11: Chart picturing variance historical image archive from GE
Figure 12: Chart picturing how variance is sensitive to any level of cloud cover Figure 13: Scene acquired 10.10.2011. No container can be seen.
Figure 14: Scene acquired 08.08.2013. Containers are already settled. Figure 15: Different ‘tent cover’ in time. Altinozu 2 RC
Figure 16: Feature automatically generated from 07.04.2013. Figure 17: Feature automatically generated from 01.11.2014.
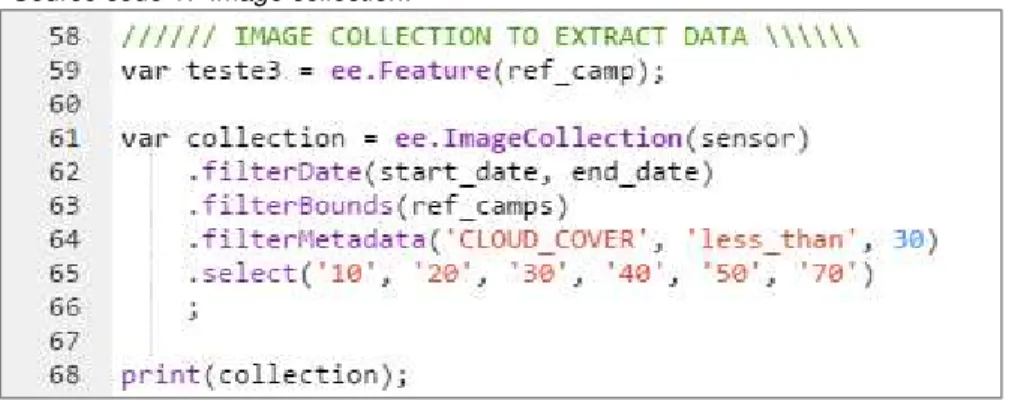
Source code 1: Image collection. Source code 2: Generating time-series
Source code 3: code to create raster according a given threshold (where method):
Table 1: RC used for this study. Table 2: Coordinates of each RC.
Table 3: Number of images collected per RC. Table 4: Data acquisition dates from each RC in GE
ix
Contents
1. Preliminary: ...10
1.1. Introduction: ...10
1.2. Remote sensing for Humanitarian causes: ...13
1.3. Google Earth Engine – A new powerful tool for geospatial analysis: ...16
1.4. Relevance and Justification: ...17
2. Research question: ...17
3. Literature Review: ...18
3.1. Time-Series Analysis: ...18
3.2. Retrospective monitoring of objects: ...19
4. Datasets ...21
4.1. Defining the study area: ...21
4.1.1. Refugee Camps – Two types, one target: ...23
4.2. Material: ...24
4.2.1. Images dataset: ...24
4.2.2. Complementary dataset: ...25
5. Methodology: ...27
5.1. Projection concerns: ...34
6. Results and Discussion: ...34
6.1. Preliminary findings - Overall analysis: ...34
6.2. Container camps: ...37
6.3. Tent camps: ...38
6.4. Study case – Akçakale Camp: ...42
7. Other potential studies: ...45
8. Conclusions and Perspectives: ...46
9. References: ...49
10. Annex: ...52
10.1. Time-series from Container camps: ...52
10.2. Time-series from Tent camps: ...57
10
1.
Preliminary:
1.1.
Introduction:
The rise of technology has led to a growing overflow of data, which requires more sophisticated data storage systems. The so-called “big data” revolution, reinforced information technology, reached many fields of knowledge as genetics, marketing as well as geoscience. The last one has strong theoretical foundation in science nowadays. Consequence of the growing investment in technologies to accumulate data by using technologies of remote sensing system, geographical information system, and global positioning systems (Thomas Blaschke & Helena Merschdorf – 2014). Also, the popularity of mobile phones and social media recently are elements that contributed for data collection that raised interest of urban planners, architects and the motivated the phenomena of crowdsourcing.
In light of this, the humanitarian sector realized geotechnologies could provide technical evidences to save lives, alleviating suffering and protect human dignity during and in the aftermath of political crises and natural disasters. International organizations are using, recently, different GISci approaches in order to support their documentations and report human rights violations and any other issue related to developing crisis (Meyer, Patrick – 2011).
Mobile phones data provide timely information in conflicts. Researchers, most volunteers and humanitarian work using data from mobile phones. There are many studies related of changing human population distributions over time using these kind of data. There are also literature about distinct approaches about the usage of mobile phone data (Deville, Pierre et al. –
2014). However, regarding remote sensing, this reality is quite different.
Satellite imaging are an extension of a surveillance gaze in the context of a politics of securitization (Herscher, Andrew – 2014). Amnesty International, for example, has pioneered the use of satellite images for human rights research and advocacy over the last years (Amnesty International - 2014). Marx (2013) summarize in his paper about human right violation in Darfur, Sudan, by saying:
“Organizations concerned with human rights are increasingly using remote sensing as a tool to improve their detection of human rights violations.
11
monitoring campaigns conducted over large regions and extended periods
of time, current methods of using high-resolution sensors and
manpower-intensive analyses have become prohibitive.”
One current and growing concert for all humanitarian organizations are the increasing number of refugees and internally displaced persons (IDP’s). UNHCR pointed out that there are over 42 million people uprooted by war currently.
Chart 1: Total amount of uprooted people in the world in the last 10 years. source: UNHCR Statistical Online Population Database5
Today this number is sustained mostly by the course the Arab spring events. This phenomenon started in early 20116 evolved into a mood of violence and instability in 2013 in Middle East7. The Syrian civil war, most well-known conflict nowadays. Since its outbreaks, the population number fleeing to close to the border or crossing other countries increased.
According to population statistics of UNHCR also, there were in 2013 6,973,294 syrians uprooted by the war. Over 50% of then cannot cross the border, only around 3 Million managed to leave the country and become refugees. The vast majority are in Lebanon and Turkey.
5 web adress: http://popstats.unhcr.org/PSQ_TMS.aspx
6 http://middleeast.about.com/od/humanrightsdemocracy/a/Definition-Of-The-Arab-Spring.htm 7 http://www.bbc.com/news/world-middle-east-24179084
16.103.785
18.922.091
20.089.715
32.013.843
31.680.25634.462.682
36.466.053
33.924.436
35.440.128
35.833.362
42.869.349
0 10.000.000 20.000.000 30.000.000 40.000.000 50.000.000
Time Series
–
Persons of concern to UNHCR
12 Although Turkey is the second destination of Syrian refugees, Turkish government have the policy to settle them in camps on the contrary of Lebanon that host them in houses and apartments in urban area. Around 30% of refugees are registered as refugee but are not allocated into a camp, with means that they might be scattered somewhere on the border (Özden, Şenay – 2013). These numbers do not include those Syrians who have rented apartments outside of camps, typically in cities. There are no reliable figures as to how many Syrians are residing in cities. Even though UNHCR states that 60,000-70,000 Syrians live in cities, MPC estimates this data is underestimated (Özden, Şenay – 2013). Therefore, the institutions are not clear about the data.
Chart 2: Chart showing the abrupt raise of Syrian refugees from 2008 to 2013 source: UNHCR Statistical Online Population Database8
About 80% of the Syrians who fled to Turkey are from Syrian northern provinces, mainly from Idlib, Latakia, Azaz and northern Aleppo even though there are smaller numbers of Syrians who fled from Damascus (Özden, Şenay – 2013).
With the influx of huge numbers of Syrians into Turkey, anti-immigrant, anti-Arab discourses have surfaced among the Turkish public. Furthermore, due to the Turkish
governments’ openly hostile position to the Syrian regime, Syrian migration became closely linked with Turkish domestic politics and foreign policy. Those individuals and political bodies critical of the Turkish government assumed an anti-immigrant position accusing displaced Syrians of being
8 web address: http://popstats.unhcr.org/PSQ_TMS.aspx
33 64 74 9.494
248.666
585.711
1
Syrians of concern to UNHCR residing in Turkey
13 armed, sectarian rebels. Therefore, analyzing the Syrian migrant community in Turkey means contextualizing it within the political framework of the host-society.
All the recent population dynamics that modified Turkish borderland cover along four years of regional conflict is the focus of this master thesis work by using remote sensing techniques and complementary data.
1.2.
Remote sensing for Humanitarian causes:
Human rights groups, non-governmental and governmental organizations are also using satellite imagery as evidence of severe human rights situations in recent years (Nuñez, Ana Cristina – 2012). Remote sensing science to extract information became an important approach to provide technical awareness to international community and lead institutions to respond rapidly at the place of a developing crisis. This is valuable to obtain information from areas that are, usually, off-limits for reasons of politics, security, or physical accessibility, where abuses were known only through the erratic descriptions of those who managed to escape (Deville, Pierre et. al – 2014).
Amnesty-USA states in its website’s section called “Remote Sensing for Human Rights”, that for the last six years, they had pioneered the use of satellite images for human rights research and advocacy (Amnesty-USA – 2014). UN has, also, an institute for training and research (UNITAR) that is in a cooperation with European Organization for Nuclear Research (CERN), in order to provide satellite-based solutions for human security. Their satellite is called UNOSAT and is active since 2000(Moran, Sean – 2005).
Jonathan Drake and Eric Ashcroft, two analysts at the AAAS Geospatial Technologies and Human Rights Project, published in February 2013 in Physicstoday's magazine, their experiences acquired along few days by working together with Amnesty International to analyze the effects of the escalating Syrian civil war on the city of Aleppo. The report itself is about this new branch of remote sensing applied on human rights issues but what is important to point out is the only usage of VHRSI. Undoubtedly, VHRSI are more powerful to recognize with accuracy and more signs of conflict. Military activity, property destruction, shell craters, and the erection of roadblocks were elements recognized by AMNESTY in this analysis and it is very unlikely to be recognized from a non-VHRSI.
14 shell craters were spotted in a crowded area that had been designated as a 'civilian safe zone.' By exploiting the bilateral symmetry of these features, AMNESTY international were able to calculate the azimuths of the incoming projectiles, and then trace them back to combatants' mortar positions. In that same series of images, they could also watch graveyards expanding over a period of few days. (“Eyes in the Sky” - Physicstoday's scientific magazine, 2014)
“the US government’s 2009 report on war crimes in Sri Lanka in 2009 was informed by satellite data gathered and analyzed by AAAS, Amnesty International and Human Rights Watch to identify the locations and extent of damage to IDP shelters in Sri Lanka following reports that IDP camps were being targeted.15 As no outsiders were allowed access to the area during the timeframe in question, commercial high-resolution satellite imagery was one of the few options available for gathering information.”(Nuñez, Ana Cristina – 2012)
Figure 1: description in image.
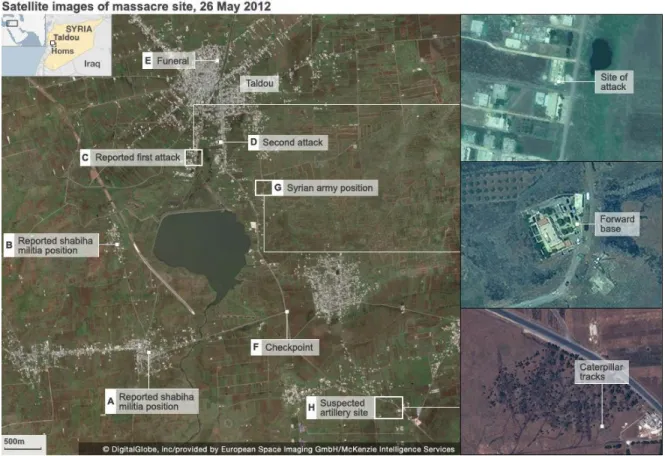
15 Moreover, up to the Syrian conflict topic, VHRSI were already used. The image bellow showed a large Syrian military contingent over 1.5 km southeast of the massacred site in Homs city, western Syria. The episode is known as Houla massacre9,10.
Figure 2: Image showing where evidences of war crime were spotted. source: BBC
High-resolution images first became available to civilians in 1994, but only popularized in the early Twenty-First Century. Satellite imagery now is available at spatial resolutions as high as 50 centimeters per pixel, and in wavelengths ranging from the visible to L-band synthetic aperture radar. Because it can rapidly and quantitatively document human rights violations almost anywhere on Earth, satellite imagery has revolutionized the field as show previous examples (Wang, Ben Yunmo, et al. – 2013)
16 Nevertheless, so far, most studies used, almost invariably, VHRSI to develop their works.
The usage of mid-resolution images for humanitarian purposes requires additional data and more
expert/technical skills in which has so much few related scientific papers. No one approaching
refugees so far.
1.3.
Google Earth Engine
–
A new powerful tool for geospatial
analysis:
Google Earth Engine (GEE) is still a beta version tool launched in 2011 to extract and analyses geospatial data from Earth observation (EO) sensors. It is a cloud computing web platform that takes vast amounts of satellites images and mash it at shared data centers to run simultaneously on many CPUs. Currently, it is only available to trust tester who has the permission to use the 40 years of historical and current global satellite imagery archive to perform complex analyses previously available to just a few important institutions (Gorelick, Noel - 2014). GEE API requires JavaScript or Python programing language skills.
Due to its experimental condition, the platform are subject to frequent change in which happens commonly, as well as the modification of codes11. However, some aspects already make GEE satisfactory for a scientific paper. There are:
The lack of need to pre-process the data. All images are already pre-processed in the system and it is not necessary the users perform the time-consuming pre-processing phase of geo referencing, calibration, equalization and so on. This advantage greatly speeds up the job of handling, generation and data analysis.
The reproducibility of research or experiment results. It is an important aspect of scientific research, because the credibility of all findings are affected when scientists present their results
and conclusion from a “black box” in which only their working group have the access (Pebesma, Edzer, et al. – 2012). GEE database and codes can be accessed and shared anywhere by someone with internet connection and a trust tester permission. It can be observed recently, as said (Pebesma, Edzer, et al. – 2012) on his paper about the succeed development of R software community, the same growing community of GEE users. This fact contribute to develop a good and reliable scientific software is a social process.
11 Page indicating the constant changes in the API:
17
1.4.
Relevance and Justification:
Syrian crisis is a recent and ongoing event that has developed in the wake of Arab spring - early. 201112 followed by Arab Winter - post mid-201213 (Syria, Iraq and Lebanon) and the beginning of the Islamic State activity April 201314. The need for more information of these conflicts is the motivation for this work that can aid international organizations to base their actions and policies. Because migration is rapidly evolving, knowledge thereof needs to be constantly updated. Unofficial data point out that Unregistered Syrian refugees are mostly located in Hatay, Kilis, Gaziantep and Sanliurfa, which are all border provinces in Turkey. Early maps provided by UNHCR displays information per province (Choropleth maps). Then, no information per camp. However, using remote sensing techniques might come up interesting information of the past of this ongoing conflict if data from censuses, surveys, and remotely sensed imagery, as well as modeling techniques, were analyzed together in order to overcome deficiencies in the data sources.
In a recent paper conducted by (Deville, Pierre et. al – 2014), they had a stunning result found that, globally, the remote sensing method was considered to be more precise than the mobile phone method to map populations. This finding, motivated this study by using also remote sensing techniques, but now, with mid resolution imagery. Moreover, whereas a single town can be analyzed using high-resolution imagery, analysis on a regional scale requires a different approach and methodology. Preferable by using imagery with coarse spatial resolution
2.
Research question:
The main goal here is to verify if the advantages of Landsat images toward VHRSI, such as time and spectral resolution, can provide information from refugee camps and trace information from the past. In addition, is it possible to recognize geospatial aspects of refugee flow dynamics (e.g. camps) from Landsat Imagery and complementary data? This question can be extended to sub-questions such as:
- What are the best descriptors?
12 http://middleeast.about.com/od/humanrightsdemocracy/a/Definition-Of-The-Arab-Spring.htm
18 - Is there a way to derive indicators of RCs dynamics is the use of spectral band indices
and others not commonly used descriptors?
In Parallel, Google Earth Engine is a new web platform tool that is being tested currently among researches. It is in a Beta version and many functionalities are still in development, and tools are often with bugs. Another challenge of this work is evaluate its potentiality and how it can be used now to help this thesis.
3.
Literature Review:
3.1.
Time-Series Analysis:
Time series is a sequence of data points, measured typically at successive points in time spaced at uniform time intervals. Such series are show trends, periodicity, noise and abrupt events. (Verbesselt, Jan – 2012) categorize ecosystem changes, in remote sensing studies, in three types: seasonal or cyclic change, gradual trend change and abrupt trend change. The first type are those, reported by the author, driven by annual temperature and rainfall interactions impacting plant phenology resulting in distinct intra-annual patterns for different vegetation types. The second are trends in mean annual rainfall or gradual change in land management (e.g., long-term drought, forest regrowth after re) that result in changes along several years. The last one are caused by events from human activities (e.g., deforestation) or natural causes (e.g., wind throw, or drought event)that change land surface over short time frames (e.g., days to weeks or months. It is interesting realizing, that the examples given by the authors of anthropogenic intervention are only abrupt changes (e.g., deforestation). Although the authors just give one example, others human events such as urbanization, oil spill, crops and so forth, could be included also as examples of abrupt change. It is noteworthy that ecosystem changes are an aggregation of seasonal, gradual and abrupt types and evaluate them from remotely sensed data series however is not straightforward.
19 The aim of this thesis is try to identify in a time-series analysis significant abrupt changes led by emergence of RCs. Detecting and characterizes RCs growth within historical time series. However, the present study does not implement object-based image analysis (OBIA) approach. Instead, a retrospective time-series analysis, here, assumes that a current information from non-OBIA source can aid in past discoveries by conduct the relative time-series analysis by the use of a complementary geospatial data.
3.2.
Retrospective monitoring of objects:
Objects or targets are elements extracted, in OBIA , that present similar spectral response within a distinct spectral context. Either from the automatically from algorithms or visually identified from analysts, each object is directly related to spatial resolution. The coarser the image, the more generalized is the object (Blaschke, Thomas – 2010). Figure 3 exemplify that, by exposing the same refugee camp from distinct image products. With Landsat, the refugee camp is seen as a unique object whereas in Google Earth (GE) is possible to identify tent as smallest objects. The disability to do not identify what is within this object from a Landsat; lead us to a problem that is how to identify the type of objects with the same dimension in the same image. The incapability to see texture, and other small objects, prevent us to recognize if it is a refugee camp, mining, warehouses and small settlements.
a) Yayladağı 2 refugee camp from Landsat 8 b) Yayladağı 2 refugee camp from GE
Figure 3: In a) the whole refugee camp is seeing as a object, whereas in b) it can be seen there are various objects (I this case, tent) from the same refugee camp
In order to answer this issue, complementary data is necessary to provide meta information that is type aggregated in features and defined their boundaries in which seen from a
20 map features to overlay on Landsat imagery and extract time-series for further analysis. OSM is a project that creates and distributes free geographic data for the world where volunteers survey with GPS, digitizing aerial imagery, and collecting and liberating existing public sources of geographic data15. Figure 4 exhibit Yayladağı 2 refugee camp feature file.
Figure 4: Yayladağı 2 refugee camp feature from OSM humanitarian map. All 22 camps were found as this example.
OSM humanitarian map is created mainly by the use of VHRSI. So, higher scale than Landsat. At a second moment, after solving an issue came up another one. OSM delineate the land use and regarding refugee camps in Turkey, all of them are fenced. Modifiable areal unit problem (MAUP) is concern taken for the upcoming analysis.
GE historical archive is considered here also complementary data once those images is used to reinforce/validate if the interpretation from Landsat time-series fit or not. UNHCR provide stats in its web datacenter about refugee population16 and Syria Regional Refugee Response organization, an Inter-agency Information Sharing Portal17 are two other sources in which the results from Landsat time-series will be compared for analysis
Retrospective analysis is somewhat dangerous because the areas delimited today as refugee camps, may have been used for other purposes in the past and or do not represent the
15 http://hot.openstreetmap.org/about 16 http://popstats.unhcr.org/PSQ_TMS.aspx
21 entirely land cover of tent and containers. Plotting a time series, furthermore, this possibly dynamic past may bias the analysis. Then, this present work intend to discuss this aspect.
4.
Datasets
4.1.
Defining the study area:
The study area comprises the ten Turkish provinces that more placed refugees in camps. This region does not cover exactly a geographic area nor a one political-administrative region although most settlements are in Southeastern Anatolia Region, according Turkish administrative divisions. In short, the study area includes the provinces from Mediterranean geographic region
(Adana, Hatay, Kahramanmaraş (a.k.a. K.maras) and Osmaniye), East Anatolia region (only Malatya) and most provinces are from Southeastern Anatolia Region (Adıyaman, Gaziantep,
Mardin, Şanlıurfa and Kilis). Figure 5 illustrate the study area.
Figure 5: Map of number of Syrian refugees in Turkish provinces.18
source: Özden, Şenay 2013, Map composed by the author. info found in: “http://syrianrefugees.eu/?page_id=80”.
22 Figure 5 also shows information about the distribution of RCs. It is visibly clear to realize that the population is hosted in border provinces to Syria. Around 85.9 % of all amount of people of concern (683.299 people according UNHCR). The percentage of refugees registered living outside of camps in these areas are over 50% whereas people allocated in camps in 1, 2, 5, 7 and 8 provinces are housed, in major part, in camps. Although, perceptually, the total amount is not representative. Overall, Around 22 percent of refugees are in camps as can be seem in chart 03. 211.462 refugees (this number is higher according to unofficial balance) are living in tent or containers.
Chart 3: Comparison chart between total and pop. Residing in camps Source: Data from UNHCR composed by the Author
Chart 4: RCs in Turkey
Source: Graph created by USAK with data from AFAD 0
200000 400000 600000 800000 1000000 1200000
16/12/2011 16/02/2012 16/04/2012 16/06/2012 16/08/2012 16/10/2012 16
/12
/20
12
16
/02
/20
13
16/04/2013 16/06/2013 16/08/2013 16/10/2013 16/12/2013 16/02/2014 16/04/2014 16/06/2014 16/08/2014 16/10/2014
Total Population x Camp population
23
4.1.1.
Refugee Camps
–
Two types, one target:
Except the refugees who are lodged in Altınözü 1 which is a RC composed by tents in a warehouse, and Yayladağı 1 which is a mixed RC for having tents in a building and scattered
tents that blend the trees and houses, all other refugees are housed in tent or containers RCs that are clearly distinguished by high resolution image19.
Most official documents from UNHCR, even mention those occupations as city. Container city and tent city. The container camps allow hosting more people per unit if compared to the tent ones. This reflect the total capacity of these camps. Five out of seven container camps studied here house more than 10,000 people. The exception is Apaydin (5013 people at the last camp population map published*) and Uzici camp that is brand new and is still empty.
Medium resolution imagery is not able, as discussed before, to distinguish the type of RC. However, in this study, in which the focus is taking the advantage of the higher time resolution once compared with VHRSI. Nevertheless, satellite remote sensing, with mid-resolution, enables cost-effective and accurate monitoring at frequent time steps over large areas.
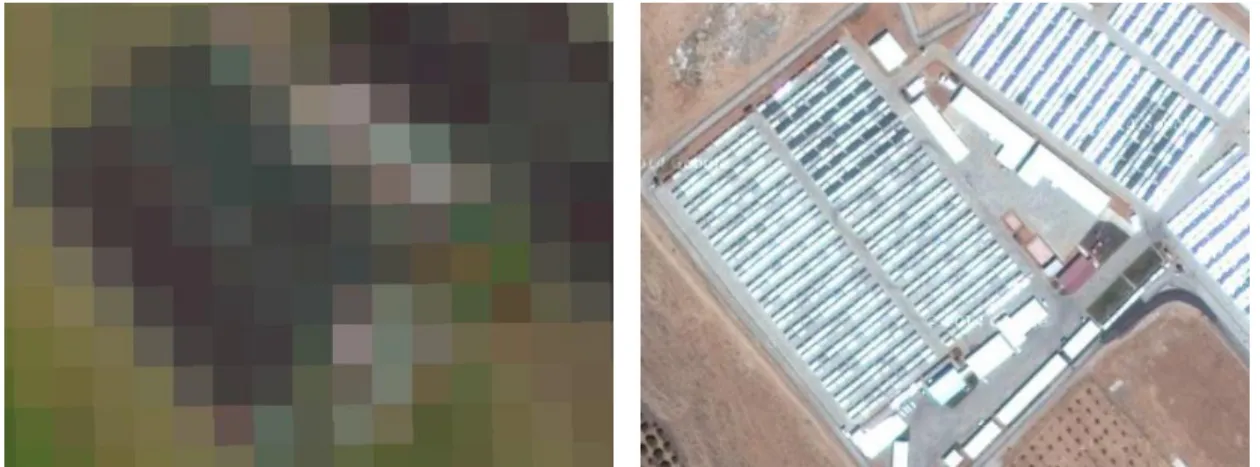
Figure 5: Beydağı RC seem from Landsat 7 and from VHRSI
24
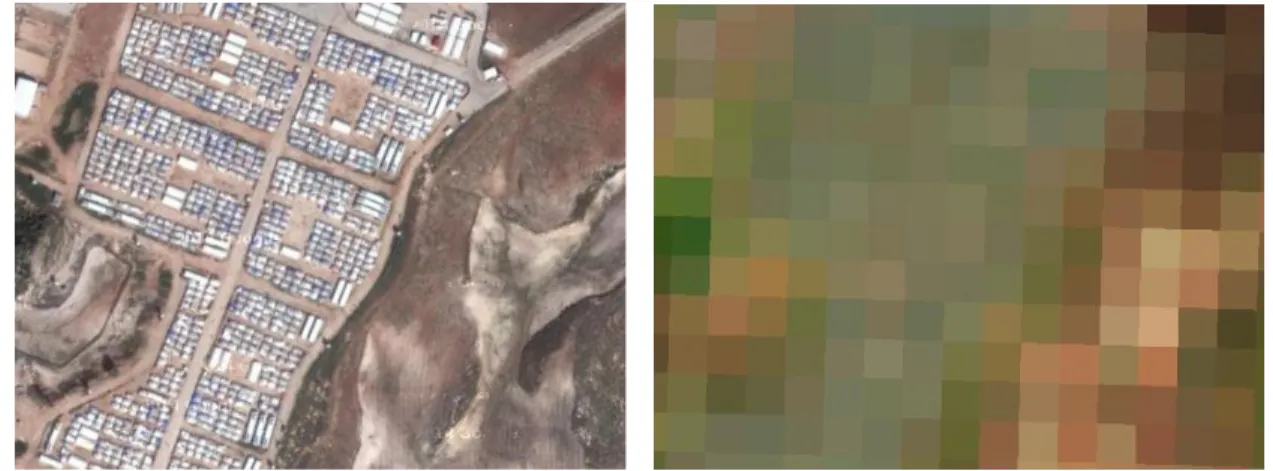
Figure 7: Sarıçam RC seem from VHRSI and Landsat 7
4.2.
Material:
4.2.1.
Images dataset:
Landsat project has a vast archive of data (program has provided over 38 years of Earth's surface data) for monitoring and managing the Earth's resources (Irish, Richard R. – 2000). They are multispectral data set having 30 meters of spatial resolution and its potentials figure mainly environmental studies, but other areas can take advantage of its techniques. However, no matter which field of knowledge uses it, the understanding of the interplay between the natural environment and the human activities is one of the prerequisites to analyses successful any research. The sensor has bands, each representing a portion of the electromagnetic spectrum. The capacity to store the Earth's reflectance in distinct scale defines what the radiometric resolution is. Landsat radiometric resolution is 8 bits. Spectral resolution is classified according the bandwidth. Then, it is a multispectral data of the Earth's surface on a global basis (Landsat – A Global Land-Imaging Mission).
Landsat 5 could not be used due to lack of available images related to the absence of land stations to capture data, there is an empty collection of this satellite in the GEE archive, and its life-cycle ended on may, 2012(Landsat – A Global Land-Imaging Mission). Landsat 8 started to operate from April 2013, right after most intense moviment of refugee flow to Turkey. Then, even with the failure of the Scan Line Corrector (SLC) that happened in May 2003, Landsat 7 is the only sensor who captured images from southeastern Turkey from early 2011 and late 2014.
25 objective is having a timestamp of 15 days; however, due to presence of cloud, timestamp may vary due to technical or environmental limitations.
4.2.2.
Complementary dataset:
Before starting with methodology, it is important to expose beforehand how complementary data were used and prepared for analysis. Consulting UNHCR web data archive, it can be found several maps with the name and position and all camps placed in turkey (as mentioned in Complementary data section). Checking OSM geospatial database is possible to access points and polygons of the each RC in the study area (as elucidated in section 3.2).
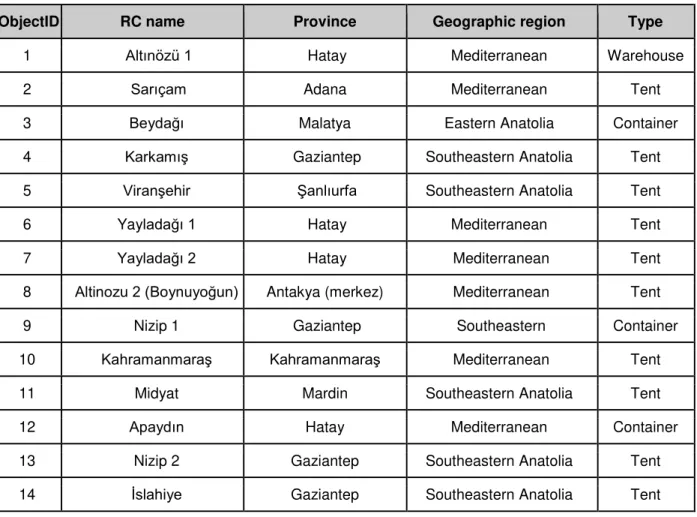
All the 22 polygons were inspected in order to verify if they have possible topologic, geometric and attribute errors. All features are well structured. Afterwards, one multi-feature file were created containing all 22 camps with relevant information found in UNHCR map documents into their attribute table. A new column ObjectID were created to ease manipulation of objects and data. Table 1 is the result.
Table 1: RC used for this study:
ObjectID RC name Province Geographic region Type
1 Altınözü 1 Hatay Mediterranean Warehouse
2 Sarıçam Adana Mediterranean Tent
3 Beydağı Malatya Eastern Anatolia Container
4 Karkamış Gaziantep Southeastern Anatolia Tent
5 Viranşehir Şanlıurfa Southeastern Anatolia Tent
6 Yayladağı 1 Hatay Mediterranean Tent
7 Yayladağı 2 Hatay Mediterranean Tent
8 Altinozu 2 (Boynuyoğun) Antakya (merkez) Mediterranean Tent
9 Nizip 1 Gaziantep Southeastern Container
10 Kahramanmaraş Kahramanmaraş Mediterranean Tent
11 Midyat Mardin Southeastern Anatolia Tent
12 Apaydın Hatay Mediterranean Container
13 Nizip 2 Gaziantep Southeastern Anatolia Tent
26
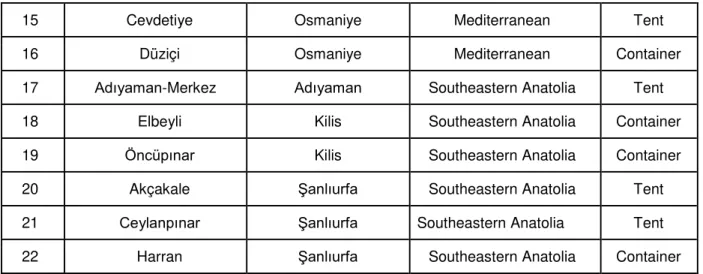
15 Cevdetiye Osmaniye Mediterranean Tent
16 Düziçi Osmaniye Mediterranean Container
17 Adıyaman-Merkez Adıyaman Southeastern Anatolia Tent
18 Elbeyli Kilis Southeastern Anatolia Container
19 Öncüpınar Kilis Southeastern Anatolia Container
20 Akçakale Şanlıurfa Southeastern Anatolia Tent
21 Ceylanpınar Şanlıurfa Southeastern Anatolia Tent
22 Harran Şanlıurfa Southeastern Anatolia Container
Figure 8: Syrian RC Population by province map distribution- updated October 24, 201320
Table 2: Coordinates of each RC.
Object ID
Coordinates (lat/long)
Object ID
Coordinates (lat/long) 1 36°07'48.4"N
36°14'19.3"E 12
36°14'06.3"N 36°21'07.1"E
27 2 37°02'37.3"N
35°29'23.6"E 13
37°02'47.4"N 37°53'42.6"E 3 38°20'26.2"N
38°09'13.7"E 14
36°59'03.9"N 36°37'04.6"E 4 6°52'32.2"N
38°01'42.4"E 15
37°08'07.8"N 36°12'19.7"E 5 36°56'14.3"N
40°01'26.5"E 16
37°19'17.4"N 36°27'20.1"E 6 35°54'22.9"N
36°03'00.8"E 17
37°32'47.1"N 38°13'44.7"E 7 35°54'24.3"N
36°03'17.5"E 18
36°39'41.5"N 37°21'46.0"E 8 36°11'02.5"N
36°21'53.9"E 19
36°38'44.5"N 37°05'01.4"E 9 37°02'35.5"N
37°54'13.9"E 20
36°45'11.0"N 38°57'11.8"E 10 37°33'46.7"N
36°58'29.6"E 21
36°48'52.0"N 39°55'24.6"E 11 37°24'41.4"N
41°23'28.2"E 22
36°52'23.6"N 38°55'51.5"E
At the second stage, the multi-feature file were, uploaded to fusion table on Google Drive cloud storage to be used in GEE web platform.
5.
Methodology:
After filtering Landsat 7 collections in order to gather images in which each refugee camp were:
- bounded by vector feature from OSM with valid raster data;
- from the date range chosen for this study (01.01.2011(‘start_date’) and 01.11.2014(‘end_date’))
28 Source code 1: Image collection:
Restricting more cloud cover than 30% would imply significantly decrease of temporal acquis. Table 3 presents the result of all collections created and the number of images stored within each of them.
Table 3: Number of images collected per RC.
Object
ID Name
Images (nº)
Object
ID Name
Images (nº)
1 Altınözü 1 47 12 Apaydın 47
2 Sarıçam 32 13 Nizip 2 78
3 Beydağı 112 14 İslahiye 43
4 Karkamış 78 15 Cevdetiye 75
5 Viranşehir 48 16 Düziçi 75
6 Yayladağı 1 82 17 Adıyaman 36
7 Yayladağı 2 81 18 Elbeyli 133
8 Altinozu 2 47 19 Öncüpınar 92
9 Nizip 1 78 20 Akçakale 132
10 Kahramanmaraş 43 21 Ceylanpınar 103
29 It can be seen that the camps located at the Mediterranean coast has much less images than camps located in southeastern turkey. Furthermore, in all collections, there are less images from the winter season than the summer one. Table 3 also show in red, camps with less than 50 images in their collection. It means, basically, one image per month average.
Next, NDVI, EVI and the bands - blue, green, red, NIR, SWIR-1 and SWIR-2 were descriptors used to chart the values from statistical parameters bounded by OSM vector files. To perform that, reducer methods were used.
In Javascript, method is a collection of statements that are grouped together to perform an operation. In GEE API, a reduce method acts directly on an image collection stacked up by extracting a statistical parameter from all pixels within a given geometry (in ths paper, OSM vector files). These parameters called in documentation as ‘basic reducers’21. They are:
count(), max(), mean(), median(), min(), mode(), product(), sum(), variance(), stdDev() Their names are self-explained, the count() method count the number of pixels in a given area. mean() calculates the mean, median() calculates the median, product() multiplies all values and sum() sum all pixel values. max() prints the pixel value with highest value, min() prints the minimum pixel value in a given area. Mode() exhibit the most common value. variance() and
stdDev() prints variance and standard deviation respectively.
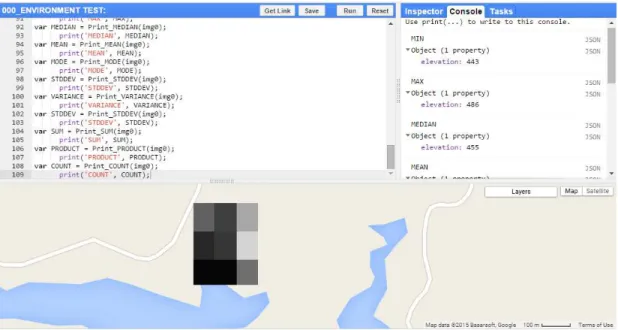
A test environment using SRTM image in which only 9 pixels were selected order to verify the reliability of these reducers22.
21
https://sites.google.com/site/earthengineapidocs/basic-image-manipulation/image-collections/reducing-images
30
Figure 9: Test environment to verify statistical reducers23
All functions are perfectly working. Then, the following step, is the perform each reducer in all 22 image collections created in order to obtain time-series.
Source code 2: Generating time-series:
Source code 2 shows the code call to print time-series. In Figure 10, Image collection
represent one refugee camp image stack in which pixels with TOA values, bounded by a OSM
feature, performs statistical parameters per image as elucidated also before.
31 ………..
Figure 10: Workflow of the present research24
The validation of multi-temporal analysis comes from two sources:
One is GE historical imagery archive in which presents dated images that allow recognize changes along time since when those places were not RCs. VHRSI display tent and containers that can be recognized visually. Hence, here they are used as “ground truth” in order to establish a parallel Between Landsat time-series and VHRSI to interpret the coherence between them. The timeline slider at the taskbar displays and allows change images per date. All 22 points display present images from periods they were not camps. Table 4 summarizes the number and dates from each image per camp.
32 Table 4: Data acquisition dates from each RC in GE.
Object ID
VHRSI in GE
archive (dates) Nº
Object ID
VHRSI in GE
archive (dates) Nº
1 07.07.2010 03.03.2011 10.07.2011 20.07.2011 05.10.2011 19.03.2012 19.01.2013 20.03.2013 21.09.2014
9 12
31.12.2004 26.06.2011 01.07.2011 20.01.2011 06.10.2011 19.03.2012 19.01.2013 20.03.2013 03.04.2013 9 2 12.06.2010 11.09.2012 13.02.2013 06.08.2013 27.09.2013 29.09.2013 05.10.2013 04.05.2014 07.05.2014 13.10.2014
10 13
07.06.2009 16.11.2012 03.05.2013 13.10.2013 4 3 16.04.2011 30.12.2011 11.08.2012 16.08.2013 17.08.2013 05.09.2013 25.03.2014 07.05.2014 26.05.2014 27.07.2014
10 14
14.10.2009 17.03.2012 07.04.2012 18.05.2012 13.10.2012 16.10.2012 01.11.2012 04.11.2012 20.03.2013 24.03.2013 10 4 28.08.2009 01.08.2012 18.09.2012 21.09.2012 20.10.2013
5 15
18.01.2011 14.09.2012 19.01.2013 16.08.2013 20.04.2014 21.09.2014 30.09.2014 7 5 10.11.2010 03.02.2011 09.04.2012
3 16
33 20.04.2014 6 18.06.2010 21.07.2011 23.08.2011 12.02.2012 23.05.2012 04.11.2012 08.04.2013
7 17
09.07.2010 03.09.2012 22.09.2012 03.05.2013 14.10.2013 5 7 18.06.2010 10.07.2011 21.07.2011 23.08.2011 12.02.2012 23.05.2012 04.11.2012 08.04.2013
8 18
22.09.2009 10.06.2011 18.07.2011 27.06.2012 4 8 07.07.2010 26.06.2011 01.07.2011 20.07.2011 06.10.2011 19.03.2012 19.01.2013 03.04.2013
8 19
10.06.2011 06.09.2012 24.09.2012 03.11.2012 12.03.2013 28.04.2013 6 9 08.08.2010 16.11.2012 03.05.2013 13.10.2013
4 20
26.06.2010 18.08.2012 11.08.2013 13.10.2013 12.01.2014 5 10 15.06.2010 11.08.2012 11.04.2013 04.11.2013 09.02.2014 12.04.2014 23.08.2014 30.08.2014 02.09.2014
9 21
03.02.2011 20.04.2012 20.08.2012 18.09.2012 19.09.2012 15.10.2012 17.10.2012 29.10.2012 27.12.2012 08.05.2013 24.08.2013 26.09.2013 12 11 04.07.2010 28.06.2011 06.03.2013 24.11.2013
4 22
10.11.2009 20.03.2013 03.05.2013 07.07.2013
34 The second complementary data are documents from UNHCR providing population count of Syrians displaced2526. These data are in PDF files containing quantitative data that is used to establish correlation with Landsat time-series.
Statistical correlation matrix, interpolations, and other data treatment were performed in Microsoft excel to compare the info obtained from Landsat image processing and census done by UNHCR.
5.1.
Projection concerns:
According to Yildirim, F. and Kaya, A.(2008) in their studies about the best decision in choosing the most proper equal-area projection among the choices provided by ArcGIS 9.0, it pointed out that when parcels are up to the 10 km²r in size, and if 1 m² precision is needed, projection should change. Using equal-area projections in order to calculate the area, such as Albers and Behrmann is recommended.
However, although the study area has around 17,86 km² extension, all 22 camps studied are too small to change its projection to an equal-area distance. Therefore, the default from GEE projection (WGS84) is used to calculate area from geometries.
6.
Results and Discussion:
6.1.
Preliminary findings - Overall analysis:
Three RCs were not able to be studied. Altınözü 1 (objectID 1) is a tent camp within a warehouse; Nizip1 (objectID 9), SLC failure is responsible to creates huge gap with no data for all images in its collections that hinder reducers to properly calculate statistic and regarding Yayladağı 1, it is located in a mixed area wooded and with buildings. All other 19 features of the camps had significant results as shown below.
25
http://data.unhcr.org/syrianrefugees/documents.php?page=1&view=grid&Country%5B%5D=224&Type%5 B%5D=3
26
35 Regarding the reducers, .count() method counted the number of pixel for a bounded area. Therefore, it ended up to present the same value along the series once it was used the same feature from OSM over time. .min(), .max() and .product() are so subjective to cloud cover, noise snow and light incidence along the time. .sum(), .median(), .mean() and .mode() has shown shifts in the series. However, .mean() is the best parameter to visualize once its data present smallest variance when compared to data obtained from .sum(), .median() and .mode(). For abrupt changes, StdDev() and .variance() print peaks along the days refugee camps were being settled. However, .variance() method prints charts with higher range values so that the peaks are better visualized. Therefore, all the analysis here performed are going to used the mean and variance time-series for RCs.
Regarding descriptors, there is not that stands out for all reducers. Blue band and SWIR-1 band, for example, are best to visualize shift in mean time-series because they present small variance and significant shift when compared with others descriptors used. So that the transition from land non-occupied to one covered by tent or containers can be better interpreted. On the other hand, red, NIR and SWIR-2 best print peaks when variance algorithm is used to get time-series by showing high data variance in the chart. For that reason, Blue band is the descriptor used to provide data to calculate the mean time-series and red and NIR the ones to provide data to generate the variance time-series.
36
Figure 11: Chart picturing variance historical image archive from GE.
However, peaks that present only one high value and bands reaching so close spectral values are strong indicators that there are interference upon the RC. Figure 12 shows unique peaks in July 2011, January 2012 and January 2013. when those images were inspected, could be seen the presence of clouds.
37 Pink box picture indicate the moment changes happened. The scene from GE on 18 August 2012 (Figure 12) historical archive were taken during the camp occupation and proves whenever visualizing bands that displays high and low values are more powerful to recognize changes in the land cover.
There is no mixing of camp type. Container camp has only containers and the same stand for tent ones. Container camps, once installed, did not vary its geometry nor its facilities places, as can be observed with GE historical archive. The relation containers per square meter in each camp is the same, whereas tent camps is right the opposite. More dynamic, they can clearly show through satellite imagery (GE historical archive) how overcrowded or empty they might be. Analysis now is subdivided into three ways. The first one about container camps, the second one about tent and the third is about perspectives
6.2.
Container camps:
Recognizing changes with retrospective time-series analysis of container camps, as mentioned before, can be visualizing charts of variance() and mean() from each camp. In annex 1, is possible to see each time series per container camp. One common behavior of these camp type is that they were built faster than tent camps and variance printed does not last longer as tent RCs. Its facilities stand still, once installed, they are kept in the same arrangement.
38 Figure 13: scene acquired 10.10.2011. No container
can be seen.
Figure 14: scene acquired 08.08.2013. Containers are already settled.
This fact bring us to another question: Is Landsat only able to identify refugee camps when the land cover are, somehow, changed also. Düziçi RC is the only one in which the land cover has not undergone changes.
6.3.
Tent camps:
The majority of camps are tent ones (16 total). Sarıçam, Viranşehir Altinozu 2,
Kahramanmaraş, Nizip 2, İslahiye, Cevdetiye, Adıyaman nd Ceylanpınar expressed similar behavior as container refugee camps by displaying a shift in the blue mean band. In Yayladağı 2’s charts, it is also visible although the slight shift.
Regarding Altinozu 2 camp, it is interesting to see because although the mean value shows clearly when this camp was settled (only with the shift). Variance chart indicated how dynamic was the change of tent as can be seem in GE. Figure 15 pictures it.
39
10.06.2011 19.03.2012 19.01.2013
Figure 15: different ‘tent cover’ in time. Altinozu 2 (ObjectID 8) RC. Source: GE historical archive.
Karkamış refugee camp variation chart present 3 moments with intense variance. This suggest there was significant change in tent cover although nothing can be confirm due to lack of high resolution images in GE archive. Its first occupation can be identified with the shift of mean blue band. In case of Nizip 2 and Cevdetiye RCs, variance is not working; however, it is possible to see the shift in the blue band chart. Midyat refugee camp charts does not show abrupt change because of lack of data. There is a gap between September 2012 and mid May 2013. Blue mean chart suggested the camp was created somewhere in this gap.
Tent camps are more dynamic in a way they can increase the number of tent in the same area (intensification) and they can spread to along the area (expansion). This allows us trying to estimate the amount of population are there. On this way, count() method can be useful if another approach is implemented in order to capture the changing shape along the growing phase. Another code was done in order to create geometries per time stamp and count the number of pixels for each tent camp27.
40 Source code 3: code to create raster according a given threshold (where method):
Below, the result of the code 3:
Figure 16: feature automatically generated from 07.04.2013.
Figure 17: feature automatically generated from 01.11.2014.
As expected, the occupation of tent along camps is not equally distributed within the area assigned to them.
41 Chart 5 Number of total pixels per month and total population.
Following ,table 5, presente the correlation matrix of the previous chart values. Table 5:Correlation between the total of population
and nº of pixels from tent camps.
TOTAL pixel TOTAL pop
TOTAL pixel 1
TOTAL pop 0,717611 1
Therefore, it ca be seen a high correlation between Landsat data and the inflow of population to tent RCs along time. This overall result indicate Landsat can be used to provide information to international organizations estimate the number of people within a tent camp when there are no census data available. Next, section is a study case of one refugee camp in which the focus is trying identify if it is possible to see similar results at a unit level.
105000 110000 115000 120000 125000 130000 135000
0 1000 2000 3000 4000 5000 6000
Number of pixels x pop in Tent camps
42
6.4.
Study case
–
Akçakale Camp:
Akçakale camp is a good RC to use as study case because data availability. There are 132 images in its collection, it is a tent refugee camp, its occupation has several complementary data from GE historical archive, UNHCR population statistics that allow us to make a deeper analysis and SLC failure does not affect considerably the area.
As shown in Figure 11, a GE archive images from 18 august 2012 presenting Akçakale camp on the course to be occupied. Applying the algorithm created to generate automatically features per time stamp (source code 3), came up a result as seen in Chart 6. It was possible to identify the appearance of pixels at the beginning of June 2012, then slowing the growth in July 2012 and in august 2012, its restarted growth to reach its maximum level on 27 May 2013.
Chart 6 Comparison of growing variance and area along the time-series.
It is important to mention also Landsat 8 was used from 12 June 2013 till November 2014 with the same parameters used in Landsat 7. It has shown a variation that was not able to prove by lack of complementary data (only VHRSI from 13.10.2013 and 12.01.2014 available in GE archive) that helped to justify such variation in shape this camp had along time. Error is one non-discarded possibility, and the code could be improved as well as the need for a new complementary data that could integrate this kind of research.
0 0,1 0,2 0,3 0,4 0,5 0,6 0,7 0,8 0,9 1 0 0,01 0,02 0,03 0,04 0,05 0,06 Km² TOA v a lu e
Variance
x
Area
time series of
Akçakale
Camp
43 Next, there is another approach using blue band mean values. Calculating its moving average, that is a trend-following or lagging indicator because it is based on past values, is possible to smooth the series and visualize better the shift between the time it was not occupied to when it was full of tent.
Chart 7: Comparison among blue descriptor and two moving average.
Unfortunately, during the period Akçakale refugee camp was occupied, there was no population data per camp. Therefore, chart 3, that provides the total amount of registered people, is used for this analysis as shown in chart 8.
0 0,05 0,1 0,15 0,2 0,25 0,3 0,35 0,4 0,45 0,5
Akçakale Time-series
44 Chart 8: Normalized total population, blue mean band and its mean average during the shift period.
Extracting the correlation table (table 6), it is possible to see that mean blue band moving average with 10 intervals have almost twice the correlation the blue band alone has with population data. One can assume that besides the need to process these data to get a better interpretation, most of Syrian refugees that entered to Turkey between October 2011 and October 2013 went to live in Akçakale camp.
This, approach is powerful because one can better estimate the total amount of refugees per tent camp during the period the population data were not precise.
0 50 100 150 200 250
Normalized Akçakale time-series
45 Table 6: Correlation between the total of population and Akçakale data time-series.
Population Mean Blue band(MBb) MBb moving average 5 intervals MBb moving average 10 intervals
Population 1 Mean Blue
band(MBb) 0,45208 1
MBb moving average 5
intervals
0,72259 0,55035 1
MBb moving average 10
intervals
0,81796 0,65367 0,90255 1
7.
Other potential studies:
Remote sensing in humanitarian sector opened wide range of possibilities of scientific researches. There is no clear methodology and its Ontology is still in development. Little has been known about how to take the advantage of spectral and time resolution. Questions, e.g., as if is it possible to identify characteristic from the spectral signatures of tent and container camps should be answered.
Side effects such as damage to cultural heritage sites, potentially impacts in water reservoir and crops in areas surrounded by RCs usually, as previous conflicts in other places has shown (“Eyes in the Sky” - Physicstoday's scientific magazine, 2014), happens and are other elements in the scope of international organizations concerns.
46 In some cases, the abrupt changes observed in the satellite imagery can be pin-pointed to specific events in which open linked data could be another powerful source of complementary data to validate refugee camps changes and refugee flows.
In addition, multi-scale analysis by using also coarser MODIS sensor as (Schimmer, Russell – 2008) performed a study to assess the influences of climate and land use on a fragile environment using remote sensing applications in Darfur - Sudan can enrich the current topic with more information.
This study, furthermore, did not respect geographic aspects in order to obtain the best statistic methods and descriptors per RC. Instead, the attempt to identify a common descriptor and distinguish how containers camps and tent ones behave is the primary focus of this work. Considering the general law of geography in which all areas are given as unique (Hartshorne, Richard – 1963) All camps deserve to be seen as unique as long as they are spread out in a large study area.
8.
Conclusions and Perspectives:
Although GEE provides filtered and calibrated imagery, once a time-series is set, environmental disturbance, seasonality and noise is always a concern when dealt with small areas. Another important issue that may hinder a bit the research is related to the features used from OSM in which delineates the official area of RCs bounded by Turkish government. Which means that the land covered by tents and containers do not fill faithfully all the geometries. However, working with those features were satisfactory for the this study.
Variance() is a reducer very sensitive to atmospheric dynamics and other disturbances, however the approach of this first stage is only able to say that something, possibly, changed, and additional results from other reducers is required. mean() method demonstrated being the parameter that should follow the analysis.
Regarding the code to generate the charts, another disadvantage is the static and locally feature that is not able to show moves or recognize new camps in the study area.
47 possible solution is testing new descriptors such as ratio between bands, thermal bands and putting more effort on modeling the features.
Retrospective analysis using the variance() algorithm turned out to be a powerful tool to recognize RCs changes by taking the advantage of the time resolution Landsat imagery has over high resolution ones. This approach to visually analyses retrospective time series can be a powerful tool for international organizations, for example, that have restrictions to access some RCs by the Turkish government to reinforce their actions. As this algorithm performs the difference between an image and it’s subsequent, the resulting values have low atmospheric interference and very low difference of the angle of solar incidence.
Although the mean Blue band demonstrated to be highly satisfactory parameter to indicate land cover transition from a non-occupied RC to a occupied one by printing shift in the time-series chart, the variance of Red and NIR bands are accurate to indicate, with peaks, when is the start and ending points of this shift. Observing all graphs containing more than two bands is essential to identify the interference of cloud and snow within the series. Cloud filter is a parameter in GEE which its values is measured for the entire scene. Therefore, even if there is almost no cloud within the whole scene, a minimum presence upon the chosen points may bias the chart analysis. However, there is a way to identify those errors that is impossible to avoid by observing more than two bands at the same time.
In this study, EO analysis only using mid-resolution has strong limitations and cannot be treated as only source of evidence. It is needed additional data to validate the findings, therefore, like most studies using EO to identify human right violation, provide circumstantial or other indirect evidence of facts such pictures, videos of VHRSI and so forth. Nevertheless, the availability of high-resolution images through GE in much helped to corroborate and understand the findings about refugee land cover. Hybrid solutions have been increasingly adopted because enable cost reduction and explore the potentialities of each sensor. The need to understand and differentiate the normal phonological cycle of the environment before focusing the object of analysis, in this case, human settlements is crucial to attempt improving data quality.
49
9.
References:
[1].Deville, Pierre, et al. "Dynamic population mapping using mobile phone data." Proceedings of the National Academy of Sciences 111.45 (2014): 15888-15893.
[2]."Eyes in the Sky: Remote Sensing in the Service of Human Rights." Physicstoday's web scientific magazine. Web. 13 Oct. 2014.
<http://scitation.aip.org/content/aip/magazine/physicstoday/news/10.1063/PT.4.0072>.
[3].Gorelick, Noel. "Google Earth Engine". Retrieved 27 February (2014).
<http://adsabs.harvard.edu/abs/2013EGUGA..1511997G>
[4].Hartshorne, Richard. “Perspectives on the Naure of Geography”, John Murray, London, (1963).
[5].Herscher, Andrew. "Surveillant Witnessing: Satellite Imagery and the Visual Politics of Human Rights." Public Culture 26.3 74 (2014): 469-500.
[6].Irish, Richard R. "Landsat 7 science data users handbook." National Aeronautics and Space Administration, Report (2000): 430-15.
[7]."Landsat – A Global Land-Imaging Mission." Landsat Project Description. Web. 13 Oct. 2014.
</http://pubs.usgs.gov/fs/2012/3072/fs2012-3072.pdf>.
[8].Marx, A.j., and T.v. Loboda. "Landsat-based Early Warning System to Detect the Destruction of Villages in Darfur, Sudan." Remote Sensing of Environment 136 (2013): 126-34. Print
[9].Meier, Patrick. "New Information Technologies and Their Impact on the Humanitarian Sector." International Review of the Red Cross 93.884 (2011): 1239-263. Print.
[10]. Moran, Sean, and Patricia Méndez Lorenzo. "Using the Grid for Satellite Imagery with UNOSAT." Internal UNOSAT-CERN report (2005).
[11]. "National Aeronautics and Space Administration." Landsat Data Continuity Mission. Web. 13 Oct. 2014.
50
[12]. Nuñez, Ana Cristina,: “Admissibility of remote sensing evidence before international and regional tribunals” Innovations in Human Rights Monitoring, Working Paper (2012). Paper found in:
< http://www.amnestyusa.org/research/science-for-human-rights/remote-sensing-for-human-rights>
[13]. Özden, Şenay. Syrian Refugees in Turkey, MPC Research Reports 2013/05, Robert
Schuman Centre for Advanced Studies, San Domenico di Fiesole (FI): European University Institute, 2013.
[14]. Pebesma, Edzer, et al. "The R software environment in reproducible geoscientific research." Eos, Transactions American Geophysical Union 93.16 (2012): 163-163.
[15]. Purdy, Ray, and Denise Leung. Evidence from Earth Observation Satellites: Emerging Legal Issues. Leiden: Martinus Nijhoff, 2013. Print.
[16]. "Remote Sensing for Human Rights." Amnesty International USA. Web. 13 Oct. 2014.
<http://www.amnestyusa.org/research/science-for-human-rights/remote-sensing-for-human-rights>.
[17]. Robertson, Andrew, and Steve Olson. Sensing and Shaping Emerging Conflicts: Report of a Workshop by the National Academy of Engineering and the United States Institute of Peace Roundtable on Technology, Science, and Peacebuilding.
[18]. Schimmer, Russell. Tracking the genocide in Darfur: Population displacement as recorded by remote sensing. Yale Center for International and Area Studies, 2008.
[19]. Sinha, Animesh. "Remote Sensing Satellites: Legal Issues in Emerging Technology" [2012] NLUDLRS 40; (2012) 1 NLUD Current Developments in Air and Space Law 247
[20]. Blaschke, Thomas. "Object based image analysis for remote sensing." ISPRS journal of photogrammetry and remote sensing 65.1 (2010): 2-16.