Optimization of growth and bacteriocin production
by
Lactobacillus sakei
subsp.
sakei
2a
Patrícia S. Malheiros
1, Voltaire Sant’Anna
2, Svetoslav D. Todorov
3,
Bernadette D.G.M. Franco
31Departamento de Ciência de Alimentos, Universidade Federal do Rio Grande do Sul, Porto Alegre, RS, Brazil.
2Universidade Estadual do Rio Grande do Sul, Unidade de Encantado, Encantado, RS, Brazil. 3Departamento de Alimentos e Nutrição Experimental, Universidade de São Paulo, São Paulo, SP, Brazil.
Submitted: October 15, 2014; Approved: November 28, 2014.
Abstract
Lactobacillus sakeisubsp.sakei2a is a bacteriocinogenic lactic acid bacterium isolated from
Brazil-ian pork sausage, capable of inhibiting the growth of microbial pathogens, mainly Listeria monocytogenes. In order to optimize bacteriocin production for industrial applications, this study
evaluated the effect of supplementation of MRS broth with glucose, Tween 20, Tween 80, sodium ci-trate, potassium chloride and cysteine, and effect of the initial pH and temperature of incubation of the medium on production of bacteriocins byL. sakei2a. Adding glucose and Tween 20 to the
me-dium, an initial pH of 5.0 or 5.5, and incubation temperatures of 25 °C or 30 °C resulted to the highest bacteriocin yields. Thus, a 24factorial design with the four variables was performed, and statistical analysis showed that it was an adequate model (R2= 0.8296). In the studied range, the four
parame-ters significantly influenced bacteriocin production, with the maximum yield produced at an ini-tial pH between 5.5 and 7.0, a temperature between 25 and 30 °C and supplementation of the MRS broth with glucose from 3.25 to 6.0 g L-1and Tween 20 from 0.575 to 1.15% (v/v). Response Surface Methodology analysis indicated that the highest bacteriocin production (12800 AU mL-1) occurred in the MRS broth supplemented with 5.5 g L-1glucose and 1.05% Tween 20 at an initial pH of 6.28 and an incubation temperature of 25 °C. The amount of bacteriocin produced in commercial MRS broths under the same conditions was only 5600AU mL-1.
Key words:Lactobacillus sakei, bacteriocin, response surface methodology, optimization.
Introduction
Bacteriocins are antimicrobial compounds produced by many different bacterial species. They are ribosomally encoded proteinaceous molecules capable of controlling the growth of pathogenic and spoilage bacteria, and those synthesized by lactic acid bacteria (LAB) have great poten-tial as biopreservation agents in foods (Cotteret al., 2005).
Nisin, produced byLactococcus lactissubsp.lactis, is the
most intensively studied bacteriocin, and its use in foods is permitted in more than 50 countries (Fieldet al., 2012).
However, some bacteria may acquire resistance to nisin (Davis and Adam, 1994; Gardeet al., 2004) or produce
proteolytic substances that inhibit its action (Gardeet al.,
2004; Lianget al., 2010). In this context, studying other
LAB bacteriocins is essential to overcome the limitations of the typical antimicrobials used in food and pharmaceuti-cal practices.
Lactobacillus sakeisubsp.sakei2a (L. sakei2a),
iso-lated from a Brazilian pork sausage sample, is capable of inhibiting the growth ofL. monocytogenesin culture media
and meat models (Martinis et al., 1998; Liserre et al.,
2002). Previous studies have shown that this strain may produce three different antimicrobial compounds: sakacin P, a 6.8 kDa molecule identical to the 30S ribosomal pro-tein S21 ofL. sakeisubsp.sakei23 K and a third 9.5 kDa
DOI: http://dx.doi.org/10.1590/S1517-838246320140279
Send correspondence to P.S Malheiros. Departamento de Ciência de Alimentos, Universidade Federal do Rio Grande do Sul, Av. Bento Gonçalves 9500, 91501-970 Porto Alegre, RS, Brasil. E-mail: [email protected].
molecule identified as a histone-like DNA-binding protein HV produced byL. sakeisubsp.sakei23 (Carvalhoet al.,
2010).
Production of bacteriocins by LAB depends on bacte-rial growth and maximum activity is usually coincident with maximum cell growth (Trinettaet al., 2008). How-ever, environmental factors such as temperature, pH and media composition can influence the level of bacteriocin produced (Abo-Ameret al., 2011). MRS broth remains the most widely used culture medium for growth of LAB (Todorov and Dicks, 2006). Certain components, such as carbohydrates, salts, surfactants or oxygen tension reduc-ing agents added to the MRS broth can interfere with bacteriocin production (Vázquez et al., 2004; Todorov, 2008; Castroet al., 2011). These factors need to be evalu-ated to achieve optimized bacteriocin production for indus-trial applications.
The use of response surface methodology (RSM) has a history of successful application in many fields, espe-cially biotechnology, and is suited for the study of the ef-fects of distinct factors on bacteriocin production (Cla-dera-Oliveraet al., 2004; Leãeset al., 2011; Kumaret al., 2012). Studies have used RSM to evaluate the effect of me-dium components and environmental conditions on the antimicrobial activity of bacteriocins produced byL. lactis
(Liet al., 2002),Micrococcussp. GO5 (Kimet al., 2006),
Lactobacillus acidophilus AA11 (Abo-Ame, 2011),
Lactobacillus plantarum(Delgadoet al., 2007; Hanet al., 2011), andL. casei(Kumaret al., 2012).
The aim of this study was to use RSM for optimizing bacteriocin production byL. sakeisubsp.sakei2a in MRS
broth using different combinations of added ingredi-ents, pH levels and incubation temperatures.
Materials and Methods
Bacterial cultures and media
BacteriocinogenicL. sakeisubsp.sakei2a was grown at 30 °C for 18 h in MRS broth (Difco, Detroit, MI, USA). The formulation of MRS broth per liter was Proteose Peptone (10 g), Beef Extract (10 g), Yeast Extract (5 g), Dextrose (20 g), Polysorbate 80 (1 g), Ammonium Citrate (2 g), Sodium Acetate (5 g), Magnesium Sulfate (0.1 g), Manganese Sulfate (0.05 g) and Dipotassium Phosphate (2 g).L monocytogenesScott A, used as the antimicrobial activity indicator strain, was grown at 37 °C for 24 h in BHI broth (Difco, Detroit, MI, USA). Both strains were stored at -80 °C in presence of 20% (v/v) glycerol.
Antimicrobial activity determination
The antimicrobial activity was monitored by the dou-ble layer diffusion test (Rosaet al., 2002). Shortly, plates
containing agar were overlaid with 5 mL semi-solid BHI (BHI supplemented with 0.7% agar) containing 50mL of a fresh culture ofL. monocytogenesScott A (108cfu mL-1).
The plates were left to dry, and 10mL of the investigated bacteriocin diluted at 1/2, 1/4, 1/8, 1/16, 1/32, 1/48, 1/64, 1/96, 1/128, 1/192 and 1/256 in water was spotted onto the surface. The plates were incubated at 37 °C for 24 h, and the bacteriocin titer was determined. A unit of bacteriocin ac-tivity (AU) was defined as the reciprocal of the highest di-lution that resulted in a visible halo of inhibition. Results were expressed as AU mL-1(Motta and Brandelli, 2002). Two independent experiments were performed, and the av-erage was calculated.
Effect of supplements in MRS broth, pH and
temperature on bacteriocin production byL. sakei2a
Bacteriocin production was assessed in MRS broth (Difco, Detroit, MI, USA) supplemented with glucose (5.0 and 10 mg mL-1), Tween 20 (10 and 20
mL mL-1), Tween 80 (10 and 20mL mL-1), sodium citrate (0.3 and 1.0 mg mL-1), potassium chloride (0.55 and 3 mg mL-1), and cysteine (0.25 to 1.0 mg mL-1). These supplements were selected based on their previously reported influence on bacteriocin production (Vázquezet al., 2004; Todorov, 2008; Castroet al., 2011). The supplements were added to MRS broth and
sterilized by autoclaving (121 °C for 15 min), except for cysteine which was sterilized by filtration (0.22 mm, Millipore Ind. Com. Ltda, USA). Influence of the pH of the culture medium on bacteriocin production was determined by adjusting the initial pH of the MRS broth to 4.5, 5.0, 5.5 and 6.0 with sterile 1N HCl. All tested broths were inocu-lated with an overnight culture ofL. sakei2a (1% v/v) and
incubated at 25 °C for 18 h. The influence of temperature on bacteriocin production was evaluated by incubating MRS broth containingL.sakei2a at 25, 30, 37 and 40 °C
for 18 h. After incubation, the pH of the broths was adjusted to 6.5 with 10N NaOH and heated at 80 °C for 30 min. Cells were harvested by centrifugation at 10,000 x g for 15 min at 4 °C, and the antimicrobial activity in the supernatant was determined as described before.
Optimization of MRS supplementation using response surface methodology
maximum point, a second order polynomial function was fitted to the experimental results. For four factors this equa-tion is:
Y b b x b x b x b x b x
b x b x b x
= + + + + + +
+ +
0 1 1 2 2 3 3 4 4 11 1 22 2 33 3 44
² ² ² ²4 12 1 2 13 1 3
14 1 4 24 2 4 34 3 4 23 2 3
+ + +
+ +
b x x b x x
b x x b x x b x x b x x
(1)
where:Yis the response (bacteriocin production),b0is the intercept,b1,b2,b3andb4are the linear coefficients,b11,b22,
b33andb44are the squared coefficients, andb12,b13,b23,b14,
b24andb34are the interaction coefficients.
Data analysis
Results were analyzed using the Experimental Design Module of the Statistica 10.0 software (Statsoft, OK, USA). The model permitted evaluation of the effects of the linear, quadratic, and interactive terms of the independent vari-ables on the chosen dependent varivari-ables. Three-dimen-sional surface plots were drawn to illustrate the main and interactive effects of the independent variables on bac-teriocin production. The optimum values of the selected variables were obtained by solving the regression equation and also by analyzing the response surface contour plots. The coefficient of determination (R2) was employed for the quality of the fit of the polynomial model equation (Cla-dera-Oliveiraet al., 2004; Leãeset al., 2011).
All experiments were conducted in triplicate, and the averages of two independent tests were calculated. Ob-tained values were compared using Tukey’s test by
Statistica 10.0, and differences were considered statisti-cally significant when p < 0.05.
Results and Discussion
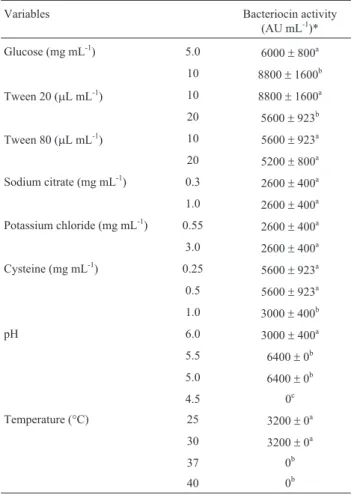
Effects of the addition of glucose, Tween 20, Tween 80, potassium chloride, sodium citrate and cysteine to MRS broth, initial pH of the culture medium and the temperature of incubation on bacteriocin production byL. sakei2a are
shown in Table 1. The highest amount of bacteriocin was obtained in MRS broth containing glucose and Tween 20. Polysorbate surfactants, such as Tween 20 and Tween 80, suppress the adhesion of bacteriocproducing cells, in-creasing the amount of bacteriocin in the culture medium. Increase of the quantity of Tween 80 in MRS broth pro-moted bacteriocin production by Enterococcus faecium
ST311LD (Todorov and Dicks, 2005), and Tween 20 in culture broth enhanced activity of the bacteriocin produced byL.sakei/curvatusACU-1 (Castroet al., 2011). Removal
of Tween 80 from MRS broth did not affect bacteriocin production byL. sakeiST22Ch, but was critical forL. sakei
ST153Ch andL. sakeiST154Ch (Todorovet al., 2013).
Bacteriocin production may be regulated by the amount of glucose in the medium. Increased bacteriocin production in the presence of glucose was recorded forL.
plantarum AMA-K (Todorov and Dicks, 2005) and E.
faeciumST311LD (Todorovet al., 2008). When growing L. sakeiST22Ch in MRS broth supplemented with 10, 20 or
30 g L-1glucose, the amount of bacteriocin ST22Ch pro-duced was 1600 AU mL-1, and the same level of activity was recorded when glucose was replaced by 20 gL-1 fruc-tose, lactose or saccharose. However, when glucose was re-placed by 20 g L-1maltose or 20 g L-1gluconate, a decrease in bacteriocin ST22Ch activity was recorded. These results suggest that the glucose moiety of sucrose was essential for bacteriocin production (Todorovet al., 2013).
Potassium chloride and sodium citrate are salts that influence the synthesis of antimicrobial peptides by LAB (Castroet al., 2011). However, these salts had no effect on bacteriocin production byL. sakei2a. On the other hand, the addition of cysteine to MRS broth increased bacteriocin production, but to a lesser extent than glucose or Tween 20 (Table 2). Cysteine is an amino acid widely used in culture media as a reducing agent to create a more favorable envi-ronment for growth of microaerophilic microorganisms such as LAB (Vázquezet al., 2004).
Table 1- Variables tested for production of bacteriocin byL. sakei2a in MRS broth.
Variables Bacteriocin activity
(AU mL-1)*
Glucose (mg mL-1) 5.0 6000
±800a 10 8800±1600b
Tween 20 (mL mL-1) 10 8800
±1600a 20 5600±923b Tween 80 (mL mL-1) 10 5600±923a
20 5200±800a Sodium citrate (mg mL-1) 0.3 2600
±400a 1.0 2600±400a Potassium chloride (mg mL-1) 0.55 2600
±400a 3.0 2600±400a Cysteine (mg mL-1) 0.25 5600
±923a 0.5 5600±923a 1.0 3000±400b
pH 6.0 3000±400a
5.5 6400±0b 5.0 6400±0b
4.5 0c
Temperature (°C) 25 3200±0a
30 3200±0a
37 0b
40 0b
*Mean±standard error of two independent experiments.
Higher amounts of bacteriocin were produced when the pH of the MRS broth was 5.0 or 5.5 and the incubation temperature was 25 °C or 30 °C. At temperatures above 37 °C and pH below 4.5, the detected amount of bacteriocin was negligible. Similar results were reported for bacte-riocin production by L. acidophilusAA11 in M17 broth
supplemented with 0.5% lactose (Abo-Amer, 2011). Con-versely, production of bacteriocin byL. sakeiST22Ch in MRS broth at pH 5.0 and 5.5 was 50% lower than that pro-duced when the initial pH ranged from 5.5 to 6.0. At a pH of 4.5, very low growth and production of bacteriocin were detected (Todorovet al., 2013). The optimal temperature
and initial pH for bacteriocin production byMicrococcus
sp. GO5 were 37 °C and 7.0-9.0, respectively (Kimet al.,
2006). In general, pH is important for bacteriocin produc-tion because it affects the aggregaproduc-tion of the producing cells and the adsorption of bacteriocin to their surface.
The pH also has an important role in the proteolytic degra-dation of bacteriocins (Cheighet al., 2002).
The initial pH of the MRS broth, incubation tempera-ture and concentration of Tween 20 and glucose in the me-dium were the factors with the most significant influence on bacteriocin production by L. sakei 2a (Table 2), and
were selected for the RSM analysis.
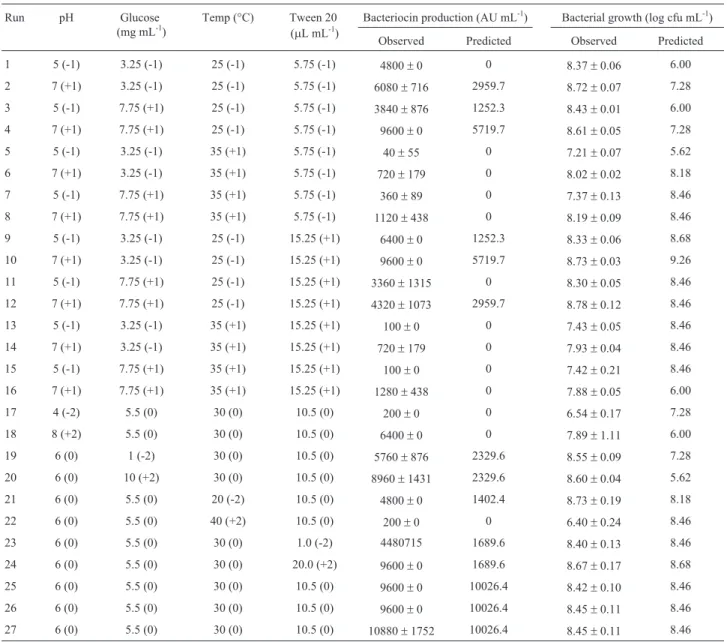
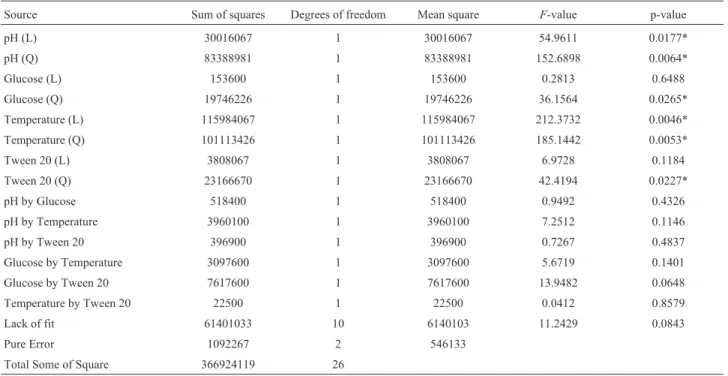
Table 3 presents the results of the analysis of variance (ANOVA) employed for determining the significant pa-rameters and for estimating the production of bacteriocin byL. sakei2a as a function of these four variables. The
re-sulting regression equation presented a determination coef-ficient (R2) of 0.8296, and a non-significant (p > 0.05) test of lack of fit, indicating that 82.96% of the total variation was explained by the model. In addition, the calculated
F-value model was 5.3, which is twice as high as the F-value for 95% confidence (Ft9,8= 2.4) found in statistical
Table 2- Experimental design and results for production of bacteriocin byL. sakei2a.
Run pH Glucose
(mg mL-1) Temp (°C) Tween 20
(mL mL-1)
Bacteriocin production (AU mL-1) Bacterial growth (log cfu mL-1)
Observed Predicted Observed Predicted
1 5 (-1) 3.25 (-1) 25 (-1) 5.75 (-1) 4800±0 0 8.37±0.06 6.00
2 7 (+1) 3.25 (-1) 25 (-1) 5.75 (-1) 6080±716 2959.7 8.72±0.07 7.28
3 5 (-1) 7.75 (+1) 25 (-1) 5.75 (-1) 3840±876 1252.3 8.43±0.01 6.00
4 7 (+1) 7.75 (+1) 25 (-1) 5.75 (-1) 9600±0 5719.7 8.61±0.05 7.28
5 5 (-1) 3.25 (-1) 35 (+1) 5.75 (-1) 40±55 0 7.21±0.07 5.62
6 7 (+1) 3.25 (-1) 35 (+1) 5.75 (-1) 720±179 0 8.02±0.02 8.18
7 5 (-1) 7.75 (+1) 35 (+1) 5.75 (-1) 360±89 0 7.37±0.13 8.46
8 7 (+1) 7.75 (+1) 35 (+1) 5.75 (-1) 1120±438 0 8.19±0.09 8.46
9 5 (-1) 3.25 (-1) 25 (-1) 15.25 (+1) 6400±0 1252.3 8.33±0.06 8.68
10 7 (+1) 3.25 (-1) 25 (-1) 15.25 (+1) 9600±0 5719.7 8.73±0.03 9.26
11 5 (-1) 7.75 (+1) 25 (-1) 15.25 (+1) 3360±1315 0 8.30±0.05 8.46
12 7 (+1) 7.75 (+1) 25 (-1) 15.25 (+1) 4320±1073 2959.7 8.78±0.12 8.46
13 5 (-1) 3.25 (-1) 35 (+1) 15.25 (+1) 100±0 0 7.43±0.05 8.46
14 7 (+1) 3.25 (-1) 35 (+1) 15.25 (+1) 720±179 0 7.93±0.04 8.46
15 5 (-1) 7.75 (+1) 35 (+1) 15.25 (+1) 100±0 0 7.42±0.21 8.46
16 7 (+1) 7.75 (+1) 35 (+1) 15.25 (+1) 1280±438 0 7.88±0.05 6.00
17 4 (-2) 5.5 (0) 30 (0) 10.5 (0) 200±0 0 6.54±0.17 7.28
18 8 (+2) 5.5 (0) 30 (0) 10.5 (0) 6400±0 0 7.89±1.11 6.00
19 6 (0) 1 (-2) 30 (0) 10.5 (0) 5760±876 2329.6 8.55±0.09 7.28
20 6 (0) 10 (+2) 30 (0) 10.5 (0) 8960±1431 2329.6 8.60±0.04 5.62
21 6 (0) 5.5 (0) 20 (-2) 10.5 (0) 4800±0 1402.4 8.73±0.19 8.18
22 6 (0) 5.5 (0) 40 (+2) 10.5 (0) 200±0 0 6.40±0.24 8.46
23 6 (0) 5.5 (0) 30 (0) 1.0 (-2) 4480715 1689.6 8.40±0.13 8.46
24 6 (0) 5.5 (0) 30 (0) 20.0 (+2) 9600±0 1689.6 8.67±0.17 8.68
25 6 (0) 5.5 (0) 30 (0) 10.5 (0) 9600±0 10026.4 8.42±0.10 8.46
26 6 (0) 5.5 (0) 30 (0) 10.5 (0) 9600±0 10026.4 8.45±0.11 8.46
tables and demonstrates the significance of the regression model. Analysis of variance also indicated that the smaller theP-value, the more significant the corresponding
coeffi-cient. For the production of antimicrobial peptides byL. sakei2a, linear and quadratic effects of pH and temperature
were significant (PT,PT-T,PpH,PpH-pH< 0.05). The quadratic effects of the glucose and Tween 20 concentrations (P
Glu-cose-Glucose, PTween20-Tween20 < 0.05,PpH-pH < 0.05) indicated
that they can act as limiting factors, and variation in their values will alter bacteriocin activity to a considerable extent. The interaction of glucose and Tween 20 concentra-tion was also significant in predicting bacteriocin produc-tion with 93% confidence Thus, the following equaproduc-tion was obtained:
Y x x x
x
= + - -
-100267 22337 3954 2 1924 2
43967 43
1 12 22
3
. . . .
. 54 2 32 2084 2 1380
4 2
2 4
. x - . x - x x
(2)
The “one-at-a time” optimization technique is mas-sive, time consuming and usually ignores the importance of interactions between the process variables. In the statistical regression equations, positive constants in the linear effects indicate that higher values of the variable enhance bac-teriocin production, and negative parameters indicate that the variable reduces or inhibits bacteriocin production. Also, significant quadratic parameters contribute to the cur-vature of the contour curve, giving a concavity to the graphic (downward if the variable constant is negative and upward if the variable constant is positive), and conse-quently the studied variable has an optimal point. In this
context, RSM is a powerful tool for optimizing biotechno-logical processes (Anthonyet al., 2009; Leãeset al., 2011).
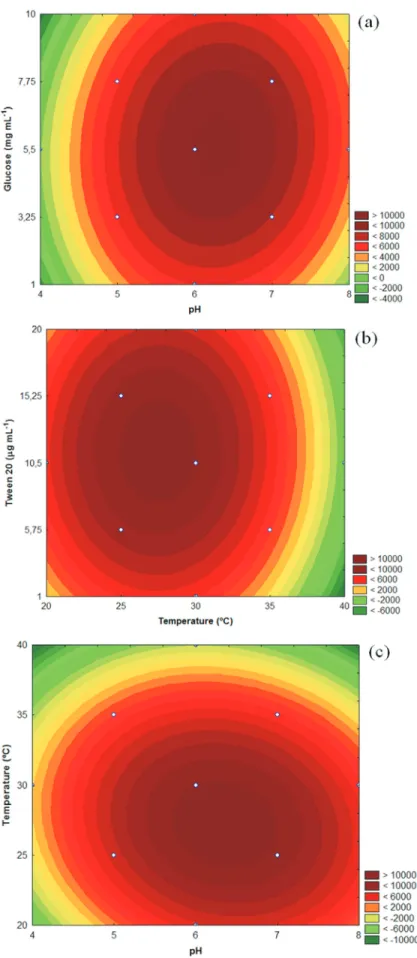
The three-dimensional response surface curves obtained by plotting the above equation are shown in Figure 1. Equation 2 shows that the four variables have significant negative quadratic effects, and graphical analysis show downward concavity, and thus glucose, pH, temperature and Tween 20 concentration produce optimal bacteriocin production (Figure 1). In the range studied, ANOVA (Table 3) results show that the four variables had a significant effect on bac-teriocin production. Response surface data showed maxi-mum bacteriocin production at an initial pH between 5.5 and 7.0, a temperature between 25 and 30 °C and supplementation of MRS broth with glucose and Tween 20 in the range of 3.25 to 6.0 g L-1and 0.575 to 1.15% (v/v), re-spectively. The addition of glucose and Tween 20 to MRS broth for all concentrations tested increased the yield of bacteriocin production compared with the control MRS broth at 25 or 30 °C. According to Kumaret al.(2012),
the pH and temperature were effective for bacteriocin pro-duction byL. caseiLA-1 ranging of 6.8 to 7.2 and 33.5 to
34.5 °C, respectively. Leeet al.(2012) also showed that
glucose concentration and initial pH had a large influence on the production of bacteriocins byLactobacillus brevis
DF01.
The effects of pH and temperature are very important for bacteriocin production, as reported for bacteriocins pro-duced byL. mesenteroidesFR52 (Krieret al., 1998), L. plantarum17.2b (Delgadoet al., 2007), andBacillusspp.
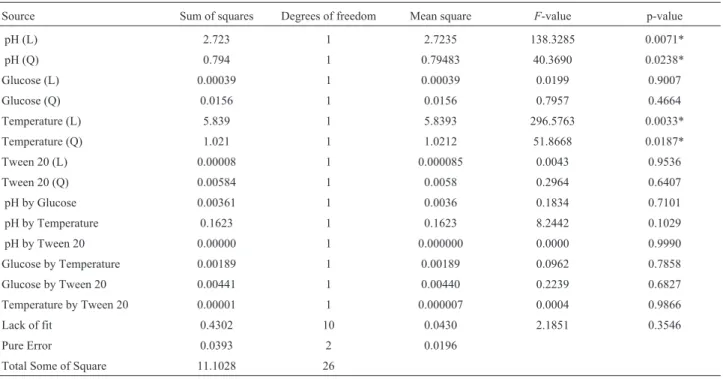
P11 (Leãeset al., 2011), among others. Using the RSM Table 3- Analysis of variance for the model estimated for production of bacteriocin byL. sakei2a.
Source Sum of squares Degrees of freedom Mean square F-value p-value
pH (L) 30016067 1 30016067 54.9611 0.0177*
pH (Q) 83388981 1 83388981 152.6898 0.0064*
Glucose (L) 153600 1 153600 0.2813 0.6488
Glucose (Q) 19746226 1 19746226 36.1564 0.0265*
Temperature (L) 115984067 1 115984067 212.3732 0.0046*
Temperature (Q) 101113426 1 101113426 185.1442 0.0053*
Tween 20 (L) 3808067 1 3808067 6.9728 0.1184
Tween 20 (Q) 23166670 1 23166670 42.4194 0.0227*
pH by Glucose 518400 1 518400 0.9492 0.4326
pH by Temperature 3960100 1 3960100 7.2512 0.1146
pH by Tween 20 396900 1 396900 0.7267 0.4837
Glucose by Temperature 3097600 1 3097600 5.6719 0.1401
Glucose by Tween 20 7617600 1 7617600 13.9482 0.0648
Temperature by Tween 20 22500 1 22500 0.0412 0.8579
Lack of fit 61401033 10 6140103 11.2429 0.0843
Pure Error 1092267 2 546133
Total Some of Square 366924119 26
Figure 1- Response surface of bacteriocin production (AU mL-1) byL. sakei2a in MRS broth as a function of (a) glucose concentration (mg mL-1) and
methodology, it was possible to demonstrate that these pa-rameters are also fundamental for bacteriocin production byL. sakei2a, beyond the supplementation of MRS broth
with glucose and Tween 20. Glucose, an important carbon source, may both induce and inhibit the activity of bac-teriocins in a strain-dependent manner (Todorov, 2008; Abo-Ameret al., 2011). AL. plantarumAMA-K medium
supplemented with glucose induced the synthesis of bac-teriocin (Todorov, 2008), as was also detected in the pres-ent work. Likewise, MRS broth supplempres-ented with Tween 20 enhancedL. curvatus/ L. curvatusACU-1 bacteriocin
activity (Castro et al., 2011). Tween 20 is a non-ionic
surfactant agent capable of increasing bacteriocin produc-tion due to its effect on membrane fluidity and stimulaproduc-tion of the secretion of proteins (Reese and Maguire, 1969).
According to the analysis of variance and Fischer’s test results (Table 4), the obtained regression equation for growth ofL. sakei2a indicated that the calculatedF-value
was 19.3, which is eight times higher than the tabulated
F-value (2.4). The R2-value estimated for the regression
model was 0.9577, with a non-significant (p > 0.05) of test of lack of fit. The quadratic and linear effects of pH and temperature on growth of L. sakei 2a, as indicated by
ANOVA, were significant (p < 0.05), leading to the follow-ing equation:
Y =846 064+ x1-039x1 -099x -044x
2
3 3
2
. . . (3)
The three-dimensional response surface ofL. sakei2a
growth as a function of the initial pH and incubation
tem-perature is shown in Figure 2. Response surface data showed maximum growth at an initial pH between 5.5 and 7.5 and a temperature between 20 and 30 °C. Therefore, the optimum condition for growth ofL. sakei2a is within the
range of optimal production of bacteriocin. Mataragaset al.
(2003) demonstrated that decreasing the temperature below the optimum for growth improved bacteriocin production. A high correlation between biomass production and bac-teriocin synthesis was reported for L. lactis (De Vuyst,
1995),Brevibacterium linens(Motta and Brandelli, 2003)
andL. casei LA-1 (Kumaret al., 2012). However, many
studies performed with other LAB have shown that the op-timal conditions for bacteriocin production are different than those for optimal growth (Liet al., 2002; Mataragaset al., 2003; Abo-Amer, 2011). Therefore, these parameters must be evaluated case-by-case and be considered strain-dependent.
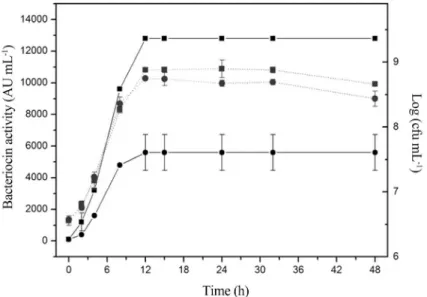
By mathematical optimization (from setting the first derivative equal to zero with respect to each variable), the best conditions for bacteriocin production are: an initial pH of 6.28, a temperature of 25 °C, glucose concentration of 5.5 mg mL-1and Tween 20 concentration of 10.5mL mL-1. Under these conditions,L. sakei2a produced more then 2 time more bacteriocin (12800 AU mL-1) than in the non-optimized counterpart (5600 AU mL-1) (Figure 3). The highest production of bacteriocin occurred after 12 h of in-cubation, coinciding with the early stationary phase of growth. Similar trends were reported previously for other bacteriocinogenicL. sakei strains (Leroy and De Vuyst,
Table 4- Analysis of variance for the model and the regression coefficients estimated for production of bacteriocin byL. sakei2a.
Source Sum of squares Degrees of freedom Mean square F-value p-value
pH (L) 2.723 1 2.7235 138.3285 0.0071*
pH (Q) 0.794 1 0.79483 40.3690 0.0238*
Glucose (L) 0.00039 1 0.00039 0.0199 0.9007
Glucose (Q) 0.0156 1 0.0156 0.7957 0.4664
Temperature (L) 5.839 1 5.8393 296.5763 0.0033*
Temperature (Q) 1.021 1 1.0212 51.8668 0.0187*
Tween 20 (L) 0.00008 1 0.000085 0.0043 0.9536
Tween 20 (Q) 0.00584 1 0.0058 0.2964 0.6407
pH by Glucose 0.00361 1 0.0036 0.1834 0.7101
pH by Temperature 0.1623 1 0.1623 8.2442 0.1029
pH by Tween 20 0.00000 1 0.000000 0.0000 0.9990
Glucose by Temperature 0.00189 1 0.00189 0.0962 0.7858
Glucose by Tween 20 0.00441 1 0.00440 0.2239 0.6827
Temperature by Tween 20 0.00001 1 0.000007 0.0004 0.9866
Lack of fit 0.4302 10 0.0430 2.1851 0.3546
Pure Error 0.0393 2 0.0196
Total Some of Square 11.1028 26
2003) and for bacteriocin-like inhibitory substances from
L. sakei/L. curvatusACU-1 (Castroet al., 2011). Because the antimicrobial activity started at the exponential growth phase and reached maximum values at the stationary phase, it is reasonable to consider bacteriocin a primary metabolite (Cheikhyoussef et al., 2009; Todorov and Dicks, 2009). The activity of bacteriocin remained unaltered for 48 h of
incubation at 25 °C, suggesting that extracellular proteases were not produced.
Conclusion
Supplementation of MRS broth with glucose and Tween 20 increased the production of bacteriocin byL. sakei2a. A RSM indicated that maximum bacteriocin pro-Figure 2- Response surface ofL. sakei2a growth (log cfu mL-1) in MRS broth as a function of temperature (°C) and initial pH.
Figure 3- Bacteriocin activity (-) and bacterial growth (...) ofL. sakei2a in MRS broth supplemented with glucose (5.5 mg mL-1) and Tween 20
(10.5mL mL-1) at optimal conditions of temperature (25 °C) and initial pH (6.28) (
l) or in a commercial MRS broth (Difco) control (n). Each point
duction in MRS broth was achieved at an initial pH of 6.28, an incubation temperature of 25 °C, a glucose concentra-tion of 5.5 mg mL-1 and a Tween 20 concentration of 10.5mL mL-1.L. sakei2a reached the stationary phase after 12 h of cultivation, coinciding with maximum bacteriocin yield. These parameters are important for the optimization of growth and bacteriocin production, essential for the use of this strain or its bacteriocins as biopreservation agents for industrial applications.
Acknowledgments
The study was supported by FAPESP, CAPES and CNPq.
References
Abo-Amer AE (2011) Optimization of bacteriocin production by Lactobacillus acidophilusAA11, a strain isolated from Egy-ptian cheese. Ann Microbiol 61:445-452.
Anthony T, Rajesh T, Kayalvizhi Net al.(2009) Influence of me-dium components and fermentation conditions on the pro-duction of bacteriocin(s) byBacillus licheniformisAnBa9. Biores Technol 100:872-877.
Carvalho KG, Bambirra FHS, Kruger MFet al. (2010) Anti-microbial compounds produced by Lactobacillus sakei subsp.sakei2a, a bacteriocinogenic strain isolated from a Brazilian meat product. J Ind Microbiol Biotechnol 37:381-390.
Castro MP, Palavecino NZ, Herman COet al.(2011) Lactic acid bacteria isolated from artisanal dry sausages: Characteriza-tion of antibacterial compounds and study of the factors af-fecting bacteriocin production. Meat Sci 87:321-329. Cheigh CI, Choi HJ, Park Het al.(2002) Influence of growth
con-ditions on the production of a nisin-like bacteriocin by Lactococcus lactissubsp.lactisA164 isolated from kimchi. J Biotech 95:225-235.
Cheikhyoussef A, Pogori N, Chen Het al.(2009) Antimicrobial activity and partial characterization of bacterioclike in-hibitory substances (BLIS) produced by Bifidobacterium infantisBCRC 14602. Food Control 20:553-559.
Cladera-Oliveira F, Caron GR, Brandelli A (2004) Bacteriocin production by Bacillus licheniformisstrain P40 in cheese whey using response surface methodology. Bioch Eng J 21:53-58.
Cotter PD, Hill C, Ross P (2005) Bacteriocins: developing innate immunity for food. Nat Rev Microbiol 3:777-788.
Davies EA, Adams MR (1994) Resistance of Listeria monocytogenesto the bacteriocin nisin. Int J Food Microbiol 21:341-347.
De Vuyst L (1995) Nutritional factors affecting nisin production byLactococcus lactissubsp.lactisNIZO 22186 in a syn-thetic medium. J Appl Bacteriol 78:28-33.
Delgado A, López FNA, Brito Det al.(2007) Optimum bacterio-cin production byLactobacillus plantarum17.2b requires absence of NaCl and apparently follows a mixed metabolite kinetics. J Biotechnol 130:193-201.
Field D, Begley M, O’Connor PMet al. (2012) Bioengineered nisin A derivatives with enhanced activity against both
Gram positive and Gram negative pathogens. Plos One 7:1-12.
Garde S, Ávila M, MEDINA Met al.(2004) Fast induction of nisin resistance in Streptococcus thermophilus INIA 463 during growth in milk. Int J Food Microbiol 96:165-172. Han B, Yu Z, Liu Bet al.(2011) Optimization of bacteriocin
pro-duction byLactobacillus plantarumYJG, isolated from the mucosa of the gut of healthy chickens. Afr J Microbiol Res 5:1147-1155.
Kim MH, Kong YJ, Baek Het al.(2006) Optimization of culture conditions and medium composition for the production of micrococcin GO5 byMicrococcussp. GO5. J Biotechnol 121:54-61.
Krier F, Revol-Junelles AM, Germain P (1998) Influence of tem-perature and pH on production of two bacteriocins by Leuconostoc mesenteroidessubspmesenteroidesFR52 dur-ing batch fermentation. Appl Microbiol Biotechnol 50:359-363.
Kumar M, Jain AK, Ghosh Met al.(2012) Statistical Optimiza-tion of Physical Parameters for Enhanced Bacteriocin Pro-duction byL. casei. Biotechnol Bioprocess Eng 17:606-616. Leães FL, Sant’Anna V, Vanin NGet al.(2011) Use of byprod-ucts of food industry for production of antimicrobial activity byBacillussp. P11. Food Bioprocess Technol 4:822-828. Lee YM, Kim JS, Kim WJ (2012) Optimization for the Maximum
Bacteriocin Production ofLactobacillus brevisDF01 Using Response Surface M’ethodology. Food Sci Biotechnol 21:653-659.
Leroy F, De Vuyst L (1999) Temperature and pH conditions that prevail during fermentation of sausages are optimal for pro-duction of antilisterial bacteriocin Sakacin K. Appl Environ Microbiol 65:974-981.
Li C, Bai J, Cai Zet al.(2002) Optimization of a cultural medium for bacteriocin production byLactococcus lactisusing re-sponse surface methodology. J Biotechnol 93:27-34. Liang X, Sun Z, Zhong Jet al.(2010) Adverse effect of nisin
resis-tance protein on nisin-induced expression system in Lactococcus lactis. Microbiol Res 165:458-465.
Liserre AM, Landgraf M, Destro MTet al.(2002) Inhibition of Listeria monocytogenes by a bacteriocinogenic Lactobacillus sakestrain in modified atmosphere-packaged Brazilian sausage. Meat Sci 61:449-455.
Martinis ECP, Franco BDGM (1998) Inhibition of Listeria monocytogenesin a pork product by aLactobacillus sake strain. Int J Food Microbiol 42:119-126.
Mataragas M, Metaxopolous J, Galiotou Met al.(2003) Influence of pH and temperature on growth and bacteriocin production by Leuconostoc mesenteroides L124 and Lactobacillus curvatusL442. Meat Sci 64:265-271.
Motta AS, Brandelli A (2002) Characterization of an anti-microbial peptide produced by Brevibacterium linens. J Appl Microbiol 92:63-70.
Motta AS, Brandelli A (2003) Influence of growth conditions on bacteriocin production by Brevibacterium linens. Appl Microbiol Biotechnol 62:163-167.
Todorov SD, Dicks LMT (2005) Optimization of bacteriocin ST311LD production byEnterococcus faeciumST311LD, isolated from spoiled black olives. J Microbiol 43:370-374.
Todorov SD, Dicks LMT (2006) Effect of medium components on bacteriocin production by Lactobacillus plantarum strains ST23LD and ST341LD, isolated from spoiled olive brine. Microbiol Res 161:102-108.
Todorov SD (2008) Bacteriocin production by Lactobacillus plantarumAMA-K isolated from Amasi, a zimbabwean fer-mented milk product and study of the adsorption of bacteriocin AMA-K to Listeria sp. Braz J Microbiol 39:178-187.
Todorov SD, Dicks LMT (2009) Bacteriocin production by Pediococcus pentosaceous isolated from marula (Scerocarya birrea). Int J Food Microbiol 132:117-126.
Todorov SD, Vaz-Velho M, Franco BDGMet al.(2013) Partial characterization of bacteriocins produced by three strains of Lactobacillus sakei, isolated from salpicao, a fermented meat product from North-West of Portugal. Food Control 30:111-121.
Trinetta V, Rollini M, Manzoni M (2008) Development of a low cost culture medium for sakacin A production byL. sakei. Process Biochem 43:1275-1280.
Vázquez JA, Cabo ML, González MPet al.(2004) The role of amino acids in nisin and pediocin production by two lactic acid bacteria A factorial study. Enzyme Microb Technol 34:319-325.
Associate Editor: Elaine Cristina Pereira De Martinis