ISSN 0104-6632 Printed in Brazil
www.abeq.org.br/bjche
Vol. 28, No. 01, pp. 27 - 36, January - March, 2011
Brazilian Journal
of Chemical
Engineering
LACTIC ACID PRODUCTION BY NEW
Lactobacillus plantarum
LMISM6 GROWN
IN MOLASSES: OPTIMIZATION OF
MEDIUM COMPOSITION
L. F. Coelho
1,
C. J. B. de Lima
1, C. M. Rodovalho
2,
M. P. Bernardo
1and J. Contiero
1*1
Department of Biochemistry and Microbiology, Institute of Biological Sciences, Phone: + (55) (19) 3526-4180, Fax: + (55) (19) 3526-4176, Universidade Estadual Paulista,
(UNESP), Zip Code 13506-900, Rio Claro - SP, Brazil. E-mail: [email protected]
2
Department of Biology, Institute of Biological Sciences, Universidade Estadual Paulista, (UNESP), Zip Code 13506-900, Rio Claro - SP, Brazil.
(Submitted: March 12, 2010 ; Revised: September 10, 2010 ; Accepted: September 27, 2010)
Abstract - A Plackett-Burman experimental design was used to evaluate seven medium components added to molasses (corn steep liquor, sodium acetate, magnesium sulfate, manganese sulfate, ammonium citrate, potassium phosphate and Tween 80). Corn steep liquor (CSL), K2HPO4 and Tween 80 increased lactic acid
production. The concentrations of these three components as well as the molasses were further optimized using the response surface method. A maximal lactic acid production of 94.8 g L-1 was obtained when the
concentrations of molasses, CSL, K2HPO4 and Tween 80 were 193.50 g L-1, 37.50 mL L-1, 2.65 g L-1 and
0.83 mL L-1, respectively. However, in both shaker and bioreactor, approximately one fourth of the sugar added initially was not utilized after 48 hours of fermentation. Future studies that consider high conversion of sugar into final product as well as high volumetric productivity are necessary to improve the fermentation process and to reduce the downstream costs.
Keywords: Plackett-Burman; Corn steep liquor; Response surface methodology; Medium optimization;
Potassium phosphate; Tween.
INTRODUCTION
Lactic acid is an organic acid with a wide range of applications in the food, pharmaceutical and cosmetics industries (Datta et al., 1995). It has recently been studied with great interest as a biodegradable polylactic acid (PLA) that can be used to improve physical properties in the production of food packaging, plastic utensils, garbage bags and agricultural plastic sheeting, thereby replacing products made from petroleum (Ohara, 2003).
Lactic acid can be obtained either by the action of fermentative microorganisms or chemical synthesis.
The fermentation process has the advantage of being more cost effective (Silva and Mancilha, 1991). Approximately 90% of all lactic acid worldwide is produced by bacterial fermentation (Zhou et al., 2006).
Lactic acid bacteria are traditionally fastidious microorganisms and have complex nutrient requirements due to their limited ability to biosynthesize B-vitamins and amino acids (Fitzpatrick and Keeffe, 2001).
28 L. F. Coelho,C. J. B. de Lima, C. M. Rodovalho,M. P. Bernardoand J. Contiero
Brazilian Journal of Chemical Engineering as barley, corn, or wheat (Hofvendahl and
Hahn-Hägerdal, 1997). Furthermore, a considerable amount of an expensive complex nitrogen source, such as yeast extract, must be added to the medium in order to produce lactic acid within a reasonable timeframe. However, this is economically unfavorable. According to Tejayadi and Cheryan (1995), raw materials account for 68% of the overall cost of lactic acid production from whey and yeast extract using Lactobacillus bulgaricus.
A number of industrial by-products or wastes have been evaluated as substrates for lactic acid production with the aim of decreasing the cost of the process, such as sugarcane (Calabia and Tokiwa, 2007), molasses (Dumbrepatil et al., 2008) and whey (Buyukkileci and Harsa, 2004) as carbon sources and CSL (Bustos et al., 2004) as a nitrogen source. CSL is an excellent source of nitrogen for most microorganisms due to its high concentration of amino acids and polypeptides, with considerable amounts of B-complex vitamins (Cardinal and Hedrick, 1948). Sugarcane molasses is an industrial by-product of sugar and alcohol processing and is rich in fermentable sugars (Lima et al., 1975), nitrogen and vitamins. This substrate is inexpensive and highly available in Brazil, with an annual production of 17.9 million tons during the sugar manufacturing process.
The aim of the present study was to optimize lactic acid production by Lactobacillus plantarum
LMISM6 grown in molasses.
MATERIALS AND METHODS Microorganism
Lactobacillus plantarum LMISM6 was isolated
from cassava wastewater. The stock cultures were maintained in Man, Rogosa and Sharpe (MRS) growth medium with 20% (v/v) glycerol at -20 ºC. The MRS medium had the following composition (g L-1): glucose (20.0), peptone (10.0), yeast extract (5.0), meat extract (10.0), sodium acetate (5.0), ammonium citrate (2.0), K2HPO4 (5.0), MgSO4.7H2O (0.1) and MnSO4.4H2O (0.05). The pH was adjusted to 6.0 prior to sterilization at 121°C for 15 min.
Inoculum Preparation
The inoculum was prepared through the transference of 2 % of stock culture to Erlenmeyer
flasks containing growth medium (MRS). Incubation temperature was 35 ± 1ºC for 18 hours at 150 rpm.
Substrate
The cane molasses was obtained from the Santa Lucia plant located in Araras-SP, Brazil and this substrate was hydrolyzed by adding 1 ml of H2SO4 (20%) to 100 ml of molasses solution. The acidified molasses solution was heated in a boiling water bath for 20 min. The pH of the medium was adjusted to 6.0 with 4.0 M KOH prior to sterilization. The sugarcane molasses contained 100% reducing sugar.
Analysis
Lactic acid concentrations were determined by a high performance liquid chromatography system equipped with a UV detector at 210 nm. A Rezex ROA (300 x 7.8 mm, Phenomenex) column was eluted with 5 mM H2SO4 as the mobile phase at a flow rate of 0.4 mL/min and the column temperature was maintained at 60°C. Reducing sugars were measured using the 3.5-dinitrosalicylic acid method (Miller, 1959). Cell growth was determined using a spectrophotometer at 650 nm (OD650) following centrifugation and washing of the cells. The dry mass was determined from a standard curve of optical density versus dry mass.
Plackett-Burman Experimental Design
The purpose of this first step of the optimization was to identify the medium components with a significant effect on lactic acid production by
Lactobacillus plantarum LMISM6 using molasses.
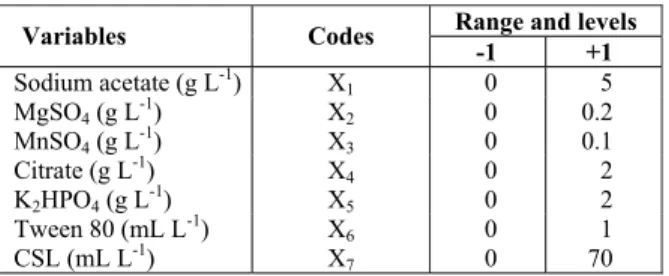
The sugar concentration from molasses was maintained constant (150 g L-1) and twelve experiments were generated from seven factors: CSL, sodium acetate, magnesium sulfate, manganese sulfate, ammonium citrate, potassium phosphate and Tween 80. The variables with a confidence level greater than 95% were considered to have a significant influence on lactic acid production. The Plackett-Burman experimental design (PB) was based on the first-order model, with no interaction among the factors (Plackett and Burman, 1946). The concentrations used for each variable are displayed in Table 1.
A central composite design (CCD) was performed with the variables that significantly increased the production of lactic acid.
Table 1: Variables and levels used in Plackett-Burman design
Range and levels Variables Codes
-1 +1
Sodium acetate (g L-1) X1 0 5
MgSO4 (g L-1) X2 0 0.2
MnSO4 (g L-1) X3 0 0.1
Citrate (g L-1) X
4 0 2
K2HPO4 (g L-1) X5 0 2
Tween 80 (mL L-1) X6 0 1
CSL (mL L-1) X7 0 70
Central Composite Design and Optimization Using Response Surface Methodology
A central composite design (CCD) with four independent variables – each at five levels with eight star points (α = 2.0) and four replicates at the center points – was used to develop a second-order polynomial model that determined the optimal values of variables for lactic acid production. Screened through previous work, CSL, K2HPO4 and Tween 80 were taken as variables for investigation, along with molasses.
The variables of the experiments were coded according to the following equation:
i i CP i
x =(X −X ) / XΔ (1)
in which xi is the coded value of an independent
variable; Xi is the real value of an independent variable; XCP is the real value of an independent variable at the center point; and ∆Xi is the step change value.
The behavior of the system was described by the following quadratic equation:
2
0 i i ii i ij i j
Y= +b Σb x +Σb x +Σb x x (2)
in which Y is the predicted response, i.e., lactic acid concentration; b0 is the offset term; bi is the linear
effect; bii is the squared effect; bij is the interaction
effect; and xi is the independent variable.
Using the CCD method, a total of 28 experiments with various combinations of molasses, CSL, K2HPO4 and Tween 80 were conducted. Table 2 displays the range and levels of the variables investigated.
The experiments were done in 125 mL Erlenmeyer flasks containing 20 mL of production
medium and 100 g L-1 of calcium carbonate at 150 rpm for 48 h.
Table 2: Real values of variables used in central composite design
Ranges and levels Variables Codes
- 2 -1 0 +1 + 2
Molasses (g L-1) X1 70 120 170 220 270
CSL (mL L-1)a X2 0 15 30 45 60
K2HPO4 (mL L-1) a X3 0 1.0 2.0 3.0 4.0
Tween 80 (g L-1) a X4 0 0.5 1.0 1.5 2.0
a
Variables identified as significant in increasing the lactic acid production using a Plackett-Burman design
The Statistica 7.0 software package (StatSoft, Tulsa, USA) was used for the experimental design and regression analysis of the experimental data. The response surface was generated to understand the interactions among the variables. The optimal points for the variables were obtained from Maple 9.5 (Waterloo Maple Inc., Ontario, Canada).
In order to validate the optimization of the medium composition, tests were carried out using the optimized condition to confirm the results of the response surface analysis.
Scale-Up Fermentation of Lactic Acid Production Scale-up fermentation of lactic acid production with the optimal medium was carried out in a 13 L glass vase bioreactor with an initial medium volume of 4.0 L. Agitation speed and culture temperature were controlled at 150 rpm and 35°C, respectively. The pH was controlled at 6.0 by the automatic addition of 10 M NaOH. Samples of 1 mL were withdrawn from the fermentation broth every 3 hours for 96 hours and centrifuged at 7,800 g for 10 minutes.
RESULTS AND DISCUSSION Plackett-Burman Experimental Design
Table 3 displays the Plackett-Burman design matrix (real and coded values) of the 12 experiments with seven variables added to molasses (X1= Acetate, X2=MgSO4, X3=MnSO4, X4=Citrate, X5=K2HPO4, X6=Tween 80, X7= CSL) and the respective results (lactic acid).
30 L. F. Coelho,C. J. B. de Lima, C. M. Rodovalho,M. P. Bernardoand J. Contiero
Brazilian Journal of Chemical Engineering confidence level. Figure 1 (Pareto chart) illustrates
the effects of these variables, which were therefore used to optimize the production of lactic acid.
K2HPO4 had a positive effect on lactic acid production (Fig. 1). According to Honorato et al. (2007), the addition of phosphate to the culture medium increases the growth of the microorganism and enhances lactic acid production, as this component maintains the pH near the optimal growth value, thereby allowing the conduction of fermentation for a longer time.
The Plackett-Burman design is a two-level multifactorial design based on the rationale known as balanced incomplete blocks (Stanbury et al., 1986). The key to this technique is forming various combinations (which are called assemblies) of the components with varying amounts. Plackett-Burman
design is an efficient way to screen for the important factors among a large number of variables. As there were seven parameters to be evaluated for lactic acid production, the Plackett-Burman was the most appropriate design.
There are a number of reports in which the Plackett-Burman design has been used to screen the factors in a fermentation medium to be optimized in subsequent experiments (Krishnan et al., 1998; Reddy et al., 1999; Son et al., 1998; Srinivas et al., 1994; Yu et al., 1997).
After finding the critical factors (CSL, K2HPO4 and Tween 80), the next step was to optimize the concentrations of these components in the growth medium. In this work, a response surface methodology (RSM) using a central composite design was used.
Table 3:Plackett-Burman design (real and coded values) with the respective results
Independent variablesa Response
Run
X1 X2 X3 X4 X5 X6 X7 Lactic acid (g L-1)
1 5 (1)b 0 (-1) 0.1 (1) 0 (-1) 0 (-1) 0 (-1) 70 (1) 78.64 2 5 (1) 0.2 (1) 0 (-1) 2(1) 0 (-1) 0 (-1) 0 (-1) 5.44 3 0 (-1) 0.2 (1) 0.1 (1) 0 (-1) 2 (1) 0 (-1) 0 (-1) 17.92 4 5 (1) 0 (-1) 0.1 (1) 2(1) 0 (-1) 1 (1) 0 (-1) 13.96 5 5 (1) 0.2 (1) 0 (-1) 2(1) 2 (1) 0 (-1) 70 (1) 85.04 6 5 (1) 0.2 (1) 0.1 (1) 0 (-1) 2 (1) 1 (1) 0 (-1) 42.64 7 0 (-1) 0.2 (1) 0.1 (1) 2(1) 0 (-1) 1 (1) 70 (1) 82.40 8 0 (-1) 0 (-1) 0.1 (1) 2(1) 2 (1) 0 (-1) 70 (1) 81.32 9 0 (-1) 0 (-1) 0 (-1) 2(1) 2 (1) 1 (1) 0 (-1) 40.64 10 5 (1) 0 (-1) 0 (-1) 0 (-1) 2 (1) 1 (1) 70 (1) 96.48 11 0 (-1) 0.2 (1) 0 (-1) 0 (-1) 0 (-1) 1 (1) 70 (1) 85.20 12 0 (-1) 0 (-1) 0 (-1) 0 (-1) 0 (-1) 0 (-1) 0 (-1) 6.00
a
X1= Acetate, X2=MgSO4, X3=MnSO4, X4=Citrate, X5=K2HPO4, X6=Tween 80, X7=CSL b
(-1) and (1) are coded levels.
Response Surface Methodology
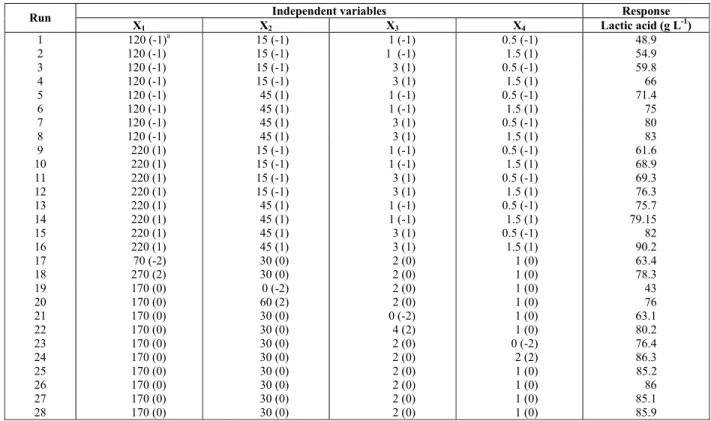
The three above-mentioned components and molasses were further optimized using response surface optimization. Table 4 displays the design matrix of the variables in coded units and real values with the respective results.
The highest production of lactic acid was 90.2 g L-1, obtained from 220 g L-1 of molasses, 45 mL L-1 of CSL, 3 g L-1 of K2HPO4 and 1.5 mL L-1 of Tween 80 (Table 4). The application of multiple regression analysis methods yielded the following regression Eq. (3) for the experimental data.
1 2 3
2 2 2
4 1 2 3
2
4 1 2 1 3 1 4
2 3 2 4 3 4
Y 85.5 3.91X 8.19X 4.38X
2.69X 3.58X 6.42X 3.38X
0.96X 1.8X X 0.39X X 0.44X X
0.19X X 0.51X X 0.25X X
= + + + +
− − − −
− − + −
− +
(3)
The quadratic model in Equation (3) contains four linear terms, four quadratic terms and six factorial interactions, in which Y is the predicted response (lactic acid concentration) and X1, X2, X3 andX4 are the coded values of molasses, CSL, K2HPO4 and
Tween 80, respectively.
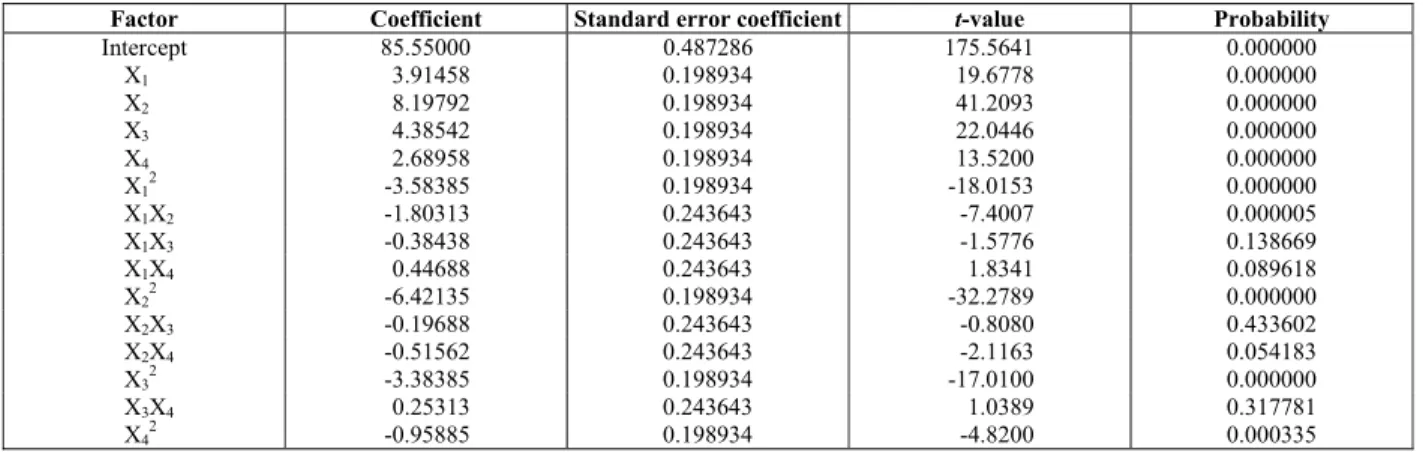
Table 5 displays the Student’s t-distribution and the probability (p) values that serve as a tool to check the significance of each coefficient. Smaller p-values denote a more significant corresponding coefficient.
The results show that the variables X1 (molasses), X2 (CSL), X3 (K2HPO4) and X4 (Tween 80) had a significant effect, based on p-values lower than 0.05. Moreover, as these variables have positive coefficients (Table 5), an increase in their concentrations results in an increase in the production yield. The squared variables X12, X22, X32, X42 and the X1X2 interaction were also significant to different extents. The non-significant terms (X1X3, X1X4, X2X3, X2X4, X3X4) were discarded. The Eq. (3) model was modified to the reduced Eq. (4) fitted model.
1 2 3 4
2 2 2 2
1 1 2 2 3 4
Y 85.55 3.9X 8.19X 4.38X 2.68X
3.85X 1.8X X 6.42X 3.38X 0.95X
= + + + + −
− − − − (4)
The response surface quadratic model was performed in the form of analysis of variance (ANOVA) and the results are summarized in Table 6. The F-test was used to check the statistical significance of Eq. (4).
Table 4:Central composite design and results
Independent variables Response Run
X1 X2 X3 X4 Lactic acid (g L-1)
1 120 (-1)a 15 (-1) 1 (-1) 0.5 (-1) 48.9 2 120 (-1) 15 (-1) 1 (-1) 1.5 (1) 54.9 3 120 (-1) 15 (-1) 3 (1) 0.5 (-1) 59.8
4 120 (-1) 15 (-1) 3 (1) 1.5 (1) 66
5 120 (-1) 45 (1) 1 (-1) 0.5 (-1) 71.4
6 120 (-1) 45 (1) 1 (-1) 1.5 (1) 75
7 120 (-1) 45 (1) 3 (1) 0.5 (-1) 80
8 120 (-1) 45 (1) 3 (1) 1.5 (1) 83
9 220 (1) 15 (-1) 1 (-1) 0.5 (-1) 61.6
10 220 (1) 15 (-1) 1 (-1) 1.5 (1) 68.9
11 220 (1) 15 (-1) 3 (1) 0.5 (-1) 69.3
12 220 (1) 15 (-1) 3 (1) 1.5 (1) 76.3
13 220 (1) 45 (1) 1 (-1) 0.5 (-1) 75.7
14 220 (1) 45 (1) 1 (-1) 1.5 (1) 79.15
15 220 (1) 45 (1) 3 (1) 0.5 (-1) 82
16 220 (1) 45 (1) 3 (1) 1.5 (1) 90.2
17 70 (-2) 30 (0) 2 (0) 1 (0) 63.4
18 270 (2) 30 (0) 2 (0) 1 (0) 78.3
19 170 (0) 0 (-2) 2 (0) 1 (0) 43
20 170 (0) 60 (2) 2 (0) 1 (0) 76
21 170 (0) 30 (0) 0 (-2) 1 (0) 63.1
22 170 (0) 30 (0) 4 (2) 1 (0) 80.2
23 170 (0) 30 (0) 2 (0) 0 (-2) 76.4
24 170 (0) 30 (0) 2 (0) 2 (2) 86.3
25 170 (0) 30 (0) 2 (0) 1 (0) 85.2
26 170 (0) 30 (0) 2 (0) 1 (0) 86
27 170 (0) 30 (0) 2 (0) 1 (0) 85.1
28 170 (0) 30 (0) 2 (0) 1 (0) 85.9
a
32 L. F. Coelho,C. J. B. de Lima, C. M. Rodovalho,M. P. Bernardoand J. Contiero
Brazilian Journal of Chemical Engineering
Table 5:Coefficients of t-values for lactic acid production using a composite rotatable design
Factor Coefficient Standard error coefficient t-value Probability
Intercept 85.55000 0.487286 175.5641 0.000000
X1 3.91458 0.198934 19.6778 0.000000
X2 8.19792 0.198934 41.2093 0.000000
X3 4.38542 0.198934 22.0446 0.000000
X4 2.68958 0.198934 13.5200 0.000000
X12 -3.58385 0.198934 -18.0153 0.000000
X1X2 -1.80313 0.243643 -7.4007 0.000005
X1X3 -0.38438 0.243643 -1.5776 0.138669
X1X4 0.44688 0.243643 1.8341 0.089618
X22 -6.42135 0.198934 -32.2789 0.000000
X2X3 -0.19688 0.243643 -0.8080 0.433602
X2X4 -0.51562 0.243643 -2.1163 0.054183
X32 -3.38385 0.198934 -17.0100 0.000000
X3X4 0.25313 0.243643 1.0389 0.317781
X42 -0.95885 0.198934 -4.8200 0.000335
R2
= 0.9970; adjusted R2
= 0.9933; R = 0.9984;
Table 6:Analysis of variance for the second-order polynomial model
Source Sum of squares Degrees of freedom Mean square F-value p > F
Model 3853.152 9 428.1280 323.7185 0.0000
Residual 23.806 18 1.3225
Lack of fit 23.156 15 1.544 7.125 0.06574
Pure error 0.650 3 0.217
Total 3876.957 27
R2
= 0.9938; Adj R2
= 0.9907; R = 0.9969
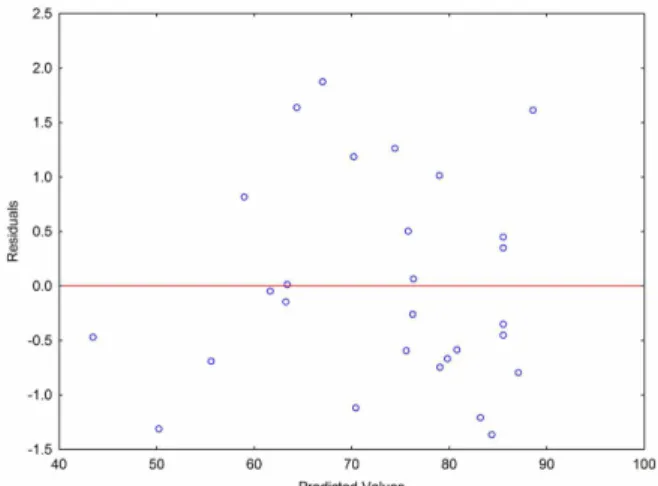
ANOVA of the quadratic regression model demonstrates that the model is highly significant, which is evident from the F-test (F model, the ratio of mean square regression to mean square residual is 323.7185), and has a very low probability value [(pmodel > F) = 0.0000]. The fit of the model was checked by the coefficient of determination (R2) and the multiple correlation coefficient (R). The R2 value (0.9938) for Eq. (4) indicates that the sample variation of 99.38% for lactic acid was attributed to the independent variables and only 0.62% of the variation cannot be explained by the model. The value of the adjusted coefficient of determination (adjusted R2 = 0.9907) is also high, which demonstrates the high significance of the model. The high R value (0.9969) demonstrates strong agreement between the experimental observations and predicted values. This correlation is also confirmed by the plot of predicted versus experimental values of lactic acid production in Fig. 2, as all points cluster around the diagonal line, demonstrating that no significant violations of the model were found. Moreover, the value of lack of fit for regression Eq. (4) was not significant at the 5% level (p>0.05), indicating the good predictability of the model. Fig. 3 presents a plot of residuals versus the predicted response and displays no pattern or trend, suggesting that the variance of the original observation is constant. All residuals were smaller than 2%, which indicates that the model is adequate
for describing lactic acid production over the experimental ranges studied.
The 3D response surface is the graphic representation of the regression equation and is plotted to understand the interaction of the variables and locate the optimal level of each variable for maximal response (Fig. 4 and Fig. 5). Each response surface and contour plotted for lactic acid production represents the different combinations of two test variables at one time while keeping the other two variables at their respective zero level. The convex response surfaces suggest that there are well-defined optimal variables.
Figure 2: Plot of predicted vs. observed values of lactic acid production
Figure 3: Plot of residuals vs. predicted values for lactic acid production.
Figure 4: Response surface and contour plots of lactic acid production by L. plantarum LMISM6 showing the interaction between molasses and CSL at constant levels of K2HPO4 (2 g L-1) and Tween 80 (1 mL L-1)
Figure 5: Response surface and contour plots of lactic acid production by L. plantarum LMISM6 showing the interaction between K2HPO4 and Tween 80 at constant levels of molasses(170 g L-1) and CSL (30 mL L-1)
CSL has long proven to be an inexpensive alternative to materials such as yeast extract (YE) and peptone (Liggett and Koffler, 1948). The use of a cheap nitrogen source for the complete replacement of YE has been widely discussed. Supplementation with whey containing lactose at 55 g/L and 5% malt reaches a lactic acid yield similar to YE supplementation at around 55 h (Pauli and Fitzpatrick, 2002). Yu et al. (2008) found that CSL not only replaces YE as the sole nitrogen source in an optimized medium, but also helps to enhance lactic acid production when associated with other beneficial medium components.
The effect of molasses and CSL on lactic acid production was positive, as molasses is rich in trace elements and vitamins (Beaulieu et al., 1995). Yu et al. (2008) reported the same for L(+) lactic acid
production by L. rhamnosus. The addition of phosphate to the culture medium increased lactic acid production (Fig. 5). The use of K2HPO4 is reported to provide K+ and phosphate for microorganism growth and also acts as a buffering agent in the medium (Honorato et al., 2007). Lactic acid production increased with the increase in concentration to slightly more than 2.5 g L-1 of K2HPO4 and 0.8 mL L-1 of Tween 80.
34 L. F. Coelho,C. J. B. de Lima, C. M. Rodovalho,M. P. Bernardoand J. Contiero
Brazilian Journal of Chemical Engineering
Lactobacillus rhamnosus CGMCC 1466. This is likely
due to the fact that Tween 80 can dissolve lipid structures in the cell membrane, thereby improving membrane permeability and enhancing the release of intracellular enzymes. Tween 80 has also been found to promote the migration of nutritive compounds into cells and has therefore been added to bacterial media to promote growth (Reese and Maguire, 1969). Thus, Tween 80 serves as an essential growth factor and has proven beneficial in the cultivation and fermentation of Lactobacillus (Duggan et al., 1959). However, a higher concentration of Tween 80 [1.4% (w/v)] decreased lactic acid production (Fig. 5). This was likely due to the fact that the surfactant Tween 80 becomes toxic at higher concentrations, leading to the destruction of the cell membrane and/or loss of the cell membrane function caused by the solubility of lipid bilayer (Ben-Kun Q. et al., 2009).
The point of maximal lactic acid production was determined through canonical analysis of the adjusted model. A study was carried out to identify the nature of the stationary point (maximal point, low response or saddle point). An algorithm carried out with the Maple 9.5 program (Waterloo Maple, Inc., Canada) was used to calculate the stationary point (P0) for the synthesis of lactic acid. These values are displayed in Table 7. The λ values referring to molasses, CSL, K2HPO4 and Tween 80 indicate that these responses have a maximal point, since they have equal, negative signs (Table 7). The analysis determined that the maximal predicted lactic acid concentration was 91.61 g L-1, with the corresponding optimal values of the test variables at 193.50 g L-1 of molasses, 37.50 mL L-1 of CSL, 2.65 g L-1 of K2HPO4 and 0.83 mL L
-1 of Tween 80.
Table 7:Stationary point for lactic acid production and coded values of the variables X1, X2, X3 and X4.
P0 Lactic acid Coordinates Lactic acid
λ1 - 6.69 X1 0.47
λ2 - 3.54 X2 0.50
λ3 - 3.19 X3 0.65
λ4 - 0.90 X4 1.46
All optimal points were located within the experimental region. To confirm the adequacy of the model for predicting maximal lactic acid production, three additional experiments were performed in a shaker with this optimal medium composition. The mean value of lactic acid concentration was 94.8 g L-1, which is in agreement with the predicted value of 91.61 g L-1. Thus, the model proved adequate. Yu et al. (2008) studied the addition of CSL in molasses as the sole nitrogen source and obtained 112.5 g L-1 of
lactic acid in 36 hours of fermentation by
Lactobacillusrhamnosus.
Plackett-Burman design was appropriate to make a preliminary assessment of the significant components (CSL, K2HPO4 and Tween 80) in the production of lactic acid. These same components were also significant by using central composite design.
Comparison of the Time Course of Lactic Acid Production in the Optimized Medium Run with the Shake-Flask Method and in a Bioreactor
The scale-up fermentation of lactic acid in the optimized medium was carried out in the bioreactor (4 L of medium). The time courses are displayed in Fig. 6. After 48 hours of fermentation, lactic acid production in the bioreactor and in the shake-flask was 89.88 g L-1 and 94.8 g L-1, respectively. However, productivity in the bioreactor (3.43 g L-1h-1) was higher than that achieved with the shake-flask method (2.89 g L-1h-1) after 12 h of fermentation. Yu et al. (2008) state that this is due to the addition of different neutralizing agents.
Figure 6: Time course of lactic acid production in the shaker compared to that in the bioreactor: in the shaker:(▲); in the bioreactor (∆).
Molasses is an economically feasible raw material for industrial production of lactic acid and it has enough necessary nutrients for growth of
Lactobacillus plantarum LMISM6. However, it is
CONCLUSIONS
Under optimized conditions, the best result for lactic acid production (94.8 g L-1) was obtained after 48 hours with 193.50 g L-1 of molasses, 37.50 mL L-1 of CSL, 2.65 g L-1 K2HPO4 and 0.83 mL L-1 of Tween 80. Thus, the use of molasses for fermentation by L. plantarum LMISM6 is feasible and yields considerable lactic acid production, requiring only supplementation with a cheap nitrogen source (CSL),K2HPO4 and Tween 80. This work focused on high titers; however in both, shaker and bioreactor, approximately one fourth (50 g L-1) of the sugar added initially was not utilized. Future studies that consider high conversion of sugar into final product as well as high volumetric productivity are necessary to improve the fermentation process and to reduce the downstream costs.
ACKNOWLEDGMENTS
The authors thank Plaza S.A. and Corn Products for kindly supplying the molasses and corn steep liquor, respectively, and the Brazilian funding agency Fundação de Amparo a Pesquisa do Estado de São Paulo (FAPESP) for the fellowships and financial support.
REFERENCES
Beaulieu, M., Beaulieu, Y., M´elinard, J., Pandian, S. and Goulet, J., Influence of ammonium salts and cane molasses on growth of Alcaligenes eutrophux
and production of polyhydroxybutyrate. Appl. Environ. Microb., 61, 165-169 (1995).
Belhocine, D., Investigations on lactose valorization by lactic acid fermentation. Ph.D. Thesis, University of Rennes I, France (1987).
Ben-Kun, Q., Ri-Sheng, Y., Min, L. and Sheng-Song, D., Effect of Tween 80 on production of lactic acid
by Lactobacillus casei. Songklanakarin J. Sci.
Technol., 31, 85-89 (2009).
Bustos, G., Moldes, A.B., Alonso, J. L. and Vázquez, M., Optimization of D-lactic acid production by Lactobacillus coryneformis using response surface metholodology. Food Microbiol., 21, 143-148 (2004).
Buyukkileci, A. O. and Harsa, S., Batch production of L(+) lactic acid from whey by Lactobacillus casei
(NRRL B-441). J. Chem. Technol. Biotechnol., 79, 1036-1040 (2004).
Calabia, B. P. and Tokiwa, Y., Production of D-lactic acid from sugarcane molasses, sugarcane juice and sugar beet juice by Lactobacillus
delbrueckii. Biotechnol. Lett., 29, 1329-1332
(2007).
Cardinal E. V. and Hedrick L. R., Microbiological assay of corn steep liquor for amino acid content. J. Biol. Chem., 172, 609-612 (1948).
Datta, R., Tsai, S. P., Bonsignor P., Moon S. and Frank J., Technological and economical potential of polylactic acid and lactic acid derivatives. FEMS Microbiol. Rev., 16, 221-231 (1995). De Lima, C. J. B., Coelho, L. F., Blanco, K. C. and
Contiero, J., Response surface optimization of D(-)-lactic acid production by Lactobacillus SMI8 using corn steep liquor and yeast autolysate as an alternative nitrogen source. Afr. J. Biotechnol., 8, 5842-5846 (2009).
Duggan, D. E., Anderon, A. W. and Ellker, P. R., A frozen concentration of Lactobacillus acidophilus
for preparation of a palatable acidophilus milk. Food Technol., 13, 465-469 (1959).
Dumbrepatil, A., Adsul, M., Chaudhari, S., Khire, J. and Gokhale, D., Utilization of Molasses Sugar for Lactic Acid Production by Lactobacillus
delbrueckii subsp. delbrueckii Mutant Uc-3 in
Batch Fermentation. Appl. Environ. Microbiol., 74, 333-335 (2008).
Fitzpatrick, J. J. and Keeffe, U. O., Influence of whey protein hydrolyzate addition to whey permeate batch fermentations for producing lactic acid. Proc. Biochem., 37, 183-186 (2001).
Gopal, A. R. and Kammen, D. M., Molasses for ethanol: the economic and environmental impacts of a new pathway for the lifecycle greenhouse gas analysis of sugarcane ethanol. Environ. Res. Lett., 4, 1-5 (2009).
Hofvendahl, K. and Hahn-Hägerdal, B., L-Lactic acid production from whole wheat flour hydrolyzate using strains of Lactobacilli and
Lactococci, Enzyme Microb. Technol., 20,
301-307 (1997).
Honorato, T. L., Rabelo, M. C., Pinto, G. A. S. and Rodrigues, S., Produção de ácido lático e dextrana utilizando suco de caju como substrato. Cienc. Tecnol. Aliment., 27, 254-258 (2007). Krishnan, S., Prapulla, S. G., Karanth, N. G.,
Screening and selection of media components for lactic acid production using Plackett-Burman design. Bioprocess. Eng., 19, 61-65 (1998). Liggett, R. W. and Koffler, H., Corn steep liquor in
36 L. F. Coelho,C. J. B. de Lima, C. M. Rodovalho,M. P. Bernardoand J. Contiero
Brazilian Journal of Chemical Engineering Lima, U.A., Aquarone, E. and Borzani, W.,
Biotecnologia: tecnologia das fermentações. São Paulo, Brasil (1975).
Miller, G. L., Use of dinitrossalicylic acid reagent for determination of reducing sugar. Anal. Chem., 31, 426-428 (1959).
Plackett, R. L. and Burman, J. P., The Design of Optimal Multifactorial Experiments. Biometrika, v. 33 (1946)
Ohara, H., Biorefinery. Appl. Microbiol. Biotechnol., 62, 474-477 (2003).
Pauli, T. and Fitzpatrick, J. J., Malt combing nuts as a nutrient supplement to whey permeate for producing lactic by fermentation with
Lactobacillus casei. Process. Biochem., 38, 1-6
(2002).
Reddy, P. R. M., Reddy, G. and Seenayya, G., Production of thermostable beta-amylase and pullulanase by Clostridium thermosulfurogens
SV2 in solid-state fermentation: screening of nutrients using Plackett-Burman design. Bioprocess. Eng., 21, 175-179 (1999).
Reese, E. T. and Maguire, A., Surfactants as stimulants of enzyme production by microorganisms, Appl. Microbiol., 17, 242-245 (1969).
Silva, S. S. and Mancilha, I. M., Aproveitamento de agroindustriais: ácido lático uma alternativa. Boletim da Sociedade Brasileira de Ciência e Tecnologia de Alimentos, 25, 37-40 (1991). Srinivas, M. R. S., Chand, N. and Lonsane, B. K.,
Use of Plackett-Burman design for rapid screening of several nitrogen sources, growth/ product promoters, minerals and enzyme inducers for the production of alpha-galactosidase by
Aspergillus niger MRSS 234 in solid state
fermentation system. Bioprocess. Eng., 10, 139-144 (1994).
Son, K-H., Hong, S-H., Kwon, Y-K., Bae, K-S., Kim, Y-K., Kwon, B-M., Kim, S-U., Bok, S-H., Production of a Ras farnesyl protein transferase inhibitor from Bacillus licheniformis using Plackett- Burman design. Biotechnol. Lett., 20, 149-151 (1998).
Stanbury, P. F., Whitaker, A., Hall, S. J., Media for industrial fermentations. In: Principles of fermentation technology. Oxford: Pergamon, p 93-122 (1986).
Tejayadi, S. and Cheryan, M., Lactic acid from cheese whey permeate. Productivity and economics of a continuous membrane bioreactor. Appl. Microbiol. Biotechnol., 43, 242-248 (1995).
Wood, B. J. B. and Holzapfel, W. H., The genera of lactic acid bacteria. Glasgow: Blackie Academic and Professional (1995).
Yu, X., Hallett, S. G. and Watson, A. K., Application of the Plackett-Burman experimental design to evaluate nutritional requirements for the production of Colletotrichum coccodes spores. Appl. Environ. Microbiol., 47, 301- 305 (1997). Yu, L., Lei, T., Ren, X., Pei, X. and Feng, X.,
Response surface optimization of l-(+)-lactic acid production using corn steep liquor as an alternative nitrogen source by Lactobacillus
rhamnosus CGMCC 1466. Biochem. Eng. J., 39,
496-502 (2008).
Zhou, S., Shanmugam, K. T., Yomano, L. P., Grabar, T. B. and Ingram L. O., Fermentation of 12% (w/v) glucose to 1.2 M lactate by Escherichia coli