625 625 625 625 625 Mem Inst Oswaldo Cruz, Rio de Janeiro, Vol. 101(6): 625-633, September 2006
Population genetic structure of the dengue mosquito
Aedes aegypti
in Venezuela
Flor Herrera/
+, Ludmel Urdaneta, José Rivero, Normig Zoghbi, Johanny Ruiz,
Gabriela Carrasquel, José Antonio Martínez*, Martha Pernalete, Patricia Villegas,
Ana Montoya, Yasmin Rubio-Palis**, Elina Rojas***
Centro de Investigaciones Biomédicas, Universidad de Carabobo Callejón Cecilio Acosta, Avda. Las Delicias, Maracay 2101, Aragua, Venezuela *Departamento de Biología, Universidad Pedagógica Experimental Libertador, Maracay, Aragua, Venezuela
**Dirección de Salud Ambiental, Ministerio de Salud y Desarrollo Social, Maracay, Aragua, Venezuela ***Centro de Investigaciones “J. W. Torrealba”, Universidad de Los Andes, Núcleo Trujillo, Venezuela
The mosquito Aedes aegypti is the main vector of dengue in Venezuela.The genetic structure of this vector was investigated in 24 samples collected from eight geographic regions separated by up to 1160 km. We examined the distribution of a 359-basepair region of the NADH dehydrogenase subunit 4 mitochondrial gene among 1144 Ae. aegypti from eight collections. This gene was amplified by the polymerase chain reaction and tested for variation using single strand conformation polymorphism analysis. Seven haplotypes were detected throughout Venezuela and these were sorted into two clades. Significant differentiation was detected among collections and these were genetically isolated by distance.
Key words: Aedes aegypti - genetic structure - dengue - single strand conformation polymorphism analysis - ND4 haplotypes
Dengue is the most important viral disease transmit-ted to human by mosquitoes in Venezuela, causing many cases of dengue fever (DF) and dengue hemorrhagic fe-ver (DHF) annually. More than 42,199 cases (DF/DFH: 15/1) were reported through calendar year 2005 (MSDS 2006). The incidence of dengue has increased since the outbreak in 1989, because multiple serotypes are circulat-ing in endemic areas.
Aedes aegypti is the principal vector for dengue vi-ruses. This vector is able to maintain the four serotypes of dengue viruses (DEN 1, 2, 3, and 4) in an urban trans-mission cycle. Ae. aegypti populations may differ in bit-ing behaviour, vectorial capacity, and other characteris-tics of epidemiological importance which may be detected through molecular markers (Tabachnick 1991). In addition, these markers could be used to determine the relatedness of geographic populations and associate this information with vector movements. This will help to analyze the risk of disease transmission (Ballinger-Crabtree et al. 1992).
Single strand conformation polymorphism (SSCP) analysis offers a simple, sensitive, and cheap method of detecting DNA polymorphisms, therefore, SSCP has be-come one of the most used means for determining genetic variation (Orita et al. 1989). SSCP is based on the principle that changes in the nucleotide sequences of a single-strand DNA molecule alter its three-dimensional
confor-Financial support: Fondo Nacional de Ciencia, Tecnología e Innovación, Consejo de Desarrollo Científico y Humanístico-UC, UNDP/World Bank/WHO Special Programme for Research and Training in Tropical Diseases
+Corresponding author: flormhq@cantv.net
Received 22 February 2006 Accepted 28 June 2006
mation. Point mutations could thereby change strands migration through polyacrylamide gels. SSCP detected 99% of base changes in 100 to 300 bp DNA fragments and 89% of point mutations in 300-450 bp molecules (Black & DuTeau 1997, Hayashi 1991, Sunnucks et al. 2000)
An extensive population genetic study among Ae. aegypti collections from Mexico using SSCP to analyze a 347-bp fragment amplified from the NADH dehydroge-nase subunit 4 mitochondrial DNA (ND4) showed that gene flow varies by region, that collections were geneti-cally isolated by distance in the Pacific and that the Yucatan but not among collections in the northeast (Gorrochotegui-Escalante et al. 2002). A similar study across a broad geographic area of Thailand showed a much lower genetic diversity in ND4 than the one found in Mexico. Genetic drift and vector control efforts were implicated as the principal factors in genetic differentia-tion (Bosio et al. 2005). Other study using the ND4 gene of Ae. aegypti only from three cities in Peru revealed low levels of genetic variability in these mosquito popula-tions. Restricted gene flow was claimed to be responsible for population differentiation (da-Costa-da-Silva et al. 2005). The aim of this study was to investigate for the first time the population genetic structure of Ae. aegypti in different geographic regions of Venezuela using ND4 mitochondrial DNA markers.
MATERIALS AND METHODS
collec-626 626 626 626
626 Genetic structure of Aedes aegypti • Flor Herera et al.
tion are listed in Table I. The DNA was extracted from individual specimens using a phenol/chloroform method, resuspended in 60 µl of sterilized water and stored at -80ºC (Rivero et al. 2004).
Mitochondrial gene amplification - A 359-bp region of the ND4 gene was amplified using the oligonucleotides and reaction conditions of Gorrochotegui et al. (2000). The PCR amplifications were carried out in 50 µl reaction volumes using 1 µl of template DNA in a PTC-100 thermal cycler (MJ Research, Inc., Watertown, MA). Negative controls (all reagents except template) were run to detect possible contamination. Thermal cycling conditions fol-lowed (Gorrochotegui et al. 2000) except that Taq DNA polymerase was added in the mixture. The amplified prod-ucts were visualized by electrophoresis in 2% agarose gels stained with ethidium bromide.
SSCP analysis - The PCR product (10 µl) was mixed with 8 µl of loading buffer (10 mM NaOH, 95% formamide, 0.05% bromophenol blue, and 0.05% xylene cyanol), cen-trifuged and heated to 95ºC for 10 min on a thermal cycler, then transferred immediately into ice. Samples were loaded onto 27 × 20 cm, 1 mm thick, 7% polyacrylamide gels. Gels were run at 4ºC for 20 h at a constant 8 milliamps and silver stained to visualize DNA fragments (Black & DuTeau 1997). ND4 PCR products from 3-6 individuals of each haplo-type were sequenced in both directions using the PCR
primers. Sequencing reactions were performed with ABI PRISM BigDye Terminator v3.1 Cycle Sequencing Kit on an Applied Biosystem Model 310 Genetic Analyzer at the Instituto de Estudios Avanzados (Caracas, Venezuela).
Statistical analysis of mitochondrial haplotype fre-quencies - Analysis of molecular variance (AMOVA) (Excoffier et al. 1992) was conducted on the resulting haplotypes within and among regions using Arlequin 2000 (Schneider et al. 2000). The significance of the variance components was computed using a non-parametric per-mutation test (Excoffier et al. 1992). The DNA sequences were aligned using the Clustal W software package (Th-ompson et al. 1994). The nucleotide sequence and the frequency of each haplotype for each collection were ana-lyzed using DnaSP version 3.99 (Rozas et al. 2003). The number of polymorphic sites, the average number of nucle-otide differences (k) (Tajima 1983), the nuclenucle-otide diver-sity (π
1) and the nucleotide diversity with the Jukes and Cantor correction (π
2) (Nei 1987) were estimated. Effec-tive migration rates (Nm) were calculated from FST. Trans-formed FST /(1- FST) were regressed on the natural loga-rithm of pairwise geographic distances among popula-tions to test for isolation by distance (Slatkin 1993). The Mantel test was performed using FORTRAN program MANTEL (William C. Black IV, Department of Microbiol-ogy, Immunology and PatholMicrobiol-ogy, Colorado State Univer-sity, Fort Collins, CO). Genetic distance matrices were used
TABLE I
Regions, locations per region, geographic coordinates, and sample sizes
Region Locality Latitude Longitude No. individuals
1: West Coast (WC) Mecocal -71.411 10.6465 48
La Esperanza -69.7711 10.5944 49
Los Pedros -69.0461 10.8036 48
2: Maracaibo Lake (ML) Nueva Bolivia -71.0873 9.14206 52
Palmarito -71.2173 9.18048 47
3: West Region (WR) Santa María -70.6239 9.28081 49
Las Américas -70.9909 8.54235 50
4: Inland Region (IL) San Carlos -68.5728 9.68337 45
Calabozo -67.4372 8.9293 48
San Juan -67.343 9.92745 49
5: Central Region (CR) Maracay -67.5914 10.2553 48
El Limón -67.6334 10.3106 43
La Victoria -67.3331 10.2312 50
Cagua -67.4565 10.1888 47
Villa de Cura -67.4807 10.0369 49
6: North Region (NR) Puerto Cabello -68.0176 10.4731 41
Catia La Mar -67.0342 10.6057 48
Naiguatá -66.7364 10.6251 46
7: East Region (ER) Puerto Píritu -65.0411 10.0654 50
Barcelona -64.6617 10.1554 45
Sucre -64.155 10.4772 49
8: South Region (SR) Tumeremo -61.5049 7.27414 49
El Dorado -61.6357 6.72379 47
El Callao -61.8088 7.35699 47
627 627 627 627 627 Mem Inst Oswaldo Cruz, Rio de Janeiro, Vol. 101(6), September 2006
to construct a cladogram among all collections by means of unweighted pair-group method with arithmetic averag-ing analysis in the NEIGHBOR procedure of PHYLIP3.5C (Felsentein 1993).
Phylogenetic relationships among haplotypes -MEGA (version 3.0) was used to perform phylogenetic analyses using maximum parsimony (Kumar et al. 2004). A bootstrap analysis with 1000 replications was done to assess the consistency with which the dataset supported the resolved phylogenies. ND4 homologous regions of Anopheles gambiae and Ae. albopictus were used as outgroups.
RESULTS
Haplotypes frequencies - A total of 24 samples, repre-senting 1144 wild specimens of Ae. aegypti were collected in eight geographic areas defined as the West Coast (WC), the Maracaibo Lake (ML), the West Region (WR), the Inland (IL), the Central Region (CR), the North Region (NR), the East Region (ER), and the South Region (SR) (Table I).
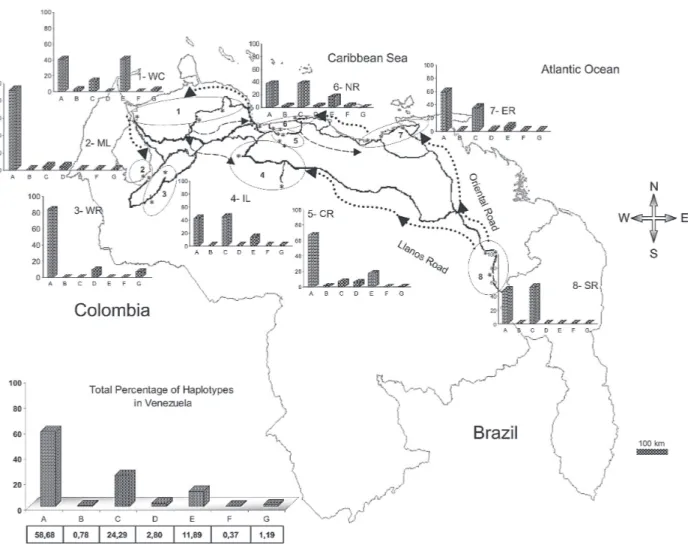
Seven haplotypes were detected by SSCP analysis and sequencing. The haplotype sequences were aligned with other ND4 sequences from Mexico and Brazil regis-tered in the GenBank (Mexico: GenBank # AF334841-334865; Brazil: GenBank # AY 906835-AY 906853). All Venezuelan sequences were unique. The sequences of Bosio et al. (2005) and da Costa-da-Silva et al. (2005) are not in the GenBank. To date there are 25 haplotypes re-ported from Mexico (Gorrochotegui-Escalante et al. 2002), 6 from Thailand (one of the haplotypes is found in Mexico), 19 from Brazil, 3 from Peru, and 7 from Venezuela which makes a total of 60 haplotypes. To identify the Venezu-elan haplotypes following the numbering listed in the lit-erature, it will be necessary to wait until the Brazilian pub-lication and the Thailand and Peruvian sequences are available. Therefore, we denoted them A-G. The frequen-cies of these haplotypes, both by region and in the whole country are shown in Fig. 1.
Only haplotypes A, C, and E were shared among all collections. Haplotype A was the most frequent (0.96-0.18). Haplotype C was only absent from the WR and its
628 628 628 628
628 Genetic structure of Aedes aegypti • Flor Herera et al.
frequency varied from 0.64 to 0.02. Haplotype E was found in WC, NR, ER, CR, and IL. This haplotype is also distrib-uted along a gradient of decreasing frequency (0.81-0.06) but in the opposite direction of haplotype C. The rest of the haplotypes occurred at low frequencies: Haplotype D was present in five regions. Haplotype B was present in NR, WC, and CR. Haplotype F was found only in the population of Catia La Mar in the NR whereas haplotype G was found in WC, WR, and NR.
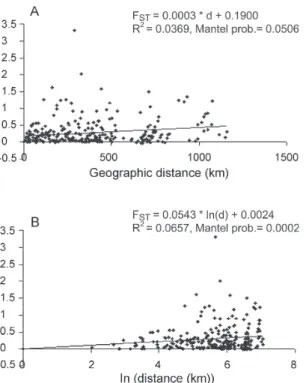
Genetic heterogeneity - Geographical analysis of varia-tion in ND4 haplotype frequencies was conducted by AMOVA (Table II). Most of the variation (77.6%) arose among mosquitoes in collections while 11.6% arose among collections within regions and 10.8% occurred among regions. The average FST was 0.224 suggesting substantial genetic structure among collections. In addi-tion, the effect of the distance on levels of gene flow was estimated by regressing linearized FST values on geo-graphic distance (Fig. 2). This analysis indicated a signifi-cant correlation between genetic and geographic dis-tances among all collections but no correlation was de-tected among collections from any particular region (data not shown).
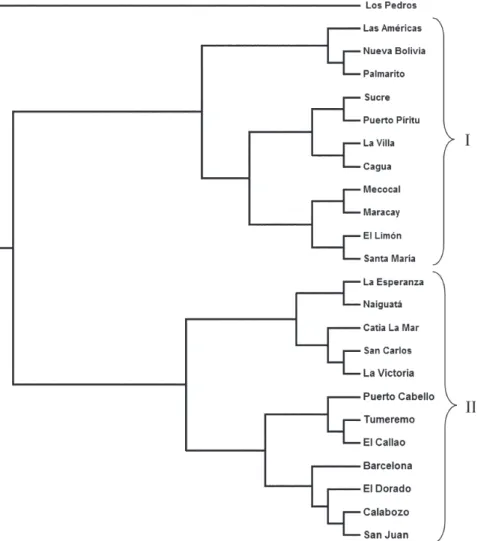
A distance matrix containing all the pairwise linearized FST among collections was collapsed using the UPGMA option in NEIGHBOR and the rectangular cladogram op-tion on PHYLIP (Fig. 3). Two main clusters were detected. Cluster I contains the majority (5/7) of the collections from western Venezuela (ML, WR, WC) and from CR (4/5), while cluster II contained all of the collections from the SR, IL, and NR. The ER collections were distributed in both clus-ters.
We examined the frequencies of the haplotypes in both clusters. Collections in cluster I had the highest frequency of haplotype A (≅ 0.78) while the majority of the collec-tions from Cluster II had haplotype C in hight frequency (≅ 0.43). The Los Pedros collection failed to group in ei-ther Cluster I or II. This collection contained only haplotypes A and E and the frequency of the latter was 0.81
Haplotype diversity -The number of polymorphic sites and the diversity indices for each collection and for all mosquitoes are listed in Table III. The majority of collec-tions had similar numbers of polymorphic sites and diver-sity indices. However, collections from Western Venezu-ela with the exception of WC, had lower values of k, π
1
TABLE II
Analysis of molecular variance in the frequency of ND4 haplotypes among Aedes aegypti collections in Venezuela
Source of variation Degrees of freedom Variance components Variation (%) Fixation index P
Among regions 7 0.32712 10.81 FCT = 0.108 0.01
Among collections within regions 16 0.35044 11.58 FSC = 0.130 < 10-5 Within collections 1120 2.34743 77.60 FST = 0.224 < 10-5
Total 1143 3.02499
Fixation indices: FST, correlation among haplotypes within collections relative to the correlation of random pairs drawn from the whole sample; FSC, correlation among haplotypes within collections relative to the correlation of random pairs drawn from the region; FCT, correlation among haplotypes within regions relative to the correlation of random pairs drawn from the whole sample.
Fig. 2: Mantel regression results show isolation by distance for Aedes aegypti in Venezuela. A: Pairwise FST/(1- FST) regressed on pairwise geographic distance among all collections; B: Pairwise FST/ (1- FST) regressed on pairwise natural logarithm transformed geo-graphic distances.
and π
2 , especially the Nueva Bolivia collection in which values were at least one order of magnitude lower than all others.
Phylogenetic analysis - Phylogenetic analysis pro-vided a well-supported phylogeny with one maternal lin-eage and the presence of another minor linlin-eage. Haplotypes A-F were monophyletic while the haplotype G occurred in a separate clade (Fig. 4).
DISCUSSION
dis-629 629 629 629 629 Mem Inst Oswaldo Cruz, Rio de Janeiro, Vol. 101(6), September 2006
tance. Geographic barriers may limit gene flow. However throughout most of these regions there is intense terres-trial and air traffic. There is a significant correlation be-tween gene flow in Ae. aegypti and human transportation (Craven et al. 1988, Garcia-Franco et al. 2002, Gor-rochotegui-Escalante et al. 2002, Huber et al. 2004, da-Costa-da-Silva et al. 2005, Merril et al. 2005).In addition, there were large FST (0.221) values among collections made across uniform habitats such as the sea coast separated by < 50 km (Fig. 2). Other possibility may be a strong reduction in the effective population size in collections caused by insecticide applications. The presence of only three major haplotypes, unique haplotypes or haplotypes with very small frequencies in some regions could arise due to major population bottlenecks caused by insecti-cide treatment. Similarly, Ayres et al. (2004) have reported that Brazilian populations of Ae. aegypti showed high levels of genetic differentiation in areas most frequently
treated with chemical insecticides. Other investigators suggested that insecticide pressure is probably the major cause of genetic diversity in Ae. aegypti from highly popu-lated urban areas (Paupy et al. 2000, Ocampo & Wesson 2004).
Ae. aegypti in Venezuela have been exposed to chemi-cal insecticides since 1945 when the use of DDT started (Berti et al. 1960). Then, 30 years ago, the intense use of three organophosphates began with malathion and fenithrothion used for adult control and temephos as a larvicide. Insecticide treatments have probably exerted intense selection on the populations and caused severe bottlenecks during vector control efforts. The use of in-secticides has also facilitated the appearance of insecti-cide resistance in Ae. aegypti (Bisset et al. 2001, Rodríguez et al. 2001)
The effective migration rate among even nearby col-lections was low, suggesting reduced gene flow. The
TABLE III
Variability estimates in the mitochondrial genome among Aedes aegypti collections in Venezuela
No. Polymorphic sites k π
1 π2
West Coast 145 16 6.685 0.02065 0.02115
Mecocal 48 14 6.202 0.01915 0.01962
La Esperanza 49 16 6.681 0.02065 0.02114
Los Pedros 48 12 3.832 0.01181 0.01212
Maracaibo Lake 99 13 1.258 0.00390 0.00398
Nueva Bolivia 52 11 0.849 0.00262 0.00268
Palmarito 47 13 1.696 0.00527 0.00536
West Region 99 13 3.172 0.00980 0.01004
Santa María 49 12 3.769 0.01162 0.01193
Las Américas 50 10 2.510 0.00777 0.00794
Inland Region 142 14 6.259 0.01936 0.01980
San Carlos 45 14 6.384 0.01975 0.02020
Calabozo 48 11 5.752 0.01777 0.01820
San Juan 49 11 5.689 0.01758 0.01800
Central Region 237 18 5.142 0.01589 0.01627
Maracay 48 12 4.967 0.01532 0.01572
El Limón 43 14 2.569 0.00792 0.00813
La Victoria 50 16 6.889 0.02130 0.02180
Cagua 47 16 4.470 0.01383 0.01414
Villa de Cura 49 15 3.835 0.01191 0.01213
North Region 135 18 6.535 0.02022 0.02068
Puerto Cabello 41 11 5.357 0.01655 0.01695
Catia la mar 48 18 6.104 0.01890 0.01932
Naiguatá 46 16 6.631 0.02053 0.02098
East Region 144 16 5.820 0.01799 0.01841
Puerto Píritu 50 11 3.944 0.01219 0.01248
Barcelona 45 16 5.245 0.01623 0.01660
Sucre 49 14 5.492 0.01696 0.01737
South Region 143 11 5.657 0.01748 0.01790
Tumeremo 49 11 5.631 0.01740 0.01782
El Dorado 47 11 5.438 0.01680 0.01721
El Callao 47 11 5.730 0.01771 0.01813
All samples 1 144 18 6.073 0.01877 0.01922
k: the mean number of nucleotide differences; π
630 630 630 630
630 Genetic structure of Aedes aegypti • Flor Herera et al.
distribution of haplotypes C and E followed a gradual change in frequency along two spatial gradients. Haplo-type C from the south to the west region separated by a distance of 1160 km and the E from the west to the east separated by 794 km. The spread of these haplotypes fol-lowed the main roads between localities that are used in extended human commerce (Fig. 1).
Cluster analysis of collections from the eight regions shows two main clusters principally associated with the frequency of haplotypes A and C. Haplotype C was most frequent in the SR collections and probably disseminated to nearby regions. Haplotype A was common to all collec-tions with a frequency ≥ 0.18. However, it was most fre-quent in WR (84%) and ML (92%) which suggests that haplotype A originated or was introduced into western Venezuela. The Los Pedros collection was separated from the rest of the collections because it contained the high-est frequency for the haplotype E (0.81) and was similar to the Catia La Mar collection in having the lowest frequency of haplotype A (0.18). The Los Pedros collection appar-ently underwent a bottleneck. Los Pedros is a town near a main road (Carretera Zulia-Falcón), ~15 km away from the WC. However, it may be an “ecological island” since it is
surrounded by kilometers of sand dunes and few plants are able to grow in the lower sections of the dunes.
Phylogenetic analysis of haplotype sequences dem-onstrated two clades. Probably, the oldest clade of Ae. aegypti in Venezuela is represented by the clade that groups the majority of the haplotypes. Besides it has an even geographic distribution showing a frequency of 99% in the whole country. The other lineage occurs at very low frequency (1%) and it is mainly confined to the west-ern region. In the monophyletic group, the common hap-lotype A (58.6%) is split from the two other major haplotypes, C (24.2%) and E (11.8%), in different groups, although they clustered individually only 65% of the time. Based on this low bootstrap value, the two groups can-not be considered completely distinct. However, it is tempt-ing to speculate that haplotype A contributed to the Ae. aegypti gene pool more anciently than the other haplotypes since it is widespread in Venezuela and it has, apparently, less evolutionary changes than the other haplotypes.
Analysis of additional populations from North, Cen-tral, and South America countries will reveal historical and phylogeographic patterns for Ae. aegypti in these
631 631 631 631 631 Mem Inst Oswaldo Cruz, Rio de Janeiro, Vol. 101(6), September 2006
countries. Such knowledge will allow testing from where the haplotypes were introduced into Venezuela. Results can have importance in revealing differences in selection by insecticide resistance genes in Aedes during its dis-persal and evolution.
We compared our data of ND4 in Ae. aegypti with similar studies from Mexico Thailand and Peru. Within Mexico, Thailand, and Peru were identified 25, 7, and 3 haplotypes respectively. Our results are more consistent with the ones from Thailand since we found also seven haplotypes. We detected seven haplotypes but only A, C, and E had appreciable frequencies. The frequencies of these haplotypes varied geographically following two gradientes.
The comparison of our haplotype sequences with simi-lar ones registered in the GenBank (Mexico and Brazil) demonstrated that all the haplotypes found are unique to Venezuela. We also compared the genetic variability of our samples with the ones from Mexico, Thailand and Peru. Mexico has a greater genetic diversity (2-3 times) than Thailand and Peru that could be explained because Mexico has more haplotypes than Thailand (> 3 times) and Peru (> 8 times). Our results exhibit a mixed behaviour. We have only seven haplotypes, a low number like Thai-land and Peru, but the genetic diversity pattern was simi-lar to Mexico.
In addition, the data presented here could have impor-tant implications for dengue transmission since the ge-netic variability in Ae. aegypti from Venezuela may cause differences in their susceptibility to dengue virus. Infor-mation obtained from the Venezuelan Ministry of Health (2006) gave support for this idea. In 2005, dengue has become endemic in the majority of the Venezuelan terri-tory. Nevertheless, there are localized regions over the northeastern parts of the country which are not consid-ered dengue risk areas.
A correlation between population differentiation and heterogenous patterns of vector competence in Ae. aegypti has been suggested for other authors (Tran et al.
1999, Vazeille-Falcoz et al. 1999, 2001, Paupy et al. 2000, 2003, Black WC 4th et al. 2002, García-Franco et al. 2002, Lourenço-de-Oliveira et al. 2004, Ocampo & Wesson 2004). A population genetic analysis and an evaluation to susceptibility to dengue 2 virus were conducted among Ae. aegypti samples from different states of Brazil (Laurenço-de-Oliveira et al. 2004). It was demonstrated that Brazilian Ae. aegypti were genetically differentiated within most of the regions, and that their infection rates towards DENV2 were heterogenous. Other study has found a correlation between genetic distances of Ae. aegypti populations and their infections rates (García-Franco et al. 2002).
This study suggests that the Venezuelan vector con-trol programme may induce recurrent emergence of insec-ticide-resistant populations. Moreover, the rapid fixation of haplotypes conferring insecticide resistance could take place; the resistant populations may be spread at a larger scale as the migration of resistant mosquitoes could be facilitated over the one of susceptible insects. Ae. aegypti resistant to insecticides represent a great problem in den-gue control. The next step will be to look for insecticide resistance in the studied populations to confirm the in-volvement of selection effects in the actual genetic struc-ture of Venezuelan Ae. aegypti population.
ACKNOWLEDGEMENTS
To Alfredo Sánchez and Marcel Sánchez for helping us with the MapInfo Program, Elizabeth Ferrer for advice on the Clustal Program, Esteban Arroyo and Luis Pérez for help with the Arlequin Program, Flor Angel Tovar for technical assistance on sequencing the samples, Omar Cornejo for advice us on statis-tical analysis on preliminary work, Victor Sánchez and Hernán Guzmán for the collection of mosquitoes and William C Black IV for critical reading of the manuscript.
REFERENCES
Ayres CEJ, Melo-Santos MAV, Prota JRM, Solé-Cava AM, Regis L, Furtado AF 2004. Genetic structure of natural populations of Aedes aegypti at the micro- and
632 632 632 632
632 Genetic structure of Aedes aegypti • Flor Herera et al.
graphic levels in Brazil. J Am Mosq Control Assoc20: 350-356
Ballinger-Crabtree ME, Black IV WC, Miller BR 1992. Use of genetic polymorphisms detected by the random-amplified polymorphic DNA polymerase chain reaction (RAPD-PCR) for differentiation and identification of Aedes aegypti sub-species and populations. Am J Trop Med Hyg 47:893-901.
Berti AL, Gabaldón A, Guerrero l, Gómez Nuñez JC 1960. 25 years of antimalarial struggle in Venezuela (1936-1960).
Riv Ital Ig 25: 33-48.
Bisset JA, Rodriguez MM, Molina D, Diaz C, Soca LA 2001. High esterases as mechanism of resistance to organophos-phate insecticides in Aedesaegypti strains. Rev Cubana Med Trop 53: 37-43.
Black WC IV, Bennett KE, Gorrochotegui-Escalante N, Barillas-Mury CV, Fernández-Salas I, de Lourdes Muñoz M, Farfan-Ale JA, Olson KE, Beaty BJ 2002. Flavivirus susceptibil-ity in Aedes aegypti. Arch Med Res 33: 379-88.
Black IV WC, Du Teau NM 1997. RAPD-PCR and SSCP analy-sis for insect population genetic studies. In J Crampton, CB Beard, C Louis, The Molecular Biology of Insect Dis-ease Vectors:A Methods Manual, Chapman and Hall, New York, p. 361-373.
Bosio ChF, Harrington LC, Jones JW, Sithiprasasna R, Norris DE, Scott TW 2005. Genetic structure of Aedes aegypti
populations in Thailand using mitochondrial DNA. Am J Trop Med Hyg 72: 434-442.
Craven RB, Eliason DA, Francy DB, Reiter P, Campos EG, Jakob WL, Smith GC, Bozzi CJ, Moore CG, Maupin GO, Monath TP 1988. Importation of Aedes albopictus and other exotic mosquito species into the United States in used tires from Asia. J Am Mosq Control Assoc 4: 138-142.
da-Costa-da-Silva AL, Capurro ML, Bracco JE 2005. Genetic lineages in the yellow fever mosquito Aedes(Stegomyia) aegypti (Diptera: Culicidae) from Peru. Mem Inst Oswaldo Cruz 100: 539-544.
Excoffier L, Smouse PE, Quattro JM 1992. Analysis of mo-lecular variance inferred for metric distances among DNA haplotypes: application to human mitochondrial DNA re-striction data. Genetics 131: 479-491.
Felsenstein J 1993. PHYLIP, Phylogeny Inference Package. Version 3.5C. Seattle, WA, University of Washington.
García-Franco F, Muñoz Mde L, Lozano-Fuentes S, Fernández-Salas I, García-Rejon J, Beaty BJ, Black WC 4th 2002. Large genetic distances among Aedes aegypti populations along the South Pacific coast of Mexico. Am J Trop Med Hyg66: 594-598.
Gorrochotegui-Escalante N, Gómez-Machorro C, Lozano-Fuentes S, Fernández-Salas I, Muñoz M, Farfan-Ale, García-Rejon J, Beaty B, Black IV W 2002. Breeding struc-ture of Aedes aegypti populations in Mexico varies by re-gion. Am J Trop Med Hyg 66: 213-222.
Gorrochotegui-Escalante N, Muñoz M, Fernández-Salas I, Beaty B, Black IV W 2000. Genetic isolation by distance among Aedes aegypti populations along the notheastern coast of Mexico. Am J Trop Med Hyg 66: 213-222.
Hayashi K 1991. PCR-SSCP: a simple and sensitive method for detection of mutations in the genomic DNA. PCR Meth-ods Appl 1: 34-38.
Huber K, Loan LL, Chantha N, Failloux AB 2004. Human trans-portation influences Aedes aegypti gene flow in Southeast Asia. Acta Trop 90: 23-29.
Kumar S, Tamura K, Nei M 2004. MEGA 3: Integrated soft-ware for Molecular Evolutionary Genetics Analysis and Sequence Alignment. Briefings in Bioinformatics 5: 150-163.
Lourenço-de-Oliveira R, Vazeille M, de Filippis AMB, Failloux AB 2004 Aedes aegypti in Brazil: genetically differentiated populations with high susceptibility to dengue and yellow fever viruses. Tran R Soc Trop Med Hyg 98: 43-54.
Merril S, Ramberg F, Hagedorn H 2005. Phylogeography and population structure of Aedes aegypti in Arizona. Am J Trop Med Hyg72: 304-310
MSDS 2006. Ministerio de Salud y Desarrollo Social. Dirección de Salud Ambiental. Boletín Epidemiológico, Semana Nº 52 (from 01/01/2005 to 31/12/2005). Available at: www. msds.gov.ve.
Nei M 1987. Molecular Evolutionary Genetics, Columbia Uni-versity Press, New York.
Ocampo CB, Wesson DM 2004.Population dynamics of Aedes aegypti from a dengue hyperendemic urban setting in Co-lombia. Am J Trop Med Hyg 71: 506-513.
Orita M, Iwahana H, Kanazawa H, Hayashi K, Sekiya T 1989. Detection of polymorphisms of human DNA by gel elec-trophoresis as SSCPs. Proc Natl Acad Sci USA 86: 2766-2770.
Paupy C, Chantha N, Vazeille M, Reynes JM, Rodhain F, Failloux AB 2003. Variation over space and time of Aedes aegypti in Phnom Penh (Cambodia): genetic structure and oral susceptibility to a dengue virus. Genet Res 82: 171-82.
Paupy C, Vazeille-Falcoz M, Mousson L, Rodhain F, Failloux AB 2000. Aedes aegypti in Tahiti and Moorea (French Polynesia): isoenzyme differentiation in the mosquito popu-lation according to human popupopu-lation density. Am J Trop Med Hyg 62: 217-224.
Rivero J, Urdaneta L, Zoghbi N, Pernalete M, Rubio-Palis Y, Herrera F 2004. Optimization of extraction procedure for mosquito DNA suitable for PCR-based techniques. Intern J Trop Insect Sci 24: 266-269.
Rodríguez MM, Bisset J, de Fernández DM, Lauzan L, Soca A 2001. Detection of insecticide resistance in Aedes aegypti
(Diptera: Culicidae) from Cuba and Venezuela. J Med Entomol 38: 623-628.
Rozas J, Sánchez-DelBarrio JC, Messeguer X, Rozas R 2003. DnaSP, DNA polymorphism analyses by the coalescent and other methods. Bioinformatics19: 2496-2497.
Schneider S, Roessli D, Excoffier L 2000. ARLEQUIN, Version 2.000: A software for Population Genetic Data Analysis. Genetics and Biometry Laboratory, University of Geneva, Geneva.
Slatkin M 1993. Isolation by distance in equilibrium and non-equilibrium populations. Evolution 47: 264-279.
Sunnucks P, Wilson AC, Beheregaray LB, Zenger K, French J, Taylor AC 2000. SSCP is not so difficult: the application and utility of single-stranded conformation polymorphism in evolutionary biology and molecular ecology. Mol Ecol 9:
633 633 633 633 633 Mem Inst Oswaldo Cruz, Rio de Janeiro, Vol. 101(6), September 2006
Tabachnick WJ 1991. Evolutionary genetics and arthropod-borne disease. The yellow fever mosquito. Am Entomol 37: 14-23.
Tajima F 1983. Evolutionary relationship of DNA sequences in finite populations. Genetics 105: 437-460.
Thompson JD, Higgins DG, Gibson TJ 1994. CLUSTAL W: improving the sensitivity of progressive multiple sequence alignment through sequence weighting, position-specific gap penalties and weight matrix choice. Nucleic Acids Res22: 4673-4680.
Tran KT, Vazeille-Falcoz M, Mousson L, Tran HH, Rodhain F, Ngugen TH, Failloux AB 1999. Aedes aegypti in Ho Chi
Minh City (Viet Nam): susceptibility to dengue 2 virus and genetic differentiation. Trans R Soc Trop Med Hyg93: 581-586.
Vazeille-Falcoz M, Mousson L, Rodhain F, Chungue E, Failloux AB 1999. Variation in oral susceptibility to dengue type 2 virus of populations of Aedesaegypti from the islands of Tahiti and Moorea, French Polynesia. Am J Trop Med Hyg 60: 292-299.