The control of deliberate waiting
strategies in a stop-signal task
Departamento de Psicologia e Educação, Faculdade de Filosofia, Ciências e Letras de Ribeirão Preto, Universidade de São Paulo, Ribeirão Preto, SP, Brasil
R.P. Sylwan
Abstract
To inhibit an ongoing flow of thoughts or actions has been largely considered to be a crucial executive function, and the stop-signal paradigm makes inhibitory control measurable. Stop-signal tasks usually combine two concurrent tasks, i.e., manual responses to a primary task (go-task) are occasionally countermanded by a stimulus which signals participants to inhibit their response in that trial (stop-task). Participants are always instructed not to wait for the stop-signal, since waiting strategies cause the response times to be unstable, invalidating the data. The aim of the present study was to experimen-tally control the strategies of waiting deliberately for the stop-signal in a stop-task by means of an algorithm that measured the variation in the reaction times to go-stimuli on-line, and displayed a warning legend urging participants to be faster when their reaction times were more than two standard deviations of the mean. Thirty-four university students performed a stop-task with go- and stop-stimuli, both of which were delivered in the visual modality and were lateralized within the visual field. The participants were divided into two groups (group A, without the algorithm, vs group B, with the algorithm). Group B exhibited lower variability of reaction times to go-stimuli, whereas no significant between-group differences were found in any of the measures of inhibitory control, showing that the algorithm succeeded in controlling the deliberate waiting strategies. Differences between deliberate and unintentional waiting strategies, and anxiety as a probable factor responsible for individual differences in deliber-ate waiting behavior, are discussed.
Correspondence
R.P. Sylwan
Instituto de Investigaciones Facultad de Psicología Universidad de Buenos Aires Av. Independencia, 3065, 3º Piso C1225AAY Buenos Aires Argentina
E-mail: [email protected]
This study was presented as part of the requirements for a Doctoral degree. Some of these data were presented at the XV Annual Meeting of the Federação de Sociedades de Biologia Experimental, Caxambu, MG, Brazil, August 23-26, 2000.
Research supported by a CAPES/SPU fellowship. Publication supported by FAPESP.
Received January 9, 2003 Accepted February 17, 2004
Key words
•Attention •Stop-task •Reaction time •Vision
•Executive functions •Laterality
Introduction
Often, we have to stop our current flow of thoughts and actions to shift to a more ad-equate behavior. Stopping ability is a general requirement in all kinds of cognitive control and is a clear case of executive intervention. One measure of this executive ability is by stop-tasks, which constitute a laboratory
ana-logue of a situation that requires an indi-vidual to stop a planned or prepotent re-sponse, now broadly used in clinical and experimental studies (1-3).
the two lights (i.e., the stop-signal). Lappin and Eriksen (4) investigated the interference that arises when people try to perform two concurrent tasks, within the framework of the studies about the psychological refrac-tory period (i.e., reaction time to the second of two successive stimuli is higher than to the first). They pioneered the studies about the stopping ability by posing the question of how asynchronous could the presentation of the two lights become before the stopping ability was impaired, and found that the probability of inhibiting a response dimin-ished as the asynchrony (stop-signal delay) between go- and stop-signals increased.
Two decades later, Logan and Cowan (2) presented a framework within which the in-hibitory control to stop an action can be understood by developing a formal model for a single act of control. They proposed a model of inhibition underlying the stop-task performance that involves a “horse race” between two sets of processes, i.e., the in-hibitory processes working against the exci-tatory processes. Whether a subject is able to inhibit a response depends upon which of these processes wins the race. The analysis of the temporal evolution of the excitatory and inhibitory processes is based on the difference in time between the onset of the go-signal and the onset of the stop-signal, which enables the subjects to withhold or not their response to the stop-signal. Inhibi-tory and excitaInhibi-tory processes have been pro-posed to be independent. Furthermore, Lo-gan (1) proposed that a single and general mechanism may underlie the ability to inhib-it many kinds of thoughts and actions, and the stop-signal procedure became a very pow-erful tool to infer the reaction time of the inhibitory processes, which are not directly observable. As stated above, the original stop-task procedure involved unimodal vi-sual go- and stop-signals (4), although today most of the stop-tasks cited in the literature usually involve stop- and go-signals pre-sented in different sensory modalities, with a
choice task requiring the selection between visual stimuli and an auditory stop-signal. However, Rubia et al. (5) also used a visual stop-signal instead of an auditory sig-nal, and obtained reliable measures of stop-signal reaction time.
One methodological concern is about the waiting strategies for the stop-signal that subjects develop when they perform the stop-tasks. The model proposed by Logan and Cowan (2) assumes that stop-signal reaction time is constant. Unstable go-signal reaction time, especially due to waiting strategies, spoils the data, since stop-signal reaction time is estimated by subtracting stop-signal delay from mean go-signal reaction time. Thus, participants are always instructed not to wait for the stop-signal. Most studies about the stopping ability report that data from some participants should be discarded be-cause the analysis of their go-signal reaction times shows a significant increase through-out the task. Despite its importance, the prob-lem of how waiting strategies may be con-trolled was not addressed directly in other studies. In a pilot study (Sylwan RP, unpub-lished observations) with a stop-task with both go- and stop-stimuli delivered in the visual modality, some participants waited for the stop-signal overtly, persisting in that behavior despite the fact that the instruction not to wait for the stop-signal was repeated even during the task. In this context, it was necessary to develop a procedural control of such strategies without affecting the stop-signal reaction times.
control procedure and the other group per-formed the task without the algorithm. It was expected that the former group would show faster and more stable reaction times for the go-signal throughout the task.
Material and Methods
A stop-signal task with very simple pro-cedures and stimuli was developed in such a way that formal patient education would not be a requirement that could compromise per-formance (6), and proved to be easy to ad-minister to both young and elderly healthy people (7) and patients with frontal lobe lesions (Sylwan RP, unpublished observa-tions). Thus, in the present study a stop-task with large-sized visual go- and stop-signals was used to ensure that they were clearly detected by all subjects, and presented on a color dual scan display of a notebook com-puter.
This task was developed to be adminis-tered to neurosurgical patients; thus there are many practical reasons to develop a vi-sual unimodal stop-task to be used for clini-cal practice: at hospitals it is usually hard to control the level of environmental noise and it is almost impossible to set a single value for the level of intensity of a tone to be used in all environments. In addition, it is not possible to use headphones to deliver an auditory stop-signal to patients who have recently undergone neurosurgery due to the wounds they may present. To present stimuli, I used a computer device that was easy to carry and to install and which was identical across studies.
Stimuli were displayed using a lateral-ized procedure which, in addition to avoid-ing post-image effects, became an important research tool to explore executive function-ing. Another study with the same stop-task showed significant differences in left and right go-signal reaction times that correlated with visuospatial processing in an executive task, suggesting hemispheric specialization
and interhemispheric transfer in stop- and dual tasks (8).
Participants
Thirty-four university students, 21 women and 13 men, participated in this study. The participants ranged in age from 17 to 26 years, with a mean age (± SD) of 20.4 ± 2.3 years. Ten women and 7 men performed the stop-task without the algorithm on-line (group A), whereas 11 women and 6 men per-formed the stop-task with the algorithm on-line (group B). All of the participants had normal color vision and normal or corrected-to-normal right and left visual acuity, as measured with an ophthalmic vision tester (9). Handedness was assessed by using the Edinburgh Inventory (10) and visual domi-nance was assessed using the Point Test (11). Twenty-two of 34 participants were right-handed with right visual dominance. Since circadian rhythm proved to influence the performance in tasks that demand attentional inhibitory processes (12), for the schedule of the experimental session, the best circadian peak of each participant was considered as determined by the Morning-ness-Eveningness Questionnaire (13).
Apparatus
computer and the remaining free key was aligned with the center of the screen. The tasks were programmed using the MEL Pro-fessional v2.01 software (14) and response times had an accuracy of 1 ms.
Participants performed the computerized tasks individually in a quiet and dimmed room. They sat on a chair of adjustable height, with their heads approximately 60 cm from the center of the screen and responded with the index finger of their dominant hand. Through-out the experimental session, the experi-menter sat immediately behind the subject. Before completing the stop-task the partici-pants performed a simple reaction time task.
Tasks
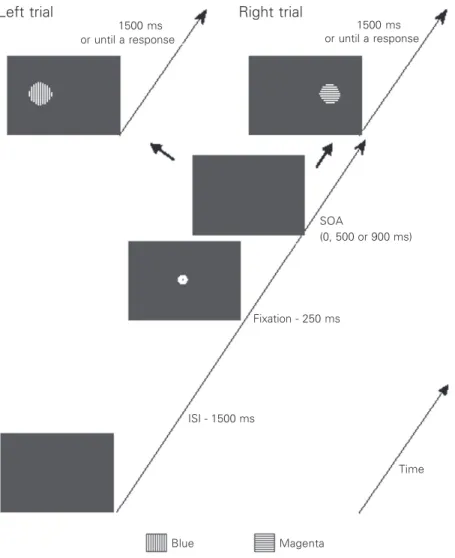
Simple reaction time task. In addition to serving as preparation for the stop-task, this task provided simple reaction time measures that were used as baseline for the between-group comparison. Figure 1 shows a dia-gram of the simple reaction time task. Stimuli were luminous color-filled circles, blue or magenta (equiprobably), equiluminant at 5.4 cd/m2, having a radius of about 2.2 degrees
and shown on a dark background. They were presented randomly and equiprobably with their centers at about 3.4 degrees to the left or to the right of the center of the fixation point (warning signal). Each trial began with the onset at the center of the screen of a 250-ms fixation, a yellow circle of about 0.7 degrees in diameter with a luminance of 11.0 cd/m2 and with a black dot in the center.
After the offset of the warning signal, three preparatory periods (0, 500, and 900 ms) were presented randomly according to an exponential distribution (15) in order to mini-mize anticipatory responses (24, 12 and 6 stimuli for each interval and side, for a total of 84 stimuli). Then, a target was presented, remaining on the screen 1.5 s or until a key-press was made. Trials were presented every 1.5 s. One practice block and three experi-mental blocks (28 trials each) were run. Sub-jects were instructed to respond to the targets with a key-press as fast as possible and they were told to focus their attention on the warning signal while it was activated.
Latencies of less than 100 ms were dis-carded. A pilot study (Sylwan RP, unpub-lished observations) did not yield significant differences between responses to stimuli fol-lowing 0, 500 or 900 ms SOA (stimuli onset asynchrony). Thus, all data analyses were conducted on the mean of the medians of these intervals.
Stop-task. Figure 2 shows a diagram of the stop-task. Stimuli and fixation were the same as those for the simple reaction time task, except that the color of the circles was
Figure 1. Diagram illustrating the simple reaction time task. ISI = inter-stimuli interval; SOA = stimuli onset asynchrony.
Left trial Right trial
1500 ms or until a response or until a response
SOA
(0, 500 or 900 ms) 1500 ms
Fixation - 250 ms
ISI - 1500 ms
Time
green for the go-signal and red for the stop-signal. Both colors were equiluminant at 5.4 cd/m2.
Since it is known that frontal lobe patients may continue to give wrong responses, al-though the delay cited in the literature is initially set at 250 ms, I choose to start from zero delay or go-no-go procedures, to ensure that when assessing frontal lobe patients in the same task, performance in stop-trials would mainly depend on their inhibitory ability.
The go-signal was presented after the off-set of the fixation. In 33% of the trials, a stop-signal followed the go-stop-signal within the con-tralateral hemifield. For key-presses in stop-trials, an auditory signal at a comfortable level (400 Hz, 250 ms) was delivered from the computer speakers as negative feedback. The stop-signal started simultaneously with the go-signal (i.e., a go-no-go procedure) and then an on-line staircase procedure was used to deter-mine the asynchrony between the go-signal and the stop-signal, i.e., the delay. Indeed, the task started as a go-no-go task; if a participant was able to withhold his/her response to the first no-go trial, the next inhibitory trial be-came a stop-trial with a 50-ms delay between the go-signal and the contralateral stop-signal, and so forth. Three experimental blocks (72 trials each) were run. Participants were told to focus their attention on the warning signal while it was activated. They were instructed to respond as fast as possible with a key-press to the go-signal and to withhold their responses if a stop-signal appeared. They were also urged not to wait for the stop-signal.
Participants of group B performed the task with an algorithm that was added to the computer program, which controlled the sta-bility of the response latencies to the go-signals; i.e., when latency was above the mean reaction time plus two-standard devia-tions, computed from a minimum of three go-signal trials, a warning legend (i.e., “Please, be faster for the green circles”) was
displayed on a green background. In addi- Figure 2. Diagram illustrating the stop-task. ISI = inter-stimuli interval.
tion to providing feedback about their perfor-mance, this procedure was supposed to urge subjects to be faster in their responses to the go-signal. The modality of presentation of the stop-signal and the warning legend in-volves practical issues related to the design of the task, and since stimuli within the same sensory modality seem to be more difficult to be ignored (16) a visually presented instruc-tion was used to exert a greater effect on participants than an auditory signal to pre-vent them from using deliberately waiting strategies. Once the warning legend was displayed, the counters of the algorithm were reset. The warning legend remained visible until the experimenter pressed the keyboard space bar rapidly and the task was resumed; this manual procedure to resume the task was performed very fast and was chosen because it helped prevent habituation to the feedback. To determine the stop-signal
de-Left go-trial
Right stop-trial
1000 ms
or until a response
or until a response 1500 ms
Fixation - 250 ms
ISI - 1500 ms
Red Green
lay, the staircase tracking procedure pro-posed by Logan et al. (17) was used, by which the stop-signal delay changes after every stop-signal trial, increasing by 50 ms if the subject can stop the response and de-creasing by 50 ms if the subject fails to inhibit the response. Left and right stop-signals involved independent tracking pro-cedures. Right stop-signal reaction time (RIGHTSSRT) was estimated by subtract-ing the mode of the left stop-signal delay from median right go-signal reaction times (RIGHTGRT). Left stop-signal reaction time (LEFTSSRT) was estimated by subtracting the mode of the right stop-signal delay from median left go-signal reaction times (LEFTGRT). For both tasks, reaction time is reported in milliseconds. The mode of the stop-signal (right or left) delay is the interval between the onset of go- and stop-signals (left or right) at which the participant is able to inhibit 50% of the time.
Response latencies lower than 100 ms were not considered. Note that the go-trials which caused the warning legend to be dis-played were not discarded. The probabilities of responding to the stop-trials were esti-mated by discarding the first 35 trials of the task, which constitute the mean of the num-ber of trials required for all participants to reach a level of performance at which they can inhibit their responses 50% of the time. Median go-signal reaction times (LEFTGRT and RIGHTGRT), stop-signal reaction times (LEFTSSRT and RIGHTSSRT), stop-signal delay’s mode (left delay’s mode and right delay’s mode) and the probability of re-sponding to stop-trials (left probability and right probability) were analyzed separately using one-way ANOVA with side of stimu-lus onset as within-subject factor.
Results
Simple reaction time task
Mean simple reaction time for group A
(M = 295 ± 42 ms) did not differ significantly from that for group B (M = 297 ± 43 ms). Gender, handedness, visual dominance, stimulus color, and side of stimulus onset did not significantly affect simple reaction time for either group, as revealed by ANOVA.
Stop-task
To investigate the possibility that gender, handedness, and visual dominance might affect performance in the stop-task, two-way ANOVA was applied to the data with these variables considered to be between-subject factors and with side considered to be a within-subject factor. No main effects of between-subject factors were observed. Therefore, gender, handedness, and visual dominance were excluded as factors from the experimental analysis.
The effect of time on go-signal reaction times was examined by comparing the mean of RIGHTGRT and LEFTGRT for each block. Two-way ANOVA with group (A and B) as between-subject factor and block (1, 2 and 3) as within-subject factor showed main effects of group [F(1, 32) = 4.15, P < 0.05], with the highest go-signal reaction times for group A, and block [F(2, 64) = 5.61, P < 0.006], and no interaction between these factors. Duncan’s post-hoc test failed to re-veal significant differences across blocks for group B, whereas the go-signal reaction times were significantly lower in the first block for group A when the same analysis was applied to log-transformed data (as a complemen-tary analysis), group lost significance as main factor, whereas block continued to be sig-nificant [F(2, 64) = 10.52, P < 0.001] and a group vs block interaction [F(2, 64) = 4.20, P < 0.02] became evident.
Within-group analysis. One-way ANOVA with hemifield (left vs right) as within subject factor was applied separately to GRTs, SSRT, delay and the probability of responding.
Group A. One-way ANOVA for repeated measures with hemifield (left vs right) as within subject factor revealed that LEFTGRTs (M = 459 ± 148) were signifi-cantly higher than RIGHTGRTs (M = 445 ± 152) [F(1, 16) = 5.91, P = 0.027]. No signifi-cant differences were found between
esti-mated LEFTSSRT (M = 204 ± 56) and RIGHTSSRT (M = 169 ± 103), left delay mode (M = 277 ± 170) and right delay mode (M = 255 ± 170), or the probability of re-sponding to a stop-signal for the left side (M = 0.388 ± 0.158) and for the right side (M = 0.343 ± 0.148).
Group B. One-way ANOVA for repeated measures with hemifield (left vs right) as within subject factor revealed that LEFTGRTs (M = 398 ± 72) were significant-ly higher than RIGHTGRTs (M = 388 ± 77) [F(1,16) = 7.53, P = 0.014]. No significant differences were found between estimated LEFTSSRT (M = 229 ± 55) and RIGHTSSRT (M = 214 ± 80), left delay mode (M = 174 ± 103) and right delay mode (M = 168 ± 100), or the probability of responding to a stop-signal for the left side (M = 0.475 ± 0.091) and for the right side (M = 0.482 ± 0.110).
Discussion
In the simple reaction time task, reaction times were not significantly different be-tween groups, indicating that these did not differ in their response time baselines. The analyses of the data obtained for the stop-task showed that the on-line algorithm pro-cedure to control the stability of responses to the go-signal affected the performance and proved to be effective in prompting the participants to respond faster to the
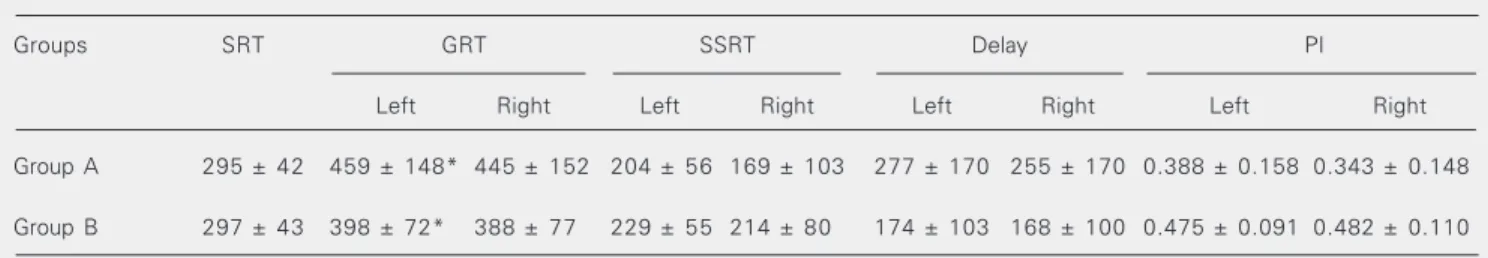
go-Table 1. Performance in the simple reaction time task and the stop-task.
Groups SRT GRT SSRT Delay PI
Left Right Left Right Left Right Left Right
Group A 295 ± 42 459 ± 148* 445 ± 152 204 ± 56 169 ± 103 277 ± 170 255 ± 170 0.388 ± 0.158 0.343 ± 0.148
Group B 297 ± 43 398 ± 72* 388 ± 77 229 ± 55 214 ± 80 174 ± 103 168 ± 100 0.475 ± 0.091 0.482 ± 0.110
signals.
The algorithm succeeded in helping to obtain more stable reaction times and in-creased the probabilities of responding in stop-trials (although the latter remained slightly below the expected 50%). Perhaps the stop-task used in the present study allows performance to exhibit some characteristics not easily observed in other stop-tasks, such as overt waiting strategies. It should be pointed out that most stop-tasks involve a primary two-choice task with responses usu-ally requiring letter discrimination, which is halted by the stop-signal. In such tasks, two kinds of error may occur, i.e., wrong letter discrimination and responding in a stop-trial. Note that correct classification is always possible, whereas not all responses can be withheld. When withholding a response is no longer possible, to press a key by error is likely to be an aversive event. In all stop-tasks participants need to be particularly urged not to wait for the stop-signal, showing the conflictive characteristics of the tasks. There-fore, it could be hypothesized that in stop-tasks involving any choice reaction time go-task (i.e., the primary go-task) the aversive characteristics of pressing a key despite the onset of the stop-signal (i.e., failing to with-hold the response) would be somehow par-tially counterbalanced by the correct re-sponse to the primary task (e.g., a successful letter discrimination), which is not possible in the present stop-task.
Taking the performance in the simple reaction time task as baseline, there is an expected increase in the reaction times as the task complexity increases (i.e., stop-task). However, the present discussion is centered on the effects of the waiting strategies on performance that, besides the increase in task complexity, also contributed to the in-crease of the reaction time to the go-signal in the present stop-task.
Anxiety could be one of the factors af-fecting individual differences in the use of waiting strategies in the stop-task. The
rela-tion between inhibirela-tion, anxiety and aver-sive events is a long-standing issue. The inhibition of ongoing behavior and increas-ing arousal and attention to the environment constitute usual responses to novel stimuli or to those associated with punishment or non-reward (18,19). There are several types of arousal, but only some of them seem to contribute to the generation of anxiety in normal subjects and to the etiology of patho-logical anxiety (20).
involve more covert processes. Quay’s mo-del of child psychopathology (22) predicts a deficit in inhibitory control in children with externalizing disorders, whereas anxious children are predicted to be overinhibited. Although Oosterlaan and Sergeant (23) failed to obtain evidence of overinhibition in anx-ious children, other studies have found that comorbid anxiety improves inhibitory per-formance (20). Although the effect that anxi-ety could have on the inhibitory processes (i.e., the stop-signal reaction time) was not solved here, the present results show that anxiety may exert its effects also on the responses to the primary task, which may explain some of the variance of the go-signal reaction time. Further research about the effect of anxiety on the voluntary and invol-untary waiting strategies in stop-tasks would provide more elements that could be of help for a better understanding of the stopping behavior.
The data presented here show that the stop-signal constitutes a powerful procedure to measure inhibitory processes; however, the waiting strategies for the stop-signal con-stitute a problem that needs to be controlled and understood. The algorithm proposed here may be useful for application to other stop-tasks.
Acknowledgments
I am indebted to Cesar Galera for guid-ance during all my Ph.D. studies and for providing the facilities for this research to be carried out. Special thanks are due to Fabi-ana M. Rosin for her advice and assistance during all stages of this research. I am also grateful to three anonymous reviewers of this article, and to Paul Stephaneck, J. Lino O. Bueno, Luiz Gawryszewski, and Luis Ribeiro do Valle for valuable comments that have been of benefit to this work.
References
1. Logan GD (1994). On the ability to inhibit thought and action. In: Dagenbach D & Carr TH (Editors), Inhibitory Processes in Attention, Memory and Language. Academic Press, London, UK
2. Logan GD & Cowan WB (1984). On the ability of inhibiting thought and action: A theory of an act of control. Psychological Review, 91: 295-327.
3. Logan GD, Cowan WB & Davis KA (1984). On the ability to inhibit simple and choice reaction time responses: a model and a method. Journal of Experimental Psychology: Human Perception and Perfor-mance, 10: 276-291.
4. Lappin JS & Eriksen CW (1966). Use of a delayed signal to stop a visual reaction-time response. Journal of Experimental Psychology, 72: 805-811.
5. Rubia K, Oosterlan J, Sergeant JA, Brandeis D & van Leeuven T (1998). Inhibitory dysfunction in hyperactive boys. Behavioural Brain Research, 94: 25-32.
6. Sylwan RP (2001). Algumas contribuções experimentais ao pro-blema da habilidade inibitória mediante tarefas com interrupção sinalizada. Doctoral thesis, Faculdade de Filosofia, Ciências e Letras de Ribeirão Preto, Universidade de São Paulo, Ribeirão Preto, SP, Brazil. Available on-line: [http://www.teses.usp.br/teses/disponiveis/ 59/59134/tde-26042002-114356].
7. Sylwan RP & Galera C (2000). Efeito da idade sobre a habilidade de deter uma ação manual. Arquivos de Neuro-Psiquiatria, 58: 35 (Ab-stract).
8. Sylwan RP & Galera C (2000). Reaction time and executive
func-tions. International Journal of Psychology, 35: 225 (Abstract). 9. Bausch & Lomb Inc. (1952). Bausch & Lomb occupational vision
tests (Standard No. 1). Purdue University, Rochester, New York. 10. Oldfield RC (1971). The assessment and analysis of handiness: The
Edinburgh Inventory. Neuropsychologia, 9: 97-113.
11. Porac C & Coren S (1981). Lateral preferences and human behavior. Springler-Verlag, New York.
12. May CP & Hasher L (1998). Synchrony effects in inhibitory control over thought and action. Journal of Experimental Psychology: Hu-man Perception and PerforHu-mance, 24: 363-379.
13. Horne JA & Ostberg O (1976). A self-assessment questionnaire to determine morningness-eveningness in human circadian rhythms. International Journal of Chronobiology, 4: 297-310.
14. Schneider W (1988). Micro experimental laboratory: An integrated system for IBM-compatibles. Behavior Research, Methods, Instru-ments and Computers, 20: 206-217.
15. Pins D & Bonnet C (1996). On the relation between stimulus inten-sity and processing time: Piéron’s law and choice reaction time. Perception and Psychophysics, 58: 390-400.
16. Baddeley AD (1996). Exploring the central executive. Quarterly Journal of Experimental Psychology, 49A: 5-28.
17. Logan GD, Schachar RJ & Tannock R (1997). Impulsivity and inhibi-tory control. Psychological Science, 8: 60-64.
19. Gray JA (1983). A theory of anxiety: the role of the limbic system. Encephale, 9: 161-166.
20. McNaughton N & Gray JA (2000). Anxiolytic action on the behav-ioural inhibition system implies multiple types of arousal contribute to anxiety. Journal of Affective Disorders, 61: 161-176.
21. Rieger M & Gauggel S (1999). Inhibitory after-effects in the
stop-signal paradigm. British Journal of Psychology, 90: 509-518. 22. Quay HC (1997). Inhibition and attention deficit disorder. Journal of
Abnormal Child Psychology, 25: 7-13.