SUMMARY
Objective: To assess the distance covered by both eutrophic individuals and individuals with diferent grades of obesity and correlate the data obtained with spirometric values. his study is justiied by the existing diiculty in assessing the functional capacity in obese individuals, and by the low cost and good speciicity of six-minute walk test (6MWT) in predicting reduced capacity for activities of daily living for any individual. Methods: One hundred ity-four individuals of both genders were assessed ater be-ing divided into two groups: G1, obese individuals (n = 93, BMI ≥ 30 kg/m2) and G2,
eutrophic individuals (n = 61, BMI 18.5 to 24.99 kg/m2). he 6MWT was performed
using the methodology described by the American horacic Society (ATS-2002). Spirometry was performed both before and ater the application of a bronchodilator agent (BDA) in accordance with the Guidelines for Pulmonary Function Tests by the Brazilian Society of Pneumology and Phthisiology (SBPT-2002). he statistical analy-sis, consisting of mean, standard deviation, Pearson’s correlation, Student’s t test and Spearman’s correlation, considered p < 0.05. Results: he 6MWT analysis with spirom-etry for G1 was positively correlated only with pre- and post-BDA peak expiratory low rate (PEFR). Conclusion: he present study showed a positive correlation between pre- and post-BDA PEFR and the distance covered in the 6MWT in obese subjects, that is, the higher the PEFR, the higher the physico-functional capacity of the individual, and consequently, the greater the distance covered.
Keywords: Walk; spirometry; obesity; exercise test; pulmonary function tests.
Study conducted at Universidade Católica de Brasília (UCB), Brasília, DF, Brazil
Submitted on: 11/16/2010
Approved on: 04/12/2011
Correspondence to:
Patrícia Lúcia Gontijo AL 23 Lote 08 Apartamento 515 Guará II Brasília, DF, Brazil CEP: 71.060-634 Phone: 55 + 61 8191 9910 [email protected]
Conlict of interest: None.
©2011 Elsevier Editora Ltda. All rights reserved.
Correlation of spirometry with the six-minute walk test in eutrophic
and obese individuals
PATRÍCIA LÚCIA GONTIJO1, TIAGO PESSOA LIMA2, THAIS RIBEIRO COSTA2, EDERSON PAULODOS REIS3, FLAVIA PERASSADE FARIA CARDOSO4, FLORÊNCIO FIGUEIREDO CAVALCANTI NETO5
1 Post-graduation Student; Physical Therapist, Universidade Católica de Brasília (UCB), Brasília, DF, Brazil 2 Post-graduation Student in Physical Therapy in Intensive Care; Physical Therapist, UCB, Brasília, DF, Brazil 3 Graduated in Physical Therapy, UCB; Physical Therapist, Brasília, DF, Brazil
4 Physical Therapist; Doctorate Student in Physical Education, UCB; Professor in the Graduation Course and Post-graduation Coordinator in Physical Therapy in Intensive Care, UCB, Brasília, DF, Brazil
INTRODUCTION
Obesity is a worldwide epidemical disease of fat accumula-tion in the body, caused by excessive and chronic intake of caloric foods linked to a low energy expenditure mainly related to a sedentary lifestyle1-3.
Etiology and risk factors for the development of obesity are multiple, including genetic and psychological aspects, low metabolic rate, bad dietary habits, endocrine diseases, side efects of drugs and sedentary behavior2.
he World Health Organization (WHO)4 indicates that
approximately 1.6 billion adults were overweight in 2005 worldwide, and at least 400 million were obese. Projections for 2015 show that 2.3 billion adults will be overweight and over 700 million will be obese.
he second phase of the 2002-2003 Family Budget Survey by the Instituto Brasileiro de Geograia e Estatísti-ca (IBGE)5 demonstrated that out of 95.5 million people
≥ 20 years of age, 38.8 million (40.6%) were overweight, with 10.5 million being considered obese.
he classiication of overweight and obesity in adults is expressed by the body mass index (BMI – kg/m2). his
index is deined by the weight in kilograms (kg) divided by the squared stature in meters (m2). Individuals with
a BMI < 18.5 kg/m2 are underweight; between 18.5 and
24.9 kg/m2 they are considered normal; between 25 and
29.9 kg/m2 they are overweight. BMI classiications for
obesity are: grade I, a BMI from 30 to 34.9 kg/m2; grade II,
between 35 and 39.9 kg/m2; grade III or extreme obesity
for BMI ≥ 40 kg/m2,4,6.
Five decades ago, obesity was recognized to afect lung function, producing mechanical efects relected on the pulmonary mechanics, possibly leading to a reduced complacency, which may result in a restrictive ventilatory disorder7-10.
he simple spirometry is a pulmonary function test measuring the air inhaled and exhaled by the lungs and the following pulmonary volumes and capacities: forced vital capacity (FVC); forced expiratory volume in one second (FEV1); forced expiratory low between 25% and 75% of the FVC (FEF25-75%); VEF1/FVC ratio and peak expiratory low rate (PEFR)7,11.
Spirometry is indicated to detect whether a pulmo-nary dysfunction is present or not; to rate the severity of a known pulmonary disease; to follow-up the pulmonary function under therapy and the disease course; to assess the efects from environmental and occupational expo-sure; and others12.
Spirometry is a safe procedure, but increased intracra-nial pressure, syncope, dizziness, chest pain, paroxysmal cough, risk for infections, bronchospasm, and pneumo-thorax can occur12.
Grade III obesity can impair the respiratory system be-cause of perithoracic and abdominal fat accumulation, re-ducing the expiratory reserve volume (ERV) and the
func-tional residual capacity (FRC), also promoting ventilation/ perfusion (V/Q) ratio changes from hypoxemia rest and supine hypoxemia, likely because of small airway closure13.
he six-minute walk test (6MWT) is a practical and simple assessment of the submaximal level of functional exercise capacity for activities of daily living14. It
mea-sures the distance a person can walk fast on a lat and hard surface over six minutes. he test assesses and integrates responses from all systems involved during the exercise (cardiovascular, respiratory, neuromuscular, and meta-bolic systems), but it does not provide speciic and isolated information15.
he 6MWT is mainly indicated for: comparing pre- and post-treatment phases; measuring the functional status; and predicting the morbidity and mortality from cardiopul-monary diseases. he primary measurement is the total dis-tance covered. he secondary measurement includes mus-cle fatigue and dyspnea, assessed by the modiied Borg Scale or a Visual Analogue Scale. he last measurement would be the saturation of peripheral oxygen (SpO2), measured by a
pulse oximeter16. Absolute contraindications are: stable and
unstable angina, recent acute myocardial infarction; relative contraindications are: heart rate at rest higher than 120 bpm; systolic blood pressure (SBP) higher than 180 mmHg, and diastolic blood pressure (DBP) over 100 mmHg15.
From the literature review, no speciic studies of refer-ence values for physical-functional and pulmonary capac-ity in obese individuals compared to eutrophic individuals were found. he correlation of these capacities has a consid-erable clinical relevance, as it can contribute to setting strat-egies for preventive treatment and complication treatment in obesity in order to ofer better respiratory conditions with an appropriate choice of the therapeutic method to help in-dividuals to be embedded into a treatment group.
he rationale for this study was the diiculty in assessing functional capacity in obese individuals. he 6MWT has a low cost, is easily applied, and its good speciicity in predict-ing reduced capacity for the activities of daily livpredict-ing in any individual has also inluenced the choice.
he present study aimed to assess the inluence of excess body weight on pulmonary and physical-functional capac-ity, correlating variables of spirometry testing and the six-minute walk test in diferent grades of obesity and in eutro-phic individuals.
METHODS
he sample consisted of 154 sedentary volunteers of both genders between 20 and 59 years of age, non-smokers and divided into two groups: study group (G1) formed by 93 obese subjects (BMI ≥ 30 kg/m2) and control group
(G2), consisting of 61 eutrophic subjects (BMI 18.5 to 24.99 kg/m2). G2 should have a normal spirometry and
Volunteers with physical-mental changes who might not understand the test performance, such as in behavior disorders, with associated and decompensated diseases (heart, metabolic, pulmonary, neuromuscular, and muscu-loskeletal diseases) signiicantly limiting the walk, or dis-agreement about any procedure proposed were excluded.
he present study was approved by the Ethics Committee of the Universidade Católica de Brasília (CEP/UCB 052/2009).
Volunteers were instructed to wear comfortable clothes, appropriate sneakers for a walk, to use their medication normally and not to exercise vigorously over the two hours preceding the tests. An evaluation form containing personal data, vital signs, anthropometric measurements, diseases associated, dyspnea grade, life habits, spirometric parameters and 6MWT was designed.
Initially, volunteers were weighed on a digital scale (Filizola) with 100 g increments and their weight was noted. Stature was checked by a stadiometer (Car-diomed) aixed to the laboratory wall. Heart rate (HR) and saturation of peripheral oxygen (SpO2) were collect-ed from the pulse oxymeter (Moriya®); blood pressure (BP) was measured by a sphygmomanometer (Missouri) and a stethoscope (Littman) on the let upper limb. Waist circumference (WC) was measured at the mid-point between the last costal border and the iliac crest; hip circumference (HC) was measured at the femur ma-jor trochanter level, in an orthostatic position. WC and HC were measured by a 13 mm wide long lexible mea-sure tape (Kapor) with one-millimeter accuracy. Waist/ hip-ratio (WHR) was calculated following the circum-ference measurement.
he 6MWT was performed using the methodology speciied by the American horacic Society (ATS-2002)15
in a hard surface, covered, long, lat and walled corridor which was 30 m long; meter-by-meter marks were done and two cones signaled the walk turn. Parameters such as BP, HR, SpO2, and the modiied Borg scale (it assesses subjectively the degree of efort, assigning a grade from 0 to 10) were collected early and late over the walk. When the test was terminated, the distance covered was calcu-lated through notes of the number of turns performed by the volunteer.
he volunteer was instructed to undergo the test as fast as possible without running for six minutes, walking from one cone to another during the stipulated time and the test could be interrupted at any time.
Every minute the investigator approached the vol-unteer and said encouragement phrases, such as: “You are doing well!” and “Only a few minutes let!”. At these points, SpO2 and HR were veriied in the oxymeter
con-nected to the volunteer through an elastic belt to avoid many displacements and swings and keep the safety of the equipment use.
As soon as the 6MWT was inished, the volunteer should sit down and rest for approximately 30 minutes to undergo the spirometry pre- and post-bronchodila-tor agent (Spirometer: V Max 229 Sensor Medics), per-formed by a trained technician, that is, the volunteer un-derwent spirometry and ater the bronchodilator agent (BDA) administration, he/she waited for 15 minutes to undergo a new spirometry so that the response to the bronchodilator agent could be evaluated.
he spirometry was performed with the volunteer sitting and using disposable mouthpieces for individual use with nose clip, in accordance with the recommen-dations in the Guidelines for Pulmonary Function Tests (Brazilian Society of Pneumology and Phthisiology: SBPT-2002)11. Spirometry report was made by a
pneu-mologist in charge of the Cardiopulmonary Rehabilita-tion Laboratory of Universidade Católica de Brasília.
In the statistical treatment by SPSS 17.0 data explor-atory analyses were made to identify possible misconduct cases or extreme values, normality test for variables, and descriptive statistics with mean and standard deviation for age, BMI and the other pre- and post-BDA spiromet-ric values.
Pearson coeicient of correlation was used to verify a possible association between BMI and the distance cov-ered the WC, and the distance covcov-ered by the 6MWT. he same test was used to verify the association between distance covered and spirometric parameters.
Student’s t test was used to compare the spirometry
variables among the groups for independent samples. his test was also used to compare HR, SpO2, respiratory
rate (RR), BP, WC, WHR and distance covered with the 6MWT in diferent groups. HR in early 6MWT was com-pared with end HR by the paired t test.
Spearman test was used to correlate the obesity grade with the distance covered and the spirometry. All analy-ses were performed with a 5% signiicance level adopted.
RESULTS
he study included 154 subjects, with 93 in G1 and 61 in G2. In the obese group, mean age was 37.6 ± 10.5 years and BMI was 36.73 ± 5.35 kg/m2; in the eutrophic group, mean
age was 29.6 ± 9.0 years and BMI was 22.5 ± 2.05 kg/m2.
In G1, 64.5% were females and 35.5% were males; in G2, 73.8% were females and 26.2% were males. Regarding the obesity grade, the sample included 42 grade I obesity subjects (45.2%), 28 grade II obesity subjects (30.1%), and 23 grade III obesity subjects (24.7%).
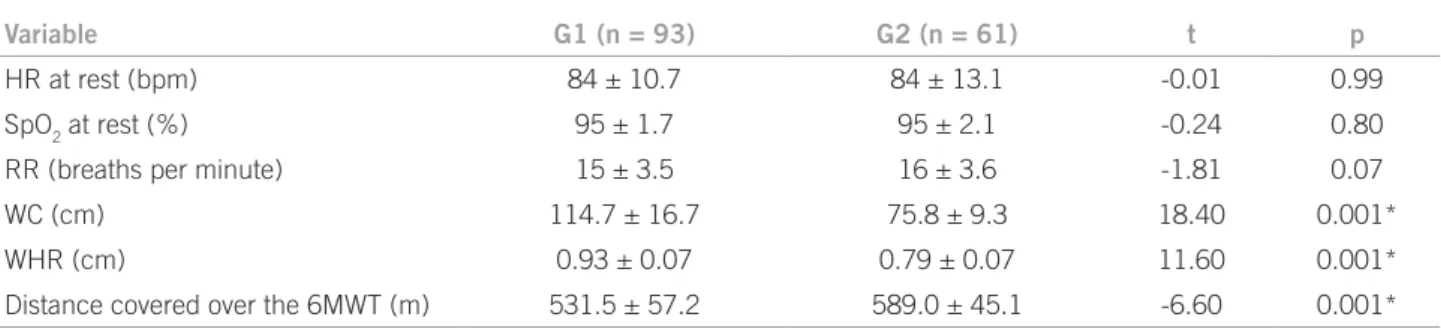
Table 1 – Comparison between groups: HR, SpO2, RR, WC, WHR, and distance covered over the 6MWT
Variable G1 (n = 93) G2 (n = 61) t p
HR at rest (bpm) 84 ± 10.7 84 ± 13.1 -0.01 0.99
SpO2 at rest (%) 95 ± 1.7 95 ± 2.1 -0.24 0.80
RR (breaths per minute) 15 ± 3.5 16 ± 3.6 -1.81 0.07
WC (cm) 114.7 ± 16.7 75.8 ± 9.3 18.40 0.001*
WHR (cm) 0.93 ± 0.07 0.79 ± 0.07 11.60 0.001*
Distance covered over the 6MWT (m) 531.5 ± 57.2 589.0 ± 45.1 -6.60 0.001*
*p < 0.05 is signiicant.
HR, heart rate; SpO2, oxygen peripheral saturation; RR, respiratory frequency; WC, waist circumference; WHR, waist/hip ratio; m, meters; bpm, beats per minute; cm, centimeters; %, percentage.
0.79 ± 0.07 cm for eutrophic group. In the 6MWT, obese subjects covered a mean of 531.5 ± 57.2 m, and eutrophic subjects, 589 ± 45.1 m.
Regarding HR, SpO2 and RR at rest, the groups are
sta-tistically equal, with means and standard deviation shown in Table 1.
Pearson coeicient of correlation identiied a negative and moderate correlation (p = 0.001) between BMI and the distance covered over the 6MWT; a negative and slight association (p = 0.001) was demonstrated between the dis-tance covered and WC in G1 and, in G2, there was no sig-niicant correlation between both variables.
Analysis of HR and SpO2 evolution in both groups ev-ery minute in the 6MWT demonstrated signiicant corre-lation for HR at the third (p = 0.014), ith (p = 0.016), and sixth (0.031) minutes. G1 had a lower HR than G2 all over the test. However, SpO2 had no diference between both
groups.
Systolic (SBP) and diastolic (DBP) BP compared be-tween the groups showed diferences for all initial and end variables (p = 0.001) in 6MWT, with G1 having the highest variable values.
As HR was compared before and at the end of the 6MWT in each group, a statistical signiicance was ob-served (p = 0.001), with G1 showing a mean initial and end HR in the 6MWT 84.5 ± 10.7 bpm and 133 ± 17.4 bpm, respectively, lower than G2, which had a mean initial 84.6 ± 13.1 bpm and 139.1 ± 16.8 bpm for the end-of-the test HR.
Before the 6MWT, the exertion perception on the modiied Borg scale was chosen. In G1, 57 volunteers ini-tiated the walk with no exertion (Borg 0), 11 with minimal exertion (Borg 0.5), 7 with very little exertion (Borg 1), 12 with little exertion (Borg 2) and 6 with moderate exertion (Borg 3). In G2: 46 volunteers initiated the walk at Borg 0, 9 at Borg 0.5, 2 at Borg 1, 3 at Borg 2, and only one at Borg 3.
At the end of the 6MWT, the exertion perception for G1 was: 2 obese subjects ended the walk at Borg 0; 6 at Borg 0.5; 8 at Borg 1; 24 at Borg 2; 33 at Borg 3; 8 had
a nearly severe exertion (Borg 4); 6 had severe exertion (Borg 5); 4 had profound exertion (Borg 7); and 2 maxi-mum exertion (Bort 10). In G2: 4 eutrophic subjects had Borg 1; 4 had Borg 0.5; 15, Borg 2; 26, Borg 3; two, Borg 4; seven, Borg 5; and 3 Borg 7.
As the association between obesity grade and distance covered over the 6MWT was veriied, Spearman coeicient demonstrated a negative and moderate correlation between the variables (p = 0.001), i.e., subjects with grade I obesity covered a longer distance than the other obese subjects.
he spirometric parameters pre- and post-BDA FEV1/ FVC (p = 0.0001) and post-BDA FEF25-75% (p = 0.04)
showed a negative correlation compared with all the spi-rometric parameters in both groups, with G1 showing re-duced values related to G2.
When the obesity grade was correlated with the spi-rometry parameters by Spearman test, a negative associa-tion of the peak expiratory low rate was found. For pre-BDA PEFR the p-value was 0.007, whereas for post-pre-BDA PEFR p = 0.02, i.e., the higher the obesity grade, the lower the peak low reached. For the other parameters, there was no signiicant correlation.
he mean spirometric parameters for pre-BDA FVC and post-BDA FEV1 were lower in grade II obese subjects
related to grade III obese subjects, difering from the other parameters which had decreasing means as obesity in-creased (Table 2).
he spirometry had ive diferent spirometric reports for G1, with 84 revealing a normal spirometry (90.3%); ive had a slight reversible post-BDA obstructive ventila-tory disorder (5.4%); three had a slight restrictive venti-latory disorder (3.2%) and only one subject had a mixed ventilatory disorder with a moderate nonreversible post-BDA obstructive component (1.1%).
Table 2 – Mean percentage of spirometry predicted values in the obese group, according to the obesity grade (n = 93)
Spirometry (predicted %)
Grade I (n = 42) Grade II (n = 28) Grade III (n = 23)
Pre-BDA Post-BDA Pre-BDA Post-BDA Pre-BDA Post-BDA
FVC 102.3 ± 14.6 101.1 ± 14.2 96.8 ± 12 96.6 ± 12 98.6 ± 12.2 99.5 ± 11.4
FEV1 100.8 ± 14 101 ± 13.8 95 ± 11.8 96.7 ± 12.4 94.6 ± 13 96.8 ± 13.2
FEV1/FVC 82.9 ± 3.9 84.3 ± 3.8 82.3 ± 4.3 83.5 ± 3.9 81.3 ± 6.6 82.3 ± 4.4
FEF25-75% 100 ± 21.9 107.7 ± 23.2 93.5 ± 23.2 101.6 ± 25.4 87.4 ± 24.1 94.9 ± 24.4
PEFR* 109.3 ± 17.7 107.3 ± 16.7 103.5 ± 17.1 106.9 ± 18 89.1 ± 16.3 93.5 ± 16.8
* p < 0.05 is signiicant.
Pre-BDA, pre-bronchodilator agent; Post-BDA, post-bronchodilator agent; FVC, forced vital capacity; FEV1, forced expiratory volume in one
second; FEF25-75%, forced expiratory low between 25% and 75% of the FVC; FEV1/FVC = FEV1/FVC ratio; PEFR, peak expiratory low rate.
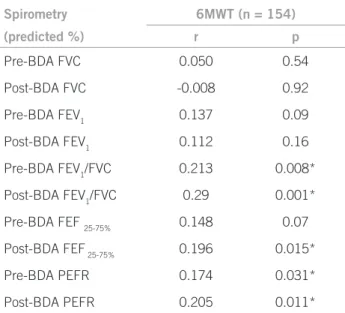
Table 3 – Correlation between the whole sample of the distance covered over 6MWT and spirometry (Pearson Coeficient)
Spirometry 6MWT (n = 154)
(predicted %) r p
Pre-BDA FVC 0.050 0.54
Post-BDA FVC -0.008 0.92
Pre-BDA FEV1 0.137 0.09
Post-BDA FEV1 0.112 0.16
Pre-BDA FEV1/FVC 0.213 0.008*
Post-BDA FEV1/FVC 0.29 0.001*
Pre-BDA FEF 25-75% 0.148 0.07
Post-BDA FEF 25-75% 0.196 0.015*
Pre-BDA PEFR 0.174 0.031*
Post-BDA PEFR 0.205 0.011*
*p < 0.05 is signiicant.
Pre-BDA, pre-bronchodilator agent; Post-BDA, post-bronchodilator
agent; FVC, forced vital capacity; FEV1, forced expiratory volume
in one second; FEF25-75%, forced expiratory low between 25% and
75% of the FVC; FEV1/FVC = FEV1/FVC ratio; PEFR, peak expiratory
low rate.
According to ATS15, the 6MWT should be
discontin-ued if the volunteer have chest pain, unbearable breath-lessness, leg cramps, dizziness, excess sweating and pallor. In the study, only an eutrophic female volunteer needed to close the test from severe back pain.
he eutrophic females covered a mean of 583.44 ± 43.75 m versus 522.61 ± 48.54 m for obese fe-males, and eutrophic males obtained a mean covered dis-tance 604.68 ± 46.47m versus 547.81 ± 68.16 m for the obese ones. his data bears out the study by Perecin et al.19, which concluded eutrophic individuals walk longer
distances than obese individuals. In addition, they con-irmed what ATS presents15 – two of the factors reducing
the distance in 6MWT would be a high body weight and female gender. Duration of obesity, on average 10 years for G1, can also have contributed to the reduced distance covered, as complications and changes are known to arise over the time.
he current study shows a negative and moderate as-sociation between the distance covered in the 6MWT and BMI, which was not observed by Pelegrino et al.20 in
a study conducted with patients presenting a chronic ob-structive pulmonary disease, with no signiicant associa-tion between distance and BMI.
A slight negative association was observed when the obesity grade and the distance covered overt the 6MWT were correlated, in which the lower the obesity grade, the longer the distance covered. he same result was found by Pires et al.21 with diferent BMI grades.
he oxygen desaturation peak over the 6MWT, in this study, was maintained over the irst minute for obese sub-jects and over the irst three minutes for eutrophic subsub-jects, unlike the study by Brunetto et al.22 with COPD patients,
who reached the peak at the third and sixth minutes of the test, demonstrating a lack of physical functional itness in obese individuals.
In obesity, the function of respiratory muscles is im-paired from the increased resistance they must overcome and from the reduced capacity of these muscles23.
In-creased body fat can afect pulmonary function tests, with a slight decrease in pulmonary volumes being associated. As the same analysis of 6MWT with the spirometric
pa-rameters only for G1 is performed, a weak positive correla-tion was observed only for pre- (p = 0.007) and post-BDA (p = 0.005) PEFR, i.e., the longer the distance covered, the higher the PEFR value in the obese group, whereas for G2 there was no signiicant correlation.
DISCUSSION
According to Enright and Sherril17, there are formulas
pre-dicting the distance covered over the 6MWT regarding age, weight and stature. In the study by Barata et al.18, the
As shown by Collins et al.24, FVC, VEF
1 and total
pulmo-nary capacity (TPC) are signiicantly decreased in patients with elevated body fat. his was also observed in the pres-ent study, in which the mean predicted percpres-entage of spi-rometric parameters decreased as the obesity grade rose.
he present study results bear out data by Domin-gos-Benício et al.25, who found no signiicant diferences
between FVC and FEV1 values in both eutrophic and
obese subjects. However, the results contradict these au-thors’ statement that there would be a diference in the FEV1/FVC ratio between both groups.
According to Teixeira et al.10, the higher the excess
weight, the lower the FEV1/FVC ratio and FEF25-75%. here is a controversy in the study by Jones and Nzekwu26, which
showed obesity is associated with a high FEV1/FVC ratio. he present study found a negative correlation for post-BDA FEF25-75% between both groups, indicating this value is reduced in the obese group.
Obese people oten complain of dyspnea, even though they do not have a demonstrable lung disease27. Obesity can
cause a limited airway low, with reduced VEF1 and FVC. Unlike asthma, these reductions are typically symmetrical and result in a preserved FEV1/FVC ratio. A number of
authors demonstrate the FEV1/FVC ratio is increased in
obesity, consistently with the restrictive physiology9,28.
It is noteworthy that out of 93 obese subjects, only three had a mild restrictive ventilatory disorder diagnosed by spirometry, i.e., 3.2%. In the study by Silva et al.13, over
10% of the 50-patient-sample were found with a mild to moderate restriction grade, and Faintuch et al.29 diagnosed
20.9% of mild restrictive grade in 46 candidates for bariat-ric surgery.
Airway narrowing from obstructive phenomena asso-ciated with weight gain could explain the other diagnoses in the study, as Teixeira et al.10 believed in a study of grade
II and III obese subjects.
According to Pereira11, airway obstruction is a feature
in asthma, emphysema, chronic bronchitis, bronchiolitis, and bronchiectasis. However, in the present study, no vol-unteer had any of these diseases previously diagnosed.
he 6MWT reproducibility seems to be higher than that for FEV1 in patients with COPD15. A number of
stud-ies show signiicant associations between the distance over the 6MWT and FEV1
20,30. However, Pereira11 states FEV 1
is weakly correlated with exercise capacity and symptom improvement in patients with COPD.
he present study showed a positive correlation be-tween pre- and post-BDA PEFR and the distance covered over the T6WT in obese subjects. PEFR is an exertion-dependent expiratory parameter, relecting the airway caliber. herefore, when airways are narrow and have a reduced PEFR, the distance covered over the 6MWT will also be reduced, enabling a cause and consequence hy-pothesis.
A positive correlation between the pre- and post-bron-chodilator agent peak expiratory low rate and the distance covered over the 6MWT can be found in obese individuals, i.e., the higher the PEFR, the higher the individual physical-functional capacity and the longer the distance covered.
A relevant point in the study was obese group covered a shorter distance over the 6MWT compared with the eu-trophic group, with a signiicant diference. his shows the interference a number of years of obesity settlement can cause on the individual and demonstrates the clinical im-portance of this inding for further studies.
Another important inding was the higher the obesity grade, the bigger the repercussions these individuals could show in spirometric parameters, which were reduced in this group.
ACKNOWLEDGEMENTS
he authors wish to thank the assistance and contribution of the Universidade Católica de Brasília, Dr. João Daniel, the coordinator Renata Nóbrega, and Otacílio Reis.
REFERENCES
1. Kane A B, Kumar V. Patologia nutricional e ambiental. In: Abbas AK, Fausto N, Kumar V, coordenadores. Robbins e Cotran: patologia: ba-ses patológicas das doenças.7ª ed. Rio de Janeiro: Elsevier; 2005. p. 482-6.
2. Pedroso ERP, Oliveira RG. Blackbook: clínica médica.Belo Horizon-te: Blackbook Editora; 2007. p. 536-58.
3. Wanderley EM, Ferreira VA. Obesidade: uma perspectiva plural. Ciênc Saúde Coletiva 2010;15(1):185-94.
4. World Health Organization. Obesity and over weight. N. 311. Updat-ed September; 2006. [citUpdat-ed 14 Feb 2009]. Available at: http://www. who.int/mediacentre/factsheets/fs311/en/index.html.
5. IBGE. Pesquisa de Orçamentos Familiares (POF), 2002-2003. [cited 9 Feb 2009]. Available at http://www.ibge.gov.br.
6. Jensen MD. Obesidade. In: Andreoli TE, Cecil RL, coordenadores. Cecil: medicina interna básica. 6ª ed. Rio de Janeiro: Elsevier; 2005. p. 1552-62.
7. Barreto SSM. Volumes pulmonares. J Pneumol. 2002;28 (Supl 3):83-94. 8. Rasslan Z, Saad Junior R, Stirbulov R, Fabbri RMA, Lima CAD. Ava-liação da função pulmonar na obesidade graus I e II. J Bras Pneumol 2004;30(6):508-14.
9. Beuther DA, Weiss ST, Sutherland ER. Obesity and asthma. Am J Respir Crit Care Med 2006;174(2):112-9.
10. Teixeira CA, Santos JE, Silva GA, Souza EST, Martinez JAB. Preva-lência de dispnéia e possíveis mecanismos isiopatológicos envol-vidos em indivíduos com obesidade graus 2 e 3. J Bras Pneumol 2007;33(1):28-35.
11. Pereira CAC. Espirometria. J Pneumol 2002;28 (Supl 3):1-82. 12. Douce FH. Provas de função pulmonar. In: Scanlan CL, Wilkins RL,
Stoller JK. Fundamentos da terapia respiratória de Egan. 7ª ed. São Paulo: Manole; 2000. p. 394-401.
13. Silva AMO, Boin IFS, Pareja JC, Magna LA. Análise da função res-piratória em pacientes obesos submetidos à operação Fobi-Capella. Rev Col Bras Cir 2007;34(5):314-20.
14. Solway S, Brooks, D, Lacasse Y, homas S. A qualitative systematic overview of the measurement properties of functional walk tests used in cardiorespiratory domain. Chest 2001;119(1):256-70. 15. American horacic Society. ATS Statement: Guidelines for the
16. Enright P L. he six minute walk test. Respir Care 2003;48(8):783-5. 17. Enright PL, Sherril DL. Reference equations for the six-minute
walk in healthy adults. Am J Respir Crit Care Med 1998;158(5 Pt 1):1384-7.
18. Barata VF, Gastaldi AC, Mayer AF, Sologuren MJJ. Avaliação das equações de referência para predição da distância percorrida no teste de caminhada de seis minutos em idosos saudáveis brasileiros. Rev Bras Fisioter 2005;9(2):165-71.
19. Perecin JC, Domingos NC, Gastaldi AC, Souza TC, Cravo SLD, Solo-guren MJJ. Teste de caminhada de seis minutos em adultos eutróicos e obesos. Rev Bras Fisioter 2003;7(3):245-51.
20. Pelegrino NRG, Lucheta PA, Sanchez FF, Faganello MM, Ferrari R, Godoy I. Inluência da massa magra corporal nas repercussões cardiopulmonares durante o teste de caminhada de seis minutos em pacientes com DPOC. J Bras Pneumol 2009;35(1):20-6.
21. Pires SR, Oliveira AC, Parreira VF, Britto RR. Teste de caminhada de seis minutos em diferentes faixas etárias e índices de massa corporal. Rev Bras Fisioter 2007;11(2):147-51.
22. Brunetto AF, Pitta FO, Probst VS, Paulin E, Yamaguti WPS, Ferreira LF. Inluência da saturação de O2 na velocidade do teste de distância percorrida em 6 minutos, em pacientes com DPOC grave. Rev Bras Fisioter 2003;7(2):123-9.
23. Gibson GJ. Obesity, respiratory function and breathlessness. horax 2000;55(Suppl1):41-4.
24. Collins CL, Hoberty PD, Walker JF, Fletcher EC, Peiris AN. he ef-fects of body fat distribution on pulmonary function tests. Chest 1995;107(5):1298-302.
25. Domingos-Benício NC, Gastaldi AC, Perecin JC, Avena KM, Gui-marães RC, Sologuren MJJ et al. Medidas espirométricas em pessoas eutróicas e obesas nas posições ortostática, sentada e deitada. Rev Assoc Med Bras 2004;50(2):142-7.
26. Jones RL, Nzekwu MU. he efects of body mass index on lung vol-umes. Chest 2006;130(3):827-33.
27. El-Gamal H, Khayat A, Shikora S, Unterborn JN. Relationship of dyspnea to respiratory drive and pulmonary function tests in obese patients before and ater weight loss. Chest 2005;128(6):3870-4. 28. Sin DD, Jones RL, Man SF. Obesity is a risk factor for dyspnea but not
for airlow obstruction. Arch Intern Med 2002;162(13):1477-81. 29. Faintuch J, Souza SAF, Valezi AC, Sant’ Anna AF, Gama-Rodrigues
JJ. Pulmonary function and aerobic capacity in asymptomatic bariat-ric candidates with very severe morbid obesity. Rev Hosp Clin Fac Med Univ São Paulo 2004;59(4):181-6.