Instituição: Universidade Federal de Viçosa (UFV), Viçosa, MG, Brasil 1Mestre em Ciência da Nutrição pela UFV; Docente das Faculdades Unidas do Vale do Araguaia, Barra do Garças, MT, Brasil
2Mestre em Ciência da Nutrição pela UFV; Docente do Departamento de Nutrição da Faculdade de Ciências Biológicas e da Saúde da Universidade Federal dos Vales do Jequitinhonha e Mucuri (UFVJM), Diamantina, MG, Brasil 3Doutora em Saúde Pública pela Universidade Federal de Minas Gerais (UFMG; Docente do Departamento de Nutrição e Saúde da UFV, Viçosa, MG, Brasil
Endereço para correspondência: Lorena Barbosa
Travessa Vista Alegre, 105, apto 5 – Centro CEP 78600-000 – Barra do Garças/MT E-mail: [email protected]
Fonte financiadora: Prefeitura Municipal de Diamantina, MG, Brasil Conflito de interesse: nada a declarar
Recebido em: 16/1/2012 Aprovado em: 26/5/2012
Anthropometric and body composition parameters to predict body
fat percentage and lipid profile in schoolchildren
Parâmetros antropométricos e de composição corporal na predição do percentual de gordura e perfil lipídico em escolares
Parámetros antropométricos y de composición corporal en la predicción del porcentaje de grasa y perfil lipídico en escolares
Lorena Barbosa1, Otaviana Cardoso Chaves2, Rita de Cássia L. Ribeiro3
ABSTRACT
Objective: To evaluate the efficacy of anthropometric and body composition parameters in the prediction of body fat percentage and lipid profile in schoolchildren.
Methods: Cross-sectional study with 209 schoolchildren aged between seven and nine years old. The following vari-ables were evaluated: weight, height, body mass index, per-centage of body fat, arm and waist circumferences, conicity index, waist-to-height ratio, waist-to-hip ratio, total choles-terol, triglycerides, and high and low density lipoproteins. Statistic treatment included the use of Kolmogorov-Smirnov, Student’s t and Mann-Whitney tests, and Spearman and Pearson’s correlations. Receiver Operating Characteris tic curves were used to identify the predictors of elevated body fat percentage and lipid alterations.
Results: Body fat percentage was the variable with the largest number of correlations, especially with weight, body mass index, and arm circumference in both genders, and with waist circumference and waist-to-hip ratio among males. Body mass index, arm and waist circumferences in both genders and waist-to-hip ratio for males showed good discriminatory power for predicting high body fat percent-age. Anthropometric and body composition parameters were not able to predict lipid profile alterations, except for body fat percentage, arm and waist circumferences and waist-to-hip ratio, which were good predictors of triglycerides alterations in males.
Conclusions: Dyslipidemia could not be predicted by anthropometric and body composition measurements in children, especially among females, suggesting the need for investigating lipid profile by laboratorial exams.
Key-words: child; dyslipidemias; anthropometry; body composition.
RESUMO
Objetivo: Avaliar a eficácia de indicadores antropomé-tricos e da composição corporal na predição do percentual de gordura e perfil lipídico em escolares.
Métodos: Estudo transversal envolvendo 209 escolares entre sete e nove anos. Foram consideradas as seguintes variáveis: peso, estatura, índice de mas sa corporal, percentual de gordura corporal, circunferências do braço e cintura, índice de conicidade, razão cintura/estatura, razão cintura/quadril, colesterol total, triglice-rídeos e lipoproteínas de alta e baixa densidades. O tratamento estatístico incluiu a utilização dos testes de Kolmogorov-Smirnov,
t de Student, Mann-Whitney e a correlação de Pearson e Spear-man. Para identificação dos preditores do elevado percentual de gordura corporal e das alterações lipídicas, adotou-se a análise da
Receiver Operating Characteris tic Curve.
apresentar fortes correlações com a circunferência da cintura e a razão cintura/estatura nos meninos. O índice de massa corporal, as circunferências do braço e da cintura em ambos os gêneros e a razão cintura/quadril para o sexo masculino apresentaram poder discriminatório satisfatório para predição do percentual de gordura corporal elevado. Os parâmetros antropométricos e de composição corporal não foram capa-zes de predizer alterações no perfil lipídico, com exceção do percentual de gordura corporal, da circunferência do braço e cintura e da razão cintura/quadril, que se mostraram bons preditores de alterações de triglicerídeos no gênero masculino.
Conclusões: A dislipidemia não pôde ser predita por medidas antropométricas e de composição corporal na faixa etária pediátrica, especialmente no gênero feminino, suge-rindo a necessidade da investigação do perfil lipídico por meio de exames laboratoriais.
Palavras-chave: criança; dislipidemias; antropometria; composição corporal.
RESUMEN
Objetivo: Evaluar la eficacia de indicadores antropométri-cos y de composición corporal en la predicción del porcentaje de grasa y perfil lipídico en escolares.
Métodos: Estudio transversal implicando a 209 escolares entre siete y nueve años. Se consideraron las variables a continu-ación: peso, estatura, índice de masa corporal (IMC), porcentaje de grasa corporal (%GC), circunferencia del brazo (CB) y cintura (CC), índice de conicidad (IC), razón cintura/estatura (RCE), razón cintura/cadera (RCC), colesterol total (CT), triglicéridos (TG) y lipoproteínas de alta (HDL) y baja densidad (LDL). El tratamiento estadístico incluyó la utilización de las pruebas de Kolmogorov-Smirnov, prueba t de Student, Mann Whitney y correlación de Pearson y Spearman. Para identificar los predic-tores del elevado %GC y de las alteraciones lipídicas, se adoptó el análisis de las curvas Receiver Operating Characteristics (ROC).
Resultados: El %GC fue la variable que presentó mayor número de correlaciones, correlacionándose fuertemente con peso, IMC y CB en ambos géneros, además de presentar fuertes correlaciones con CC y RCE en los niños. El IMC, CB y CC en ambos géneros y la RCC para el masculino presentaron poder discriminatorio satisfactorio para predic-ción del %GC elevado. Los parámetros antropométricos y de composición corporal no fueron capaces de predecir al-teraciones en el perfil lipídico, con excepción del %GC, CB y RCC que se mostraron buenos predictores de alteraciones de TG en el género masculino.
Conclusión: No se pudo predecir la dislipidemia por me-didas antropométricas y de composición corporal en la franja de edad pediátrica, especialmente en el género femenino, sugiriendo la necesidad de la investigación del perfil lipídico por medio de exámenes laboratoriales.
Palabras clave: niño; dislipidemias; antropometría; composición corporal.
Introduction
As cardiovascular diseases have progressively advanced among children(1), greater attention should be paid to the
iden-tiication of risk factors in this age group. In the 5- to 9-year-old population, about half of the children were overweight accord-ing to the Brazilian Expenditure and Income Survey (Pesquisa de Orçamentos Familiares, POF, 2008-2009). Overweight was found in 33.5% of the children, and obesity already affected 14.3%(2).
Among adults, the role of obesity and abdominal fat have been clearly established as factors that determine cardiovascular risk(3).
Among children, however, further studies should be conducted, because of the relevance of this issue and the fact that several authors have reported contradictory results(4-7). Dyslipidemias are
the major risk factor for coronary heart disease, the main cause of death in Brazil(8). Although signs and symptoms usually appear
only in adulthood, their silent onset occurs in childhood, and the disease progresses as individuals grow older(9).
Laboratory tests to assess lipid proile are not routinely re-quested for children, but easy-to-obtain data, such as anthro-pometric measurements, may prove to be useful as screening tools in clinical practice. This study evaluated the eficacy of anthropometric and body composition parameters in the prediction of body fat and lipid proile in schoolchildren.
Methods
This cross-sectional study enrolled children attending public and private schools in the urban area of the city of Diamantina (13 schools: 10 public and three private), in the Vale do Jequitinhonha, state of Minas Gerais, Brazil. A total of 209 children (126 girls) aged seven to nine years were included. This study was part of a larger investigation, Gestation and birth characteristics and feed-ing in the irst year of life and their association with dyslipidemia and overweight in schoolchildren(10), approved by the Committee
To calculate sample size, the maximum expected fre-quency of overweight in the age group under study was assumed to be 10%, based on municipal data and previous studies(11,12), and the conidence interval was set at 95%. The
minimum sample size was 150 children.
To select participants, all classrooms with students in the age group of interest in all schools were enrolled for random draw-ing. The number of students randomly drawn in each school was proportional to the total number of students enrolled in each school. Children included in the study lived in the urban area, did not have any chronic diseases nor made use of medications for chronic diseases, had not had diarrhea (deined as more than three episodes of watery stools per day on at least three days) one week before the interview and had no medical condition that might affect growth (diabetes, juvenile rheumatoid arthritis, inlammatory bowel disease, cerebral palsy, Down syndrome, leukemia, orthopedic conditions, congenital anomalies).
Data were collected from August 2008 to February 2009 in classes that meet in the morning and in the afternoon by a properly trained dietician, who was also responsible for the study. The anthropometric variables under study were: weight, height, triceps and subscapular skin folds, and waist, hip and arm circumferences. Blood samples were collected to measure total cholesterol (TC), triglycerides (TG) and low and high density lipoproteins (LDL and HDL).
Weight was measured using a 136-kg weighing scale to the nearest 0.1kg, and children were asked to take off shoes and accessories. At the same time, height was measured using a 200-cm stadiometer to the nearest 0.5cm while the child was standing without shoes. After weight and height were measured, body mass index (BMI) was calculated to classify children according to nutritional status using the 2007 World Health Organization (WHO) criteria(13). The cut-off point for
overweight was a Z score equal to or greater than +1. Triceps and subscapular skin folds were measured in the right side of the body using a Lange skinfold caliper. Each measure-ment was made three times, and the inal result was the mean of the two closest values. The triceps skinfold was measured in the posterior area of the right arm, over the triceps, at the midpoint between the acromion and olecranon, and the subscapular fold was measured immediately below and away from the angle of the right scapula(14). The percentage of body fat in children was
estimated using the equations described by Slaughter et al(15),
derived from a multicomponent model and adjusted for sex, maturation level and ethnicity. These equations used the values of the triceps and subscapular skinfolds. Excessive body fat was diagnosed according to the body fat thresholds deined by Lohman (16): more than 20% for boys and 25% for girls.
Waist, hip and arm circumferences were measured using a lexible and inelastic measuring tape. Waist circumference was measured at the midpoint between the costal margin and the iliac crest and the hip, around the maximum circumfer-ence of the buttocks. The arm circumfercircumfer-ence was measured while the child was standing. First the right forearm was raised to form a 90 degree angle with the upper arm, and the measurement was made at the midpoint between the lateral region of the acromion and olecranon. Waist circumference (WC) was classiied according to the cut-off points suggested by Taylor et al(17), which deine that WC is elevated when ≥62 and 62.9cm at 7 years, 64.7 and 65.3cm at 8 years and 67.3 and 67.7cm at 9 years for boys and girls(17).
The waist-to-hip ratio (WHR) was calculated by dividing WC by hip circumference (HC). The waist-to-height ratio (WHeR) was calculated by dividing WC (cm) by height (cm). The conicity index (CI) was calculated using WC, weight and height, according to the equation below:
Conicity
index 0.109
√
weight (kg) height (m) weist
circunference (m)÷
=
Blood samples to assess lipid proiles were collected in the morning after 24-hour fasting by venous puncture and us-ing disposable materials in a municipal reference laboratory. Plasma triglycerides (TG), total cholesterol (TC) and HDL were measured using colorimetric assays. LDL was calculated using the Friedwald equation(18). Lipid proile was classiied
according to the First Brazilian Guidelines for the Prevention of Atherosclerosis in Childhood and Adolescence(1).
The SPSS 11.0 was used for data analysis. The level of sig-niicance was set at 5% (p<0.05). The Kolmogorov-Smirnov test was used to deine variable distribution; if distribution was normal, the Student t test and the Pearson correlation coeficient were used; otherwise, the Mann Whitney test and the Spearman correlation coeficient were calculated. Correlations were interpreted according to the classiication described by Callegari-Jacques(19). Receiver operating
char-acteristics (ROC) curves were built, and the area under the curve was calculated, at a 95% conidence interval.
Children were only examined after the informed consent term was signed by their parents or guardians.
Results
frequent abnormal values in lipid proile were found for TC (60.6%), LDL (32.1%), HDL (25.5%) and TG (8.5%). The percentage of body fat (%BF) was above the limit rec-ommended by Lohman(16) in 32.4% of the schoolchildren.
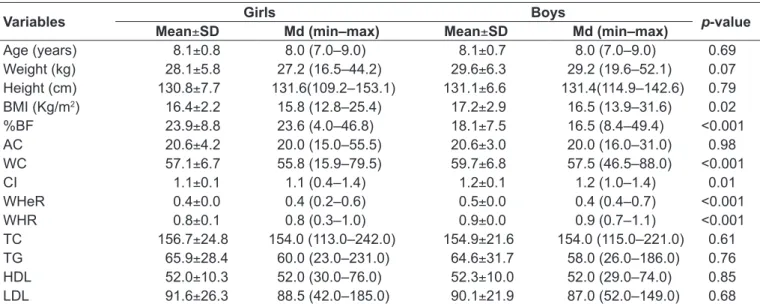
The characteristics of the schoolchildren included in the study are described in Table 1. Mean BMI and median WC, CI, WHeR and WHR were higher for boys, whereas girls had higher %BF.
The variable with the greatest number of correlations with the other anthropometric and body composition parameters was %BF, which was also strongly correlated with weight, BMI, AC for both boys and girls and with AC and WHeR for boys. TC was positively correlated only with %BF, whereas HDL was negatively correlated with WHR in both
boys and girls. The correlation between lipid proile (TC, TG and HDL) and the anthropometric and body composi-tion parameters was weak. The plasma levels of LDL in both boys and girls were not correlated with any of the variables under analysis (Table 2).
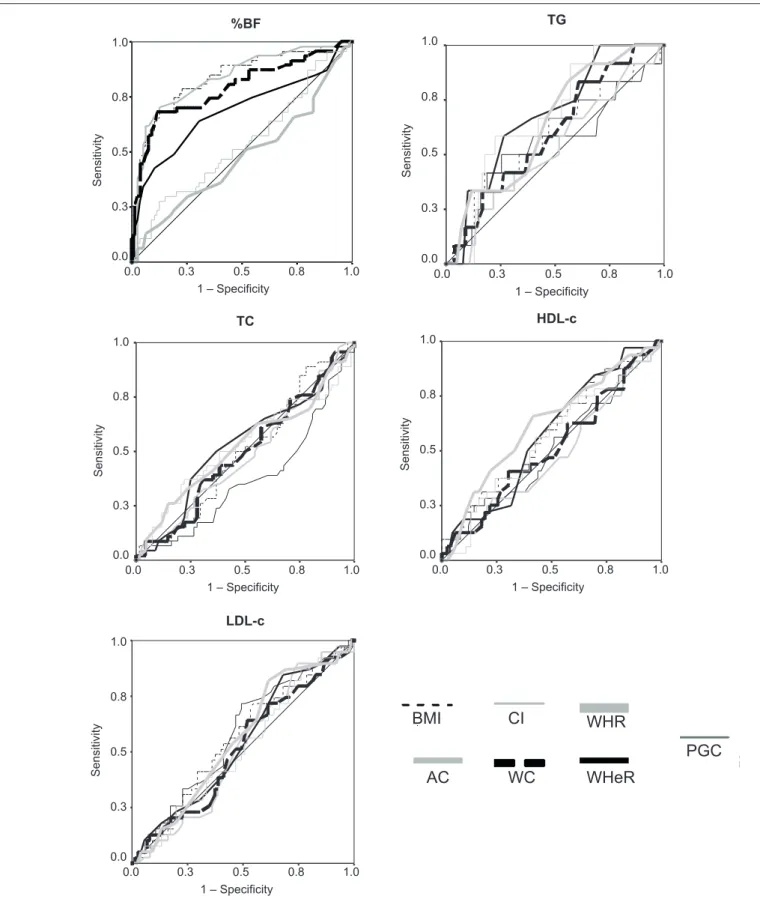
Figures 1 and 2 show the areas under the ROC curves for WHeR, WHR, BMI, CI, AC and WC as predictors of high %BF, TC, TG and LDL and low HDL in boys and girls.
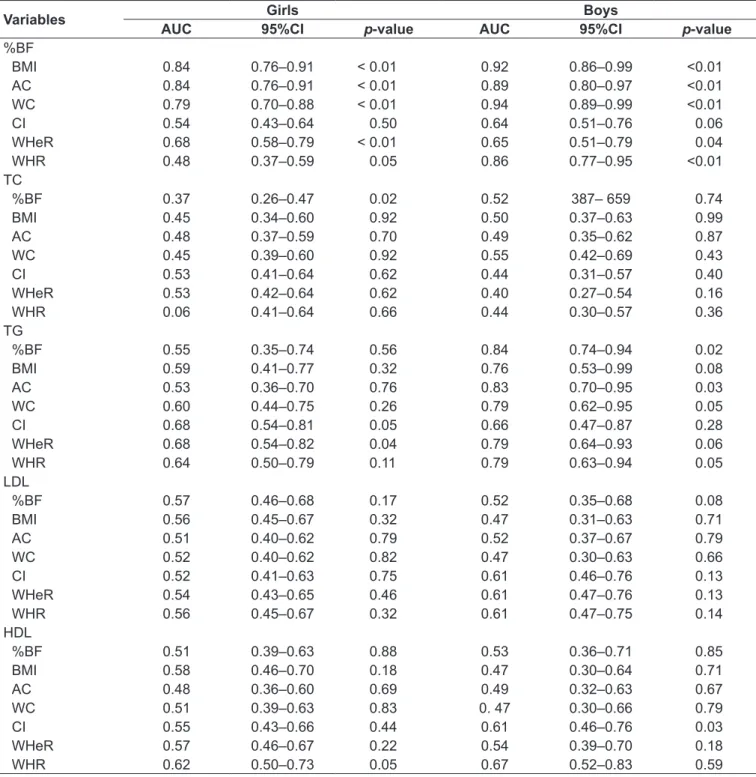
BMI, AC and WC in both sexes and WHR in boys were good predictors of elevated %BF. In general, anthropomet-ric and body composition parameters did not predict lipid proile alterations, except %BF, AC, WC and WHR, which were good predictors of alterations in triglycerides in boys (Table 3).
Table 1 - Age, anthropometric and body composition parameters and lipid proile according to sex. Diamantina, Brazil, 2009
Variables Girls Boys p-value
Mean±SD Md (min–max) Mean±SD Md (min–max)
Age (years) 8.1±0.8 8.0 (7.0–9.0) 8.1±0.7 8.0 (7.0–9.0) 0.69
Weight (kg) 28.1±5.8 27.2 (16.5–44.2) 29.6±6.3 29.2 (19.6–52.1) 0.07
Height (cm) 130.8±7.7 131.6(109.2–153.1) 131.1±6.6 131.4(114.9–142.6) 0.79
BMI (Kg/m2) 16.4±2.2 15.8 (12.8–25.4) 17.2±2.9 16.5 (13.9–31.6) 0.02
%BF 23.9±8.8 23.6 (4.0–46.8) 18.1±7.5 16.5 (8.4–49.4) <0.001
AC 20.6±4.2 20.0 (15.0–55.5) 20.6±3.0 20.0 (16.0–31.0) 0.98
WC 57.1±6.7 55.8 (15.9–79.5) 59.7±6.8 57.5 (46.5–88.0) <0.001
CI 1.1±0.1 1.1 (0.4–1.4) 1.2±0.1 1.2 (1.0–1.4) 0.01
WHeR 0.4±0.0 0.4 (0.2–0.6) 0.5±0.0 0.4 (0.4–0.7) <0.001
WHR 0.8±0.1 0.8 (0.3–1.0) 0.9±0.0 0.9 (0.7–1.1) <0.001
TC 156.7±24.8 154.0 (113.0–242.0) 154.9±21.6 154.0 (115.0–221.0) 0.61
TG 65.9±28.4 60.0 (23.0–231.0) 64.6±31.7 58.0 (26.0–186.0) 0.76
HDL 52.0±10.3 52.0 (30.0–76.0) 52.3±10.0 52.0 (29.0–74.0) 0.85
LDL 91.6±26.3 88.5 (42.0–185.0) 90.1±21.9 87.0 (52.0–149.0) 0.68
Md: Median; min: minimum; max: maximum; SD: standard deviation; BMI: body mass index; %BF: percentage body fat; AC: Arm circumference; WC: Waist circumference; CI: Conicity index; WHeR: waist-to-height ratio; WHR: waist-to-hip ratio; TC: Total cholesterol; TG: triglycerides; HDL: High density lipoprotein; LDL: Low density lipoprotein;
Table 2 - Correlations between anthropometric and body composition parameters with lipid proile variables among schoolchildren.
Diamantina, Brazil, 2009
Variables Girls (n=126) Boys (n=83)
% BF TC TG LDL HDL % BF TC TG LDL HDL
Weight 0.64** 0.00 0.20 -0.03 -0.01 0.78** 0.12 0.21 0.01 0.05 Height 0.43** - 0.02 0.05 -0.04 0.07 0.28** - 0.06 0.07 -0.13 0.10
BMI 0.68** 0.02 0.27** 0.00 -0.08 0.88** 0.20 0.26* 0.09 -0.01
%BF 1 0.20* 0.26** 0.12 0.06 1 0.27* 0.30** 0.20 0.05
AC 0.63** -0.11 0.01 -0.17 0.15 0.84** 0.15 0.24 * 0.03 0.02
WC 0.53** 0.01 0.23** -0.04 0.03 0.79** 0.19 -0.02 0.09 -0.02
CI 0.04 - 0.01 -0.08 -0.01 -0.08 0.2* 0.15 -0.12 0.13 -0.12
WHeR 0.32** 0.02 -0.08 -0.02 -0.08 0.74** 0.25* -0.08 0.17 -0.08
WHR - 0.03 - 0.02 0.24** 0.03 -0.22* 0.20 0.13 0.24* 0.19 -0.24*
*p<0.05 ** p<0.01 ; BMI: body mass index; %BF: percentage body fat; AC: Arm circumference; WC: Waist circumference; CI: Conicity index; WHeR:
LDL-c
1,0 ,8
,5 ,3
0,0 1,0
,8
,5
,3
0,0
0.0 0.0
0.3
1 – Specificity
Sensitivity
0.3
0.5 0.5
0.8 0.8
1.0 1.0
LDL-c
BMI
AC WC
CI WHR
PGC
WHeR PGC
1,0 ,8
,5 ,3
0,0 1,0
,8
,5
,3
0,0 0.0 0.0
0.3
1 – Specificity
Sensitivity
0.3
0.5 0.5
0.8 0.8
1.0 1.0
%BF
1,0 ,8
,5 ,3
0,0 1,0
,8
,5
,3
0,0 0.0 0.0
0.3
1 – Specificity
Sensitivity
0.3
0.5 0.5
0.8 0.8
1.0 1.0
TG
CT
1,0 ,8
,5 ,3
0,0 1,0
,8
,5
,3
0,0 0.0 0.0
0.3
1 – Specificity
Sensitivity
0.3
0.5 0.5
0.8 0.8
1.0 1.0
TC HDL-c
1,0 ,8
,5 ,3
0,0 1,0
,8
,5
,3
0,0 0.0 0.0
0.3
1 – Specificity
Sensitivity
0.3
0.5 0.5
0.8 0.8
1.0 1.0
HDL-c
%BF: percentage of body fat; TC: total cholesterol; TG: Triglycerides; LDL-c: low density lipoprotein; HDL-c: high density lipoprotein; CI: co-nicity index; WHR: Waist-to-hip ratio; WC: Waist circumference; BMI: body mass index; WHeR; Waist-to-height ratio; AC: arm circumference.
Figure 1 - ROC curve for anthropometric and body composition parameters in the evaluation of percentage of body fat and lipid
TG
1,0 ,8
,5 ,3
0,0 1,0
,8
,5
,3
0,0 0.0 0.0
0.3
1 – Specificity
Sensitivity
0.3
0.5 0.5
0.8 0.8
1.0 1.0
TG
LDL-c
1,0 ,8
,5 ,3
0,0 1,0
,8
,5
,3
0,0 0.0 0.0
0.3
1 – Specificity
Sensitivity
0.3
0.5 0.5
0.8 0.8
1.0 1.0
LDL-c
1,0 ,8
,5 ,3
0,0 1,0
,8
,5
,3
0,0
0.0 0.0
0.3
1 – Specificity
Sensitivity
0.3
0.5 0.5
0.8 0.8
1.0 1.0
HDL-c
PGC
1,0 ,8
,5 ,3
0,0 1,0
,8
,5
,3
0,0 0.0 0.0
0.3
1 – Specificity
Sensitivity
0.3
0.5 0.5
0.8 0.8
1.0 1.0
%BF
BMI
AC WC
CI WHR
PGC WHeR
1,0 ,8
,5 ,3
0,0 1,0
,8
,5
,3
0,0 0.0 0.0
0.3
1 – Specificity
Sensitivity
0.3
0.5 0.5
0.8 0.8
1.0 1.0
TC
%BF: percentage of body fat; TC: total cholesterol; TG: Triglycerides; LDL-c: low density lipoprotein; HDL-c: high density lipoprotein; CI: co-nicity index; WHR: Waist-to-hip ratio; WC: Waist circumference; BMI: body mass index; WHeR; Waist-to-height ratio; AC: arm circumference
Figure 2 - ROC curve for anthropometric and body composition parameters in the evaluation of percentage of body fat and lipid
The evaluation of the most accurate cut-off points re-vealed that %BF and WC reached the highest sensitivity and speciicity when using 18.99% and 63.2cm as cut-off points. The eficacy of these two parameters was higher in detecting alterations in triglycerides in boys and resulted in fewer false positive and false negative results.
Discussion
The nutritional status was altered in 27.8% of the school-children, and most were overweight (20.1%). Children in this age group followed the nutritional changes seen in Brazil: nutritional deicits concurrent with alterations due to
Table 3 - Area under the ROC (AUROC) curve of anthropometric and body composition parameters in predicting elevated
percen-tage of body fat and lipid proile alterations in schoolchildren. Diamantina, Brazil, 2009
Variables Girls Boys
AUC 95%CI p-value AUC 95%CI p-value
%BF
BMI 0.84 0.76–0.91 < 0.01 0.92 0.86–0.99 <0.01
AC 0.84 0.76–0.91 < 0.01 0.89 0.80–0.97 <0.01
WC 0.79 0.70–0.88 < 0.01 0.94 0.89–0.99 <0.01
CI 0.54 0.43–0.64 0.50 0.64 0.51–0.76 0.06
WHeR 0.68 0.58–0.79 < 0.01 0.65 0.51–0.79 0.04
WHR 0.48 0.37–0.59 0.05 0.86 0.77–0.95 <0.01
TC
%BF 0.37 0.26–0.47 0.02 0.52 387– 659 0.74
BMI 0.45 0.34–0.60 0.92 0.50 0.37–0.63 0.99
AC 0.48 0.37–0.59 0.70 0.49 0.35–0.62 0.87
WC 0.45 0.39–0.60 0.92 0.55 0.42–0.69 0.43
CI 0.53 0.41–0.64 0.62 0.44 0.31–0.57 0.40
WHeR 0.53 0.42–0.64 0.62 0.40 0.27–0.54 0.16
WHR 0.06 0.41–0.64 0.66 0.44 0.30–0.57 0.36
TG
%BF 0.55 0.35–0.74 0.56 0.84 0.74–0.94 0.02
BMI 0.59 0.41–0.77 0.32 0.76 0.53–0.99 0.08
AC 0.53 0.36–0.70 0.76 0.83 0.70–0.95 0.03
WC 0.60 0.44–0.75 0.26 0.79 0.62–0.95 0.05
CI 0.68 0.54–0.81 0.05 0.66 0.47–0.87 0.28
WHeR 0.68 0.54–0.82 0.04 0.79 0.64–0.93 0.06
WHR 0.64 0.50–0.79 0.11 0.79 0.63–0.94 0.05
LDL
%BF 0.57 0.46–0.68 0.17 0.52 0.35–0.68 0.08
BMI 0.56 0.45–0.67 0.32 0.47 0.31–0.63 0.71
AC 0.51 0.40–0.62 0.79 0.52 0.37–0.67 0.79
WC 0.52 0.40–0.62 0.82 0.47 0.30–0.63 0.66
CI 0.52 0.41–0.63 0.75 0.61 0.46–0.76 0.13
WHeR 0.54 0.43–0.65 0.46 0.61 0.47–0.76 0.13
WHR 0.56 0.45–0.67 0.32 0.61 0.47–0.75 0.14
HDL
%BF 0.51 0.39–0.63 0.88 0.53 0.36–0.71 0.85
BMI 0.58 0.46–0.70 0.18 0.47 0.30–0.64 0.71
AC 0.48 0.36–0.60 0.69 0.49 0.32–0.63 0.67
WC 0.51 0.39–0.63 0.83 0. 47 0.30–0.66 0.79
CI 0.55 0.43–0.66 0.44 0.61 0.46–0.76 0.03
WHeR 0.57 0.46–0.67 0.22 0.54 0.39–0.70 0.18
WHR 0.62 0.50–0.73 0.05 0.67 0.52–0.83 0.59
overweight(20). Our results suggest that interventions should be conducted, as overweight in childhood and adolescence is correlated with risk factors of diseases at this age(21,22) and
later in life(23,24). Moreover, when onset occurs in the
begin-ning of life, the disease tends to be permanent or to worsen
as age advances(25). The prevalence of lipid proile changes
was high among the children in this study, as well as in studies conducted in other Brazilian regions, such as in the cities of Florianópolis(4) and Belém(7).
These results indicate a high risk of coronary heart disease in a group of still very young individuals. One of the possible explanations for the growing prevalence of dyslipidemia among children may be the changes in eating habits and in the level of physical activities that the Brazilian population has experienced in the last years(26). Current life styles favor
the consumption of industrialized foods, often greasier and nutritionally poorer, eating snacks and restaurant meals instead of eating at home, and consuming foods that have more calories and less iber. In addition, modern life ame-nities, such as elevators and escalators, remote controls and cars, as well as the new forms of entertainment enjoyed by children, such as computers and videogames, promote a sedentary life style(6).
Classically, dyslipidemia is one of the major risk factors for several cerebrovascular events, such as atherosclerosis, myo-cardial infarction and stroke. For that reason, the Brazilian Association of Cardiology (Sociedade Brasileira de Cardiologia
— SBC) recommends that prevention and treatment should begin as early as in childhood(1), when atherosclerotic events,
although silent, begin to develop(9).
The diagnosis of dyslipidemia in childhood has received special attention due to the importance of early detection and treatment of this disease. In routine pediatric practice, however, blood tests to assess lipid proiles are not requested, although recommended by the SBC whenever the child has any risk factor(1). In our study, however, classical risk factors
of dyslipidemia in adults, such as high percentage of body fat, overweight or obesity and elevated waist circumference, were not good predictors of dyslipidemia in children. That is, children that did not have risk factors for this disease may have serum lipid and lipoprotein changes and yet go undiagnosed.
In this study, the level of triglycerides was the lipid vari-able correlated with most anthropometric parameters. In
agreement with the correlation analyses and as demonstrated by the ROC curves, only serum levels of triglycerides were predicted by anthropometric parameters for boys, as the percentage of body fat, the waist and arm circumferences and the waist-to-hip ratio had the largest areas under the ROC curve for triglycerides.
Therefore, in addition to evaluating fat mass, fat distri-bution should also be analyzed. Abdominal fat, in addition to being an important predictor of an increase in the level of triglycerides, is associated with a decrease in HDL levels and an increase in left ventricular mass in children and adolescents(27).
The cut-off point of 18.99% for body fat suggested in this study for predicting hypertriglyceridemia in boys is below the reference value, that is, even boys with a percentage of body fat classiied as adequate by Lohman(16) may already
have alterations in their levels of serum triglycerides. The cut-off point for waist circumference seems to be very close to that suggested for 7-year-old children. However, waist circumference increases gradually with age, and it is clearly necessary to adjust the cut-off to age for a better prediction of triglyceride levels in boys.
The anthropometric parameters used in this study were also evaluated as predictors of level of serum lipids by other authors, who found similar results(28). Among older children
and adolescents, the associations between anthropometric parameters and lipid proile are more evident(5,7,29), although
some results are contradictory(6).
Because of the lack of agreement between results, other investigations should evaluate the eficacy of anthropometric parameters in predicting lipid proiles in children, so that the diagnosis of this disorder may be established as early as possible, as about 50% of the children with elevated TC and LDL levels remain like that for 10 to 15 years (tracking)(30,31).
1. Sociedade Brasileira de Cardiologia. I diretriz de prevenção da aterosclerose na infância e na adolescência. Arq Bras Cardiol 2005;85 (Suppl 6):1-36. 2. Brasil. Ministério do Planejamento Orçamento e Gestão; Instituto Brasileiro
de Geograia e Estatística. Diretoria de Pesquisas, Coordenação de Trabalho e Rendimento. Pesquisa de Orçamentos Familiares 2008-2009: antropometria e estado nutricional de crianças, adolescentes e adultos no Brasil. Rio de Janeiro: IBGE; 2010.
3. Organização Pan-americana da Saúde. Doenças crônico-degenerativas e obesidade: estratégia mundial sobre alimentação saudável, atividade física e saúde. Brasília: OPAS; 2003.
4. Giuliano IC, Coutinho MS, Freitas SF, Pires MM, Zunino JN, Ribeiro RQ. Serum lipids in school kids and adolescents from Florianópolis, SC, Brazil – healthy Florida 2040 study. Arq Bras Cardiol 2005;85:85-91.
5. Alcântara Neto OD. Fatores associados à dislipidemia em crianças e adolescentes de escolas públicas de Salvador, Bahia, Brasil [tese de mestrado]. Salvador (BA): Universidade Federal da Bahia; 2010. 6. Nobre LN, Sammour SN, Sobrinho PS, Elias FC, Cavaca SC, Trindade
R et al. Lipid proile and weight excess among school children. RMMG 2008;18:252-9.
7. Ribas SA, Silva LC. Dyslipidemia in schoolchildren from private schools in Belém. Arq Bras Cardiol 2009;92:446-51.
8. Faria EC, Dalpino FB, Takata R. Serum lipids and lipoproteins in children and adolescents from a public university hospital outpatient clinic. Rev Paul Pediatr 2008;26:54-8.
9. Lunardi CC, Petroski EL. Body mass index as a marker of dyslipidemia in children. Arq Bras Cardiol 2009;93:22-7.
10. Barbosa L. Características gestacionais e de nascimento e alimentação no primeiro ano de vida e sua relação com dislipidemias e excesso de peso em escolares [dissertação de mestrado]. Viçosa (MG): Universidade Federal de Viçosa; 2009.
11. Novaes JF. Fatores associados ao sobrepeso e à hipertensão arterial em escolares do município de Viçosa-MG [tese de doutorado]. Belo Horizonte (MG): Universidade Federal de Minas Gerais; 2007.
12. Brasil. Ministério da Saúde. DATASUS [homepage on the Internet]. Estado nutricional - usuários da atenção básica - Minas Gerais [cited 2007 Jun 30]. Available from: http://tabnet.datasus.gov.br/cgi/tabcgi.exe?sisvan/cnv/ acom_mg.def
13. De Onis M, Onyango AW, Borghi E, Siyam A, Nishida C, Siekmann J. Development of a WHO growth reference for school-aged children and adolescents. Bull World Health Org 2007;85:660-7.
14. Cameron N. The measurement of human growth. London/Sidney: Croom Helm; 1984.
15. Slaughter MH, Lohman TG, Boileau RA, Horswill CA, Stillman RJ, Van Loan MD et al. Skinfold equations for estimation of body fatness in children and youth. Hum Biol 1988;60:709-23.
16. Lohman TG. The use of skinfold to estimate body fatness on children and youth. JOPERD 1987;58:98-102.
17. Taylor RW, Jones IE, Williams SM, Goulding A. Evaluation of waist circumference, waist-to-hip ratio, and the conicity index as screening tools for high trunk fat mass, as measured by dual-energy X-ray absorptiometry, in children aged 3-19 y. Am J Clin Nutr 2000;72:490-5.
18. Friedewald WT, Levy RI, Fredrickson DS. Estimation of the concentration of low-density lipoprotein cholesterol in plasma, without use of the preparative ultracentrifuge. Clin Chem 1972;18:499-502.
19. Callegari-Jacques SM. Bioestatística: princípios e aplicações. Porto Alegre: Artmed; 2003.
20. Reis CE, Vasconcelos IA, Oliveira OM. Anthropometric status of Brazilian schoolchildren. Rev Paul Pediatr 2011;29:108-16.
21. Botton J, Heude B, Kettaneh A, Borys JM, Lommez A, Bresson JL et al. Cardiovascular risk factor levels and their relationships with overweight and fat distribution in children: the Fleurbaix Laventie Ville Santé II study. Metabolism 2007;56:614-22.
22. Boyd GS, Koenigsberg J, Falkner B, Gidding S, Hassink S. Effect of obesity and high blood pressure on plasma lipid levels in children and adolescents. Pediatrics 2005;116:442-6.
23. Bibbins-Domingo K, Coxson P, Pletcher MJ, Lightwood J, Goldman L. Adolescent overweight and future adult coronary heart disease. N Engl J Med 2007;357:2371-9.
24. Biro FM, Wien M. Childhood obesity and adult morbidities. Am J Clin Nutr 2010;91:1499S-505.
25. Deshmukh-Taskar P, Nicklas TA, Morales M, Yang SJ, Zakeri I, Berenson GS. Tracking of overweight status from childhood to young adulthood: the Bogalusa Heart Study. Eur J Clin Nutr 2006;60:48-57.
26. Daniels SR, Morrison JA, Sprecher DL, Khoury P, Kimball TR. Association of body fat distribution and cardiovascular risk factors in children and adolescents. Circulation. 1999;99:541-5.
27. Brasil. Ministério do Planejamento Orçamento e Gestão; Instituto Brasileiro de Geografia e Estatística. Diretoria de Pesquisas, Coordenação de Trabalho e Rendimento. Pesquisa de Orçamentos Familiares 2008-2009: análise do consumo alimentar pessoal no Brasil. Rio de Janeiro: IBGE; 2011.
28. Gerber ZR, Zielinsky P. Risk factors of atherosclerosis in children: an epidemiologic study. Arq Bras Cardiol 1997;69:231-6.
29. Lunardi CC, Petroski EL. Body mass index, waist circumference and skinfolds for predicting lipid abnormalities in 11 years old children. Arq Bras Endocrinol Metabol 2008;52:1009-14.
30. Sociedade Brasileira de Pediatria. Prevenção na infância das doenças do adulto: prevenção da doença cardiovascular. Rio de Janeiro: SBP; 2006. 31. Rover MR, Kupek E, Delgado RC, Souza LC. Care to evaluate the lipid
proile in children and adolescents. NewsLab 2011;18:122-8.