Neck circumference as a complementary
measure to identify excess body weight in
children aged 13-24 months
Circunferência do pescoço como medida
complementar para identificar excesso de
peso corporal em crianças de 13-24 meses
de idade
Daniela dos Santos 1
Aila Anne Pinto Farias Contarato 2
Caroline Kroll 3
Mayte Bertoli 4
Sandra Ana Czarnobay 5
Katherinne Barth Wanis Figueirêdo 6
Silmara Salete de Barros Silva Mastroeni 7
Marco Fabio Mastroeni 8
1,2,3,6,8Programa de Pós-Graduação em Saúde e Meio Ambiente. Universidade da Região de Joinville. Rua Paulo Malschitzki, 10. Joinville, SC, Brasil. CEP: 89.219-710.
E-mail: [email protected]
4Departamento de Ciências Biológicas. Universidade da Região de Joinville. Joinville, SC, Brasil.
5Departamento de Nutrição. Associação Educacional Luterana Bom Jesus/IELUSC. Joinville-SC, Brasil.
7Departamento de Educação Física. Universidade da Região de Joinville. Joinville, SC, Brasil.
Abstract
Objectives: to analyze the accuracy of neck circumference (NC) as a measure for assessing excess body weight in children aged 13-24 months of life, according to gender.
Methods: this is a cross-sectional study comparing the neck circumferences in relation to body mass index (BMI) and other anthropometric measures. The best cut-off point for identifying excess body weight was determined using the Receiver Operating Characteristics curve (ROC curve), according to gender and age groups 13-15 months, 16-19 months and 20-24 months.
Results: NC was positively correlated (p<0.001) with body weight and BMI in both genders, and length in girls (p<0.001). Positive correlations were found between NC and BMI in the three age groups (13-15, 16-19 and 20-24 months) in both boys and girls. The NC cut-off points for boys were 23.6, 23.9 and 24.0 cm, and 23.4, 23.5 and 23.6 cm for girls, for the 13-15, 16-19 and 20-24 age groups respectively.
Conclusions: NC can be used to screen for excess body weight in children aged 13-24 months. However, further studies with a larger sample will be required in order to complement these results.
Key words Overweight, Pediatric obesity, ROC curve, Neck
Resumo
Objetivos: analisar a correlação da circunfe-rência do pescoço (CP) com medidas antropométricas em crianças de 13-24 meses de vida, de acordo com o sexo.
Métodos: estudo de corte seccional comparando as medidas de circunferência do pescoço em relação ao índice de massa corporal (IMC) e outras medidas antropométricas. Construiu-se a curva Receiver-Operating Characteristic (ROC) de forma a avaliar o melhor ponto de corte para identificar excesso de peso corporal segundo o sexo e os grupos etários 13-15, 16-19 e 20-24 meses.
Resultados: a CP foi positivamente correla-cionada ao peso corporal e ao IMC em ambos os sexos (p<0,001), e ao comprimento no sexo feminino (p<0,001). O IMC foi positivamente correlacionado (p<0,05) com a CP nos três grupos etários (13-15, 16-19 e 20-24 meses) investigados e em ambos os sexos. Os valores dos pontos de corte da CP para os meninos foram 23,6; 23,9 e 24,0 cm, e para as meninas 23,4; 23,5 e 23,6 cm, respectivamente para os grupos etários 13-15, 16-19 e 20-24 meses.
Conclusões: a CP pode ser utilizada para identi-ficar excesso de peso em crianças de 13 a 24 meses de idade. Contudo, são necessários mais estudos com amostras maiores para complementar nossos resul-tados.
Introduction
The prevalence of overweight and obesity has increased substantially in children and adolescents over the past three decades, with variations from country to country.1Between 1990 and 2010, the
worldwide prevalence of early childhood overweight and obesity increased by 21% over the first decade and 31% over the second decade, and is projected to continue to increase by 36% over the next decade (2010-2020).2In Brazil, childhood obesity has also
increased at an alarming rate. Amongst children aged 5-9 years, the rate of childhood obesity has risen from 2.4% in 1975 to 14.2% in 2009,3generating a
great economic burden for the Brazilian Health System.4
A more rapid increase in weight-for-length during the first six months of life has been shown to be significantly associated with an increased risk of obesity at three years of age.5Furthermore, weight
alterations during infancy may have a greater influ-ence on later risk of obesity than birth weight.5
Therefore, the identification and prevention of modi-fiable risk factors are fundamental for control of excess body weight.6
Anthropometric indices are the most commonly used tools for identifying obesity for reason their practicability, low cost, and strong correlation with body fat.7The anthropometric index most commonly
used is the Body Mass Index (BMI).7However, BMI
cannot provide precise information about body fat distribution.7Measures of waist circumference (WC)
have been used to diagnose excess body weight and body fat accumulation.8,9 More recently, neck
circumference (NC) has been proposed by a number of authors as an effective, inexpensive and easily applied measure for evaluating upper body fat distri-bution7,9-15and thereby identifying children at risk
of developing conditions related to central obesity.16
An additional advantage of using NC as a proxy for upper body fat distribution is that it shows no varia-tion in size throughout the day.7,12
Although several studies have been published that have examined NC as a measure for identifying excess body weight,7,9,12,13,15-21to our knowledge,
no study has been conducted with children under two years of age. The purpose of the present study was thus to evaluate the accuracy of NC as a measure for assessing excess body weight in children aged 13-24 and to provide NC data to help establish guidelines that can be used to identify excess body weight in children under two years of age.
Methods
This cross-sectional study is part of a larger research program examining the determinants and related health outcomes of being large for gestational age (LGA) in childhood. Details of the recruitment process have been previously described.22Briefly,
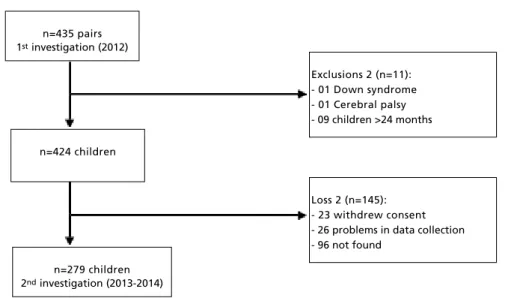
all 435 mothers and child pairs previously enrolled in the larger research program in Joinville, Santa Catarina, Brazil, were invited to participate in this new investigation. Mothers had been previously informed regarding the purpose and logistics of the study and signed an informed consent form. After exclusions and losses, a total of 279 children partici-pated in the present study. Details of the recruitment of the study participants are presented in Figure 1.
Trained researchers took anthropometric measurements of the children and collected demo-graphic data at the homes of the participants between March 2013 and March 2014. The body weight of the children was measured using a portable digital Beurer brand scale, model BY20, with a capacity of up to 20 kg and increments of 10 g. Length was obtained using a pediatric anthropometric ruler with a capacity of up to 100 cm and increments of 1 mm. Body weight and length data were used to calculate BMI (body weight [kg]/length [m²]). The NC was measured using a flexible tape with a capacity of up to 150 cm and increments of 1 mm. At the time of the NC measurement, the children were in the standing position and the measurement was obtained at the level of the thyroid cartilage, with the tape not compressing the skin.
All anthropometric measurements were performed in duplicate and the mean of the two measurements used for analysis. The body weight of each child was classified according to the 2006 WHO Child Growth Standards, BMI for age and gender, which considers the risk of excess body weight (overweight/obese) for children to be a BMI ≥ 85thpercentile.23
Statistical analysis was conducted using the SPSS statistical software (SPSS Inc., version 17.0, Chicago, IL). Distributions of the anthropometric measurements were assessed using the Kolmogorov-Smirnov test. Median and interquartile range were used to analyze the continuous variables. Spearman’s correlation coefficient was used to explore the relationship between NC and age, body weight, length and BMI of the children.
age groups (13-15 months, 16-19 months and 20-24 months). The areas under the curve and the 95% confidence intervals (CI) were determined.
The ROC curve was used to demonstrate the overall discriminatory power of the diagnostic test and the area under the curve (AUC) was used as a measure of the diagnostic power of the test, which in this case is NC. The greater the AUC, the greater the discriminatory power of NC and the 95% CI should not include 0.50.24 Subsequently, the sensitivity
(probability of an individual classified with excess body weight according to NC by age and gender being classified as having excess body weight based on BMI values; true positives) and specificity (pro-bability of an individual classified without excess body weight according to NC by age and gender, being classified as having excess body weight based on BMI values; false positives) were determined. The 95% CIs of anthropometric measures were also estimated. All tests were considered significant at
p<0.05.
The research ethics committee of the University of Joinville Region approved this study under autho-rization Nº 107/2011.
Results
The general characteristics of the children according to gender are described in Table 1. Among the 279 children in our study, 50.8% were male.
Table 2 shows the correlation between NC and age, body weight, length and BMI by gender. There
was a positive correlation between NC and body weight and BMI for boys, and between NC and body weight, length and BMI for girls.
The correlation between NC and BMI by age group and gender are presented in Table 3. Positive correlations were found between NC and BMI in the three age groups examined in both boys and girls. However, Spearman’s correlation coefficient increased with age in boys only.
The AUCs, including optimal cutoff points, sensitivities and specificities for the associations between NC and excess body weight in the three age groups for boys and girls are shown in Table 4. The NC cut-off points increased with increasing age in both boys and girls and the difference in centimeters between the cut-off points did not exceed 0.3 cm in boys and 0.1 cm in girls. However, there was no statistical significance (p>0.05, 95%CI) in the 20-24 months age group for boys or in the 16-19 months age group for girls, according to the AUC values.
Specificity values were generally lower than those for sensitivity, and the latter were higher in boys, except in the 20-24 months age group. The NC cut-off points were able to correctly identify 75.0% to 85.0% of children with risk of excess body weight in boys, and 73.1% to 77.0% in girls. False positives ranged from 7.1% to 51.1% in boys and 31.0% to 47.0% in girls (Table 4).
Figure 1
Flow chart of study participant recruitment. Joinville, Brazil.
n=435 pairs 1stinvestigation (2012)
n=424 children
n=279 children 2ndinvestigation (2013-2014)
Loss 2 (n=145): - 23 withdrew consent - 26 problems in data collection - 96 not found
Table 1
General characteristics of the children according to gender. Joinville, Brazil, 2013-2014.
Characteristic Boys (n=142) Girls (n=137) All
Median (IR) Median (IR) Median (IR)
Age (months) 16.0 (5.0) 15.0 (5.0) 15.0 (5.0)
Body weight (kg) 11.1 (2.1) 10.5 (2.5) 10.8 (2.5)
Length (cm) 80.0 (5.6) 78.5 (5.8) 79.2 (5.5)
BMI (kg/m2) 17.5 (2.5) 16.9 (2.3) 17.1 (2.5)
NC (cm) 24.0 (2.2) 23.5 (1.7) 23.8 (2.0)
IR= Interquartile Range; NC= Neck circumference; BMI= Body mass index.
Table 2
Correlation between neck circumference and age, body weight, length and body mass index by gender. Joinville, Brazil, 2013-2014.
Characteristic Boys (n=139) Girls (n=136)
Rho p Rho p
Age (year) 0.024 0.778 0.124 0.151
Body weight (kg) 0.520 <0.001 0.660 <0.001
Length (cm) 0.117 0.172 0.358 <0.001
BMI (kg/m2) 0.635 <0.001 0.606 <0.001
Rho= Spearman’s rho; BMI= Body mass index.
Table 3
Correlation between body mass index and neck circumference by age and gender. Joinville, Brazil, 2013-2014.
Age (months) N BMI-NC
Rho p
Boys
13−15 65 0.604 <0.001
16−19 44 0.663 <0.001
20−24 30 0.719 <0.001
Girls
13−15 73 0.642 <0.001
16−19 30 0.419 0.021
20−24 33 0.604 <0.001
Discussion
To our knowledge, this is the first study to demons-trate the possibility of using NC to identify excess body weight and upper fat distribution in children under two years of age. The results of this study have shown that body weight and BMI have a positive correlation with NC, corroborating other studies conducted with children older than 2 years of age, in Brazil and other countries.7,9,12,13,15-18,20The results
of the present study also show that there was a moderate positive correlation between NC and BMI in both genders according to age group, supporting the results from studies conducted with Turkish, American and Chinese children.7,12,18
However, some important limitations should be considered. First, the lack of other studies consi-dering the same age group (children under two years of age) made it difficult to compare data. Second, radiographic measurements to quantify upper-body fat deposits were not performed. The cutoff points described in this study should therefore be used with caution, as NC is a proxy for upper-body subcuta-neous fat.11Furthermore, the moderate correlations
and low specificity observed in the present study may be a consequence of the rapid growth and deve-lopment that occurs during early years. Third, the cross-sectional nature of the data does not allow conclusions relating to causality. Finally, the rela-tively small number of children that participated in the study made it difficult to estimate sensibility and specificity by stratifying for gender and age groups.
Although the literature currently contains no data on the correlation between NC and other anthropo-metric measurements in children under two years of age, the moderate correlation found in the present study corroborates the results of other studies
involving older children and adults.7,12,18However,
some authors have also reported moderate to high correlations between NC and age;10-13a result not
found in the current study. A lack of correlation between NC and age may be due to the young age of the children in the study, as demonstrated by the similarity of NC cutoffs among age groups.
The high values of AUC for NC found in the present study (70% to 81% for girls and 80% to 90% for boys) suggest high accuracy of this measure. The values for sensitivity were also high and similar to those of other studies that have investigated the use of NC as a measure to evaluate excess body weight in children and adolescents.7,12,15,16,18However, in
the present study, specificity was lower than that found in other studies,7,12,15,18,21 resulting in a
higher number of false-positives, i.e., a high propor-tion of children classified as having excess body weight when in fact they did not.
Choosing cut-off points that have greater sensi-tivity or specificity has important heath implica-tions.25In terms of public health, it is important that
the method for diagnosing excess body weight presents good sensitivity so as to identify the largest number of children with the condition that can be targeted for appropriate programs or interventions.25
One of the first steps toward controlling the epidemic of childhood obesity is to make monitoring tools available that are low-cost, quick and easy to use, and that are acceptable to both patients and health practitioners. Traditionally, BMI has been used for identifying individuals with obesity;12
although the accuracy of BMI varies according to the percentage body fat of the child. As an alternative to BMI, WC has been used as a proxy for body fat accumulation,8,9especially for screening purposes.18
Nevertheless, WC can be affected by postprandial
Table 4
Area under the curve (AUC), frequency (N), optimal cutoff points, sensitivities and specificities for neck circumference (NC) associated with excess body weight in three age groups of boys and girls. Joinville-SC, Brazil, 2013-2014.
Age (months) N AUC (95%CI) Cutoff (cm) Sensitivity (95%CI) Specificity (95%CI)
Boys
13−15 65 80.0 (68.3−91.0) 23.6 85.0 (64.0-95.0) 48.9 (35.1-63.0)
16−19 44 88.0 (77.1−98.1) 23.9 81.8 (61.4-93.0) 63.6 (43.4-80.2)
20−24 30 90.2 (0−100.0) 24.0 75.0 (50.1-90.4) 92.9 (69.0-98.0)
Girls
13−15 73 81.4 (71.0−92.0) 23.4 73.1 (54.0-86.3) 61.7 (47.4-74.4)
16−19 30 70.0 (51.0−89.0) 23.5 77.0 (50.0-92.0) 53.0 (54.1-86.0)
20−24 33 80.0 (64.4−95.0) 23.6 76.5 (53.0-90.4) 69.0 (44.4-86.0)
abdominal distension,12is time-consuming, and may
be culturally and/or environmentally problematic,7
i.e., some individuals are reluctant to remove their clothing.7As an alternative to WC, the measurement
of NC appears to be a good option for identifying excess body weight and assessing upper body fat.
In addition to obesity,13NC measurements have
been shown to be suitable for assessing other risk factors in adults and children, including metabolic syndrome,10,26obstructive sleep apnea,16
periopera-tive adverse respiratory events,13and
cardio-meta-bolic risk factors.9,11,14Furthermore, in addition to
its accuracy in identifying excess body weight and risk of other related health outcomes, La Berge et al.27have reported that NC showed good inter- and
intra-rater reliability and that it does not require multiple measurements for precision and reliability. The technique can also easily be learned by commu-nity caregivers and is simple to apply in general practice and epidemiological studies.27 Using the
NC measure eliminates the need for scales, a pedi-atric anthropometric ruler and undressing the child, thereby saving time and enabling clinicians and researchers to increase the number of children inves-tigated.
The results of the present study therefore suggest that NC can be used in children under two years of age to identify excess body weight. These findings are important for screening purposes early in life, especially in children living in rural areas, remote parts of large cities or when there is no means to obtain weight and height.
Another important contribution of this study is that it supplies information that is necessary to
esta-blish international cut-off points for identifying excess body weight using the measurement of NC in children. Neck size varies according to age, gender and development and age- and gender-standardized NC values for children are needed to translate this measurement into clinical practice.17Until the
publi-cation of this study, only NC measures with children five years of age or over had been reported.7,9,12,13,15-21
This study has several strengths. It is a home-based design, which includes primary data from a non-institutionalized population. All data, including anthropometric measures, were collected by the same research group, which reduces possible inter-observer biases.
In conclusion, NC can be used to screen for excess body weight in children aged 13-24 months. However, further studies with larger sample sizes need to be conducted in order to complement the data reported in this study.
Acknowledgement
We thank Darcy Vargas Maternity Hospital and the Gimenes Laboratory of Joinville, Santa Catarina, for allowing data to be collected from their facilities in 2012; the Department of Health of Joinville for making the information system available; John Paul Ekwaru and Sarah Loehr of the Population Health Intervention Research Unit/School of Public Health/University of Alberta-Canada for their statis-tical expertise and revision of the English, respec-tively; and the University of Joinville Region for financial support.
References
1. Ng M, Fleming T, Robinson M, Thomson B, Graetz N, Margono C, et al. Global, regional, and national prevalence of overweight and obesity in children and adults during 1980-2013: a systematic analysis for the Global Burden of Disease Study 2013. Lancet. 2014. 384(9945):766-81.
2. Onis M, Blossner M, Borghi E. Global prevalence and trends of overweight and obesity among preschool children. Am J Clin Nutr. 2010; 92:1257-64.
3. IBGE (Instituto Brasileiro de Geografia e Estatística). Pesquisa de orçamentos familiares 2008-2009: antropome-tria e estado nutricional de crianças, adolescentes e adultos no Brasil. Rio de Janeiro; 2010.
4. Bahia L, Coutinho ES, Barufaldi LA, Abreu Gde A, Malhao TA, de Souza CP, et al. The costs of overweight and obesity-related diseases in the Brazilian public health system: cross-sectional study. BMC Public Health. 2012; 12: 440.
5. Taveras EM, Rifas-Shiman SL, Belfort MB, Kleinman KP, Oken E, Gillman MW. Weight status in the first 6 months of life and obesity at 3 years of age. Pediatrics. 2009; 123: 1177-83.
6. Araujo CL, Victora CG, Hallal PC, Gigante DP. Breastfeeding and overweight in childhood: evidence from the Pelotas 1993 birth cohort study. Int J Obes (Lond). 2006; 30: 500-6.
7. Hatipoglu N, Mazicioglu MM, Kurtoglu S, Kendirci M. Neck circumference: an additional tool of screening over-weight and obesity in childhood. Eur J Pediatr. 2010; 169: 733-9.
9. Kurtoglu S, Hatipoglu N, Mazicioglu MM, Kondolot M. Neck circumference as a novel parameter to determine metabolic risk factors in obese children. Eur J Clin Invest. 2012; 42:623-30.
10. Ben-Noun L, Laor A. Relationship of neck circumference to cardiovascular risk factors. Obes Res. 2003; 11:226-31.
11. Guo X, Li Y, Sun G, Yang Y, Zheng L, Zhang X, Sun Z, Ma H, Wang N, Jiang M, Li J, Sun Y. Prehypertension in chil-dren and adolescents: association with body weight and neck circumference. Intern Med. 2012; 51: 23-7.
12. Nafiu OO, Burke C, Lee J, Voepel-Lewis T, Malviya S, Tremper KK. Neck circumference as a screening measure for identifying children with high body mass index. Pediatrics. 2010; 126:e306-10.
13. Nafiu OO, Burke CC, Gupta R, Christensen R, Reynolds PI, Malviya S. Association of neck circumference with peri-operative adverse respiratory events in children. Pediatrics. 2011; 127: e1198-205.
14. Vallianou NG, Evangelopoulos AA, Bountziouka V, Vogiatzakis ED, Bonou MS, Barbetseas J, et al. Neck circumference is correlated with triglycerides and inversely related with HDL cholesterol beyond BMI and waist circumference. Diabetes Metab Res Rev. 2013; 29:90-7.
15. Ferretti Rde L, Cintra Ide P, Passos MA, Ferrari GL, Fisberg M. Elevated neck circumference and associated factors in adolescents. BMC Public Health. 2015; 15:208.
16. Katz SL, Vaccani JP, Clarke J, Hoey L, Colley RC, Barrowman NJ. Creation of a reference dataset of neck sizes in children: standardizing a potential new tool for prediction of obesity-associated diseases? BMC Pediatr. 2014; 14:159.
17. Sacco MR, de Castro NP, Euclydes VL, Souza JM, Rondo PH. Birth weight, rapid weight gain in infancy and markers of overweight and obesity in childhood. Eur J Clin Nutr. 2013; 67: 1147-53.
18. Lou DH, Yin FZ, Wang R, Ma CM, Liu XL, Lu Q. Neck circumference is an accurate and simple index for evalu-ating overweight and obesity in Han children. Ann Hum Biol. 2012; 39: 161-5.
19. Nagy P, Kovacs E, Moreno LA, Veidebaum T, Tornaritis M, Kourides Y, Siani A, Lauria F, Sioen I, Claessens M, Mårild S, Lissner L, Bammann K, Intemann T, Buck C, Pigeot I, Ahrens W, Molnár D, IDEFICS consortium. Percentile reference values for anthropometric body composition indices in European children from the IDEFICS study. Int J Obes (Lond). 2014; 38 (Suppl. 2): S15-25.
20. Coutinho CA, Longui CA, Monte O, Conde W, Kochi C. Measurement of neck circumference and its correlation with body composition in a sample of students in Sao Paulo, Brazil. Horm Res Paediatr. 2014; 82:179-86.
21. Kim Y, Lee JM. Accuracy of Neck Circumference in Classifying Overweight and Obese US Children. 2014; 2014:781841.
22. Sales WB, Silleno Junior JD, Kroll C, Mastroeni SS, Silva JC, Mastroeni MF. Influence of altered maternal lipid profile on the lipid profile of the newborn. Arch Endocrinol Metab. 2015; 59:123-8.
23. WHO (World Health Organization). WHO Multicentre Growth Reference Study Group. WHO Child Growth Standards: Length/height-for-age, for-age, weight-for-length, weight-for-height and body mass index-for-age: Methods and development. Geneve; 2006.
24. Metz CE. Basic principles of ROC analysis. Semin Nucl Med. 1978; 8:283-98.
25. Vieira AC, Alvarez MM, Marins VM, Sichieri R, Veiga GV. Accuracy of different body mass index reference values to predict body fat in adolescents. Cad Saúde Pública. 2006; 22: 1681-90.
26. Yang GR, Yuan SY, Fu HJ, Wan G, Zhu LX, Bu XL, Zhang JD, Du XP, Li YL, Ji Y, Gu XN, Li Y, Beijing Community Diabetes Study Group. Neck circumference positively related with central obesity, overweight, and metabolic syndrome in Chinese subjects with type 2 diabetes: Beijing Community Diabetes Study 4. Diabetes Care. 2010; 33: 2465-7.
27. LaBerge RC, Vaccani JP, Gow RM, Gaboury I, Hoey L, Katz SL. Inter- and intra-rater reliability of neck circumfer-ence measurements in children. Pediatr Pulmonol. 2009; 44: 64-9.
______________
Recebido em 9 de abril de 2015
Versão final apresentada em 26 de junho de 2015