Accuracy of magnetic resonance imaging for
measuring maturing cartilage: A phantom study
Jennifer R. McKinney,IMarshall S. Sussman,II Rahim Moineddin,IIIAfsaneh Amirabadi,I Tammy Rayner,IAndrea S. DoriaI,II,*
IUniversity of Toronto, The Hospital for Sick Children, Department of Diagnostic Imaging, Toronto/ON, Canada.IIThe University Health Network, Toronto
General Hospital, Department of Medical Imaging, Toronto/ON, Canada.IIIUniversity of Toronto, Department of Family and Community Medicine, Toronto/ON, Canada.
OBJECTIVES: To evaluate the accuracy of magnetic resonance imaging measurements of cartilage tissue-mimicking phantoms and to determine a combination of magnetic resonance imaging parameters to optimize accuracy while minimizing scan time.
METHOD:Edge dimensions from 4 rectangular agar phantoms ranging from 10.5 to 14.5 mm in length and 1.25 to 5.5 mm in width were independently measured by two readers using a steel ruler. Coronal T1 spin echo (T1 SE), fast spoiled gradient-recalled echo (FSPGR) and multiplanar gradient-recalled echo (GRE MPGR) sequences were used to obtain phantom images on a 1.5-T scanner.
RESULTS:Inter- and intra-reader reliability were high for both direct measurements and for magnetic resonance imaging measurements of phantoms. Statistically significant differences were noted between the mean direct measurements and the mean magnetic resonance imaging measurements for phantom 1 when using a GRE MPGR sequence (512x512 pixels, 1.5-mm slice thickness, 5:49 min scan time), while borderline differences were noted for T1 SE sequences with the following parameters: 320x320 pixels, 1.5-mm slice thickness, 6:11 min scan time; 320x320 pixels, 4-mm slice thickness, 6:11 min scan time; and 512x512 pixels, 1.5-mm slice thickness, 9:48 min scan time. Borderline differences were also noted when using a FSPGR sequence with 512x512 pixels, a 1.5-mm slice thickness and a 3:36 min scan time.
CONCLUSIONS:FSPGR sequences, regardless of the magnetic resonance imaging parameter combination used, provided accurate measurements. The GRE MPGR sequence using 512x512 pixels, a 1.5-mm slice thickness and a 5:49 min scan time and, to a lesser degree, all tested T1 SE sequences produced suboptimal accuracy when measuring the widest phantom.
KEYWORDS: Cartilage; Dimensional Measurement Accuracy; Magnetic Resonance Imaging; Pediatrics; Phantoms.
McKinney JR, Sussman MS, Moineddin R, Amirabadi A, Rayner T, Doria AS. Accuracy of magnetic resonance imaging for measuring maturing cartilage: A phantom study. Clinics. 2016;71(7):404-411
Received for publication onMarch 6, 2016;First review completed onApril 15, 2016;Accepted for publication onApril 15, 2016
*Corresponding author. E-mail: [email protected]
’ INTRODUCTION
Magnetic resonance imaging (MRI) is a non-invasive, multi-planar imaging modality that enables three-dimensional assess-ments of joints and their surrounding soft tissue structures. MRI is the method of choice for the direct, non-invasive visualization of cartilage (1). MRI-derived cartilage measurements are useful for exploring the effects of modifiable risk factors on articular cartilage prior to clinical disease and for identifying potential preventive strategies. Thus, these measurements are of great
value for monitoring treatment responses in childhood arthritis (2-4). However, the small dimensions of pediatric articular cartilage make the measurement of this tissue using conventional MRI scanners challenging, as such, it is difficult to obtain accuracy in such measurements. While past studies have established that MRI-derived cartilage measurements produce high face validity when using cadaveric and surgical specimens from adults (5-12), to our knowledge, few if any prior studies have determined the criterion validity of MRI-based measure-ments of maturing cartilage using cadaveric or surgical speci-mens or phantoms as reference standards. Currently, most of the available information in the literature relates to observational studies the effects of sex, age, growth, Tanner stage and physical activity on articular cartilage volume (12,13).
Determining the accuracies of different MRI sequences currently being used in clinical practice to assess maturing cartilage in children and adolescents is crucial given that arti-cular cartilage thickness tends to reduce during physiologic
DOI:10.6061/clinics/2016(07)09
Copyright&2016CLINICS–This is an Open Access article distributed under the terms of the Creative Commons License (http://creativecommons.org/licenses/by/ 4.0/) which permits unrestricted use, distribution, and reproduction in any medium or format, provided the original work is properly cited.
growth. Therefore, accurate measurements are required to discriminate minimal arthropathy (which requires treatment) from normal physiologic growth. The goals of the current study were to assess the inter- and intra-reader reliabilities of direct and MRI-acquired measurements of phantoms, to evaluate the accuracies of MRI-derived measurements of pediatric articular cartilage using four different-sized agar phantoms designed to mimic the average dimensions of pediatric cartilage tissue and to determine the combination of MRI sequences and parameters that optimizes accuracy while minimizing scan time.
’ MATERIALS AND METHODS
Phantom Preparation and Measurements
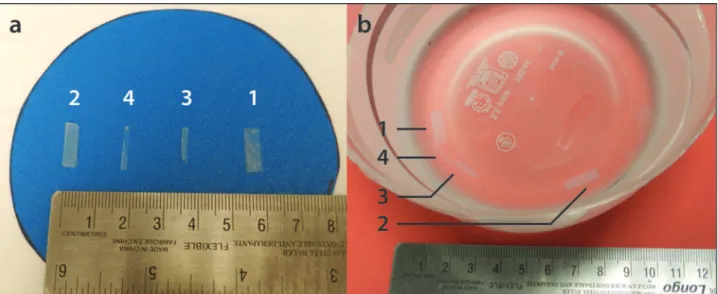
Four rectangular tissue-mimicking phantoms composed of distilled water and 3% by mass agar (high-strength A-6924 Sigma Chemical, St Louis, MO) were prepared as described elsewhere (14) and served as pediatric cartilage samples (Figure 1a). The phantoms consisted of four variably sized agar-based prototypes that were customized to encompass orthogonally intersecting walls with top-view edge dimen-sions in length x width of 14.4 x 5.5 mm (phantom 1), 13.6 x 3.8 mm (phantom 2), 10.6 x 2.1 mm (phantom 3) and 14.6 x 1.3 mm (phantom 4). The phantoms’edge dimensions were independently measured by two readers, a pediatric radi-ologist (A.S.D.) and a clinical research assistant (J.R.M.), using a 15-cm calibrated steel ruler. The dimensions were measured twice by the readers, who were blinded to each other’s results. All dimensions were recorded in mm. These direct measurements served as the reference standards for this study.
MRI Protocol and Interpretation
Imaging was conducted on a 1.5 Tesla Twin Speed MRI scanner (General [GE] Electric Medical Systems, Milwaukee, WI, USA) using an 8-channel volumetric knee coil. Coronal T1-weighted spin-echo (T1 SE) [3 sequences with different parameters], fast spoiled gradient-recalled echo (FSPGR)
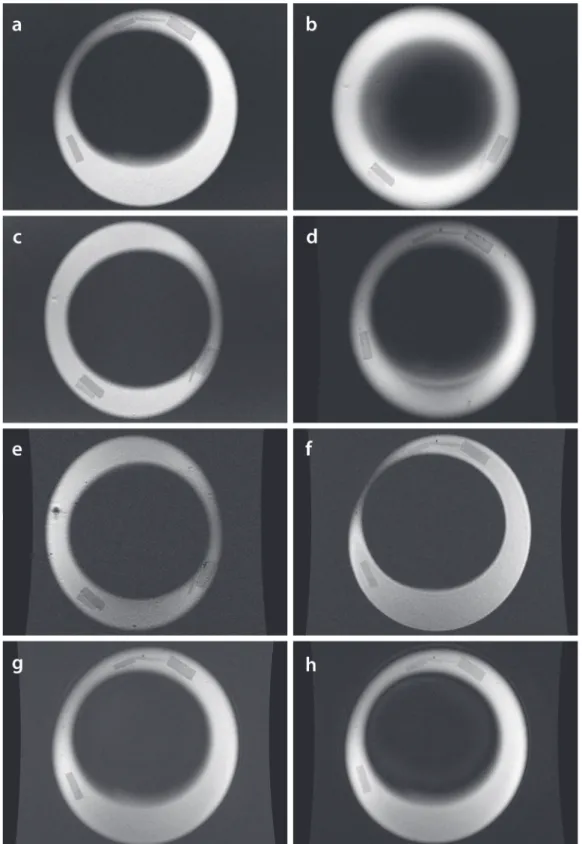
[3 sequences with different parameters] and multiplanar gradient-recalled echo (GRE MPGR) [2 sequences with different parameters] images of the phantoms were obtained while they were embedded in a saline-Magnevistsbath at a concentration of 469 mg/mL [0.5 mmol/mL]) (Figure 1b). Details on the MRI sequences are available in Table 1. The MR images (Figure 2) were independently viewed and measured on a General Electric (GE) Advantage Workstation (software version 4.2, General Electric Medical Systems) by the readers. The MRI data were read twice by each reader in a random order. A two-week interval was used between baseline and repeat measurements to reduce any potential recall effect. The readers were blinded to each other’s measurements as well as to their own baseline sets of measurements.
Signal-to-Noise Ratio Calculation
Signal-to-noise ratios (SNRs) were obtained for the MR images of the phantoms using each sequence, as outlined in Table 1. Using the GE Advantage Workstation, three small circular regions of interest (ROIs) (area = 1 mm2) were positioned within each phantom (Figure 3). Due to the small size and shape variations of the phantoms, one large ROI could not be used. The signal intensity (SI, defined as the mean pixel intensity value in a ROI) was recorded for each ROI (three ROIs per phantom) and averaged to yield the mean SI for each phantom. The noise was defined as the standard deviation (SD) in pixel intensity from three small circular ROIs placed in background air (homogeneous area, free from ghosting artifacts) (15). The SNR was calculated as SNR=0.65*(SI/SD), employing a correction factor of 0.65 for background noise (Rician distribution) (16).
Spatial Resolution
Spatial resolution served as a factor in determining the accuracy of an MRI sequence for measuring maturing cartilage and was calculated as spatial resolution (gross assessment) = field of view/matrix (17).
Statistical Analysis
Intra- and inter-reader reliabilities were examined by calculating differences between the repeated phantom edge measurements within and between readers. The mean and SD of these differences were used to address the issues of variability for the intra- and inter-reader phantom measure-ments. The intra- and inter-reader reliability for the measurements were assessed using coefficients of variations (CVs). The CVs were calculated as CV = (SD/mean) x 100% and expressed as a percentage to further assess the dispersion of data within and between the readers (18-20). CVs p10 indicated an acceptable agreement between the
readers in this study, based on previously published CVs from MRI-based measurements of knee cartilage volumes (21-26).
To determine whether the MRI-derived phantom measure-ments differed significantly from the direct phantom measurements (for different matrices and slice thicknesses), paired t-tests were performed. Bonferroni correction was used to adjust for multiple comparisons, with statistical significance set as alphap.007 for all calculations. Borderline
statistically significant differences were considered for
p-values 4.007 and o.05. All statistical analyses were
performed using SAS, version 9.3 (SAS Institute, Cary, NC).
’ RESULTS
Direct Measurements vs. MRI-Derived Measurements
High inter-reader reliability was observed for both the direct phantom measurements, with CVs ranging from 2.50 to 6.40% (average, 4.40%) and for the MRI measurements, with CVs ranging from 0.61 to 7.75% (average, 3.15%). The intra-reader reliability was also high for both the direct and the MRI-derived measurements, with CVs ranging from 0.00 to 6.40% (average, 3.47%) and 0.00 to 6.49% (average, 1.64%), respectively.
Definite differences were noted between the mean direct measurements and the mean MRI-derived measurements for phantom 1 for the GRE MPGR sequence (512 x 512 pixels, 1.5-mm slice thickness, 5:49 min scan time; difference= 0.61 mm, p=.007). Borderline statistically significant
differ-ences were noted for the TI SE sequdiffer-ences with the following parameters: 320 x 320 pixels, 1.5-mm slice thickness, 6:11 min scan time (difference=0.45 mm, p=.049); 320 x 320 pixels,
4-mm slice thickness, 6:11 min scan time (difference=0.48 mm,p=.02); and 512 x 512 pixels, 1.5-mm slice thickness, 9:48
min scan time (difference=0.48 mm, p=.03). Borderline
significant differences were also noted for the FSPGR sequence with 512 x 512 pixels, a 1.5-mm slice thickness, and a 3:36 min scan time (difference=0.40 mm, p=.048).
No differences were noted between the mean direct measurements and the mean MRI-derived measurements (p-values4.05 for the different MRI sequences) for phantoms
2, 3 or 4 (Table 1).
Signal-to-Noise Ratio & Spatial Resolution
SNR values were calculated for all the MRI sequences under investigation (Table 2). The SNR values were sufficient and ranged from 8.60 to 90.7, with an average of 32.9. The spatial resolutions (gross assessment) of the MRI sequences were appropriate and ranged from 0.16 to 0.47 (Table 3).
’ DISCUSSION
The results of the current study show that FSPGR sequences, regardless of the combination of MRI parameters used and the thickness of the cartilage-mimicking structure under assessment, provide accurate measurements. There-fore, when considering feasibility from the perspective of scanning time, the 0.5-mm slice thickness, 512 x 512 pixel, 3:38 min scan appears to be the most appropriate sequence for imaging maturing cartilage. The 512 x 512 pixel, 1.5-mm slice thickness, 5:49 min GRE MPGR sequence and, to a
Table 1-Magnetic resonance imaging sequence parameters and statistically significant differences (p-values) between the mean direct measurements and the mean MRI measurements (shown in bold).
Pulse sequence T1 SE GRE MPGR FSPGR
MRI parameters
Matrix (pixels) 320x320 320x320 512x512 320x320 512x512 512x512 512x512 1024x1024
Slice thickness (mm) 1.5 4 1.5 4 1.5 1.5 0.5 1.5
NEX 2 2 2 2 2 1 1 1
Scan time (min) 6:11 6:11 9:48 3:40 5:49 3:36 3:38 10:33
TE (ms) 12 12 12 15 15 Min full Min full Min full
TR (ms) 568 568 568 450 450 N/A N/A N/A
Bandwidth (kHz) 31.2 31.2 31.2 15.6 15.6 31.2 31.2 31.3
FOV (mm) 150 150 150 150 150 160 160 160
Dimension 2D 2D 2D 2D 2D 3D 3D 3D
Differences (p-values) in the mean values between the direct measurements and the MRI measure-ments (mm)
Phantom 1
(Min width = 3.0 mm, m.d.e.m. = 9.94 mm)
0.45 (p=0.05)
0.48 (p=0.02)
0.48 (p=0.03)
0.35 (p=0.11)
0.61 (p=0.007)
0.40 (p=0.05)
0.39 (p=0.10)
0.41 (p=0.05)
Phantom 2
(Min width = 2.5 mm, m.d.e.m. = 8.69 mm)
0.25 (p=0.22)
0.25 (p=0.56)
0.31 (p=0.29)
0.05 (p=0.47)
0.42 (p=0.35)
0.19 (p=0.35)
0.32 (p=0.14)
0.23 (p=0.12)
Phantom 3
(Min width = 1.5 mm, m.d.e.m. = 6.38 mm)
0.042 (p=0.83)
0.33 (p=0.27)
0.06 (p=0.20)
-0.017 (p=0.40)
0.008 (p=0.76)
0.09 (p=0.74)
-0.050 (p=0.71)
0.07 (p=0.69)
Phantom 4
(Min width = 0.5 mm, m.d.e.m. = 7.94 mm)
0.20 (p=0.51)
3.12 (p=0.22)
3.17 (p=0.21)
0.11 (p=0.45)
3.19 (p=0.20)
0.16 (p=0.63)
0.41 (p=0.20)
0.26 (p=0.34)
Figure 2 -Coronal MR images generated by various sequences and parameters.
lesser degree, all the T1 SE sequences (regardless of the combination of parameters used) appeared suboptimal for producing accurate measurements of the phantom with the largest width.
To determine the accuracy of an MRI sequence in measuring pediatric articular cartilage, the paradigm of no statistically significant differences (and to a lesser extent no borderline differences) between the mean direct measure-ments and the mean MRI-derived measuremeasure-ments was taken into consideration, in addition to the SNRs, spatial resolu-tions and scan times for each given set of parameters.
Finally, it should be noted that the cartilage layers of a maturing skeleton have a similar thickness to the diameters of the phantoms used in this study (27).
Phantom 1
Differences between the mean direct measurements and the mean MRI-derived measurements were only observed for phantom 1, the phantom with the largest width. This was the case for all MRI sequences (T1 SE, GRE MPGR and FSPGR) employed in this study, regardless of parameter variations. A possible explanation for this is the limitation imposed by the ruler used, which is only precise to 1 mm (±0.5 mm). Therefore, any direct phantom edge
measure-ment that fell between the 1-mm ruler incremeasure-ments was subjective. Given this fact, all the recorded measurements were rounded to the nearest 1-mm increment, resulting in a measurement error of ±0.5 mm. Thus, we hypothesized
that the widths of phantoms 2, 3 and 4 (3.8 mm, 2.1 mm and 1.3 mm, respectively) were too close to the measurement error of ±0.5 mm to allow the readers to obtain accurate
direct measurements. Therefore, because phantom 1 (largest width) was the only sample to provide accurate direct measurements of width, only this phantom was used to evaluate the accuracies of the MRI sequences in quantita-tively maturing cartilage. The p-values, SNRs, spatial
resolutions and scan times associated with phantom 1 are summarized in Table 3.
T1 SE
Despite adequate SNR and spatial resolution, the relatively long scan time (compared to the GRE MPGR and FSPGR sequences) and the borderline differences between the MRI-derived measurements and the reference standard measure-ments observed in this study led us to conclude that using a T1 SE sequence is inappropriate for accurately measuring pediatric articular cartilage in a clinical setting.
GRE MPGR
One of the two GRE MPGR sequences tested in this study (512 x 512 pixels, 1.5-mm slice thickness, 5:49 min scan time) appeared to be inappropriate for accurately measuring thin structures due to the significant differences observed between the MRI-derived measurements and the reference standard measurements. The SNR for this sequence was low (for all four phantoms) compared to all other sequences, with values ranging from 8.6 to 11.7 (average, 10). Therefore, noise may have contributed to poor image quality and thus less accurate MRI-derived measurements. Measurements from the other GRE MPGR sequence tested in this study (320 x 320 pixels, 4.0-mm slice thickness, 3:40 min scan time) demon-strated higher CVs and an overall better SNR than the above-referenced GRE MPGR sequence and could be performed
faster (Table 3). However, this sequence had poorer spatial resolution (0.47 mm). GRE MPGR sequences are routinely used in clinical practice (28-30).
FSPGR
No significant differences were observed between the direct and MRI-derived measurements for any of the tested FSPGR sequences. Despite its good spatial resolution (0.16 mm), the FSPGR sequence using a 1024 x 1024 pixel resolution, 1.5-mm slice thickness and 10:33 min scan time appeared to be inappropriate for accurately measuring maturing cartilage given its low SNRs (range, 12.3-18.0; average, 15.1) and lengthy scan time. The other two FSPGR sequences, both using 512 x 512 pixel matrices, had comparable scan times and spatial resolutions (Table 3). However, the FSPGR sequence using a 512 x 512 pixel resolution, 0.5-mm slice thickness, and 3:36 min scan time had MRI measurements that were borderline statistically significantly different (p=.048) from the reference standard
measurement for phantom 1.
Overall, according to this study, the FSPGR sequence using a 512 x 512 pixel matrix, 0.5-mm slice thickness and 3:38 min scan time appeared to be the most appropriate sequence for accurately measuring the dimensions of pediatric articular cartilage. This sequence had the second shortest scan time compared to the other sequences with similar parameters, making it desirable in a clinical setting. It also had an appropriate SNR and spatial resolution.
cartilage (10). More recent studies have confirmed this conclusion, stating that the use of FLASH at 1.5 T or 3 T remains the standard for quantifying articular cartilage (31-33). In recent years, double-echo steady-state imaging (DESS) with water excitation has gained interest as an alternate imaging modality for assessing cartilage due to its faster acquisition time and lower achievable slice thickness (34-38). However, it should be noted that DESS is still undergoing validation with regard to its ability to accurately measure cartilage dimensions (39). Other promising sequences for the assessment of cartilage include driven equilibrium Fourier transform (DEFT), which displays greater cartilage-to-fluid contrast than FLASH (40), balanced steady-state free precession (bSSFP) or true fast imaging with steady state (FISP) and its variant, fluctuating equilibrium magnetic resonance (FEMR) (41). Lastly, iterative decomposition of water and fat with echo asymmetry and least squares estimation (IDEAL) in combination with bSSFP demonstrates superior SNR, faster acquisition times and better contrast than FLASH (40). Again, it should be emphasized that quantitative cartilage data have not yet been presented with respect to any of the aforementioned sequences (DESS, DEFT, bSSFP/FISP, and IDEAL) (40). At the time of this writing, FLASH remains the MRI sequence of choice for accurately measuring the thickness and volume of maturing cartilage. This is con-cordant with the findings from the current study showing that FSPGR was the most appropriate sequence for accurately measuring pediatric cartilage-mimicking phantoms.
Study Limitations
One limitation of this study was the use of a steel ruler to obtain reference measurements. By using a‘‘regression to the mean’’ approach (42), we expected to reduce human measurement error in this regard. We preferred to use
‘‘human eye’’measurements as opposed to a contact-sensing dimension gage such as a micrometer because the mechan-ical perturbations associated with the use of a micrometer could have damaged the delicate phantoms used in this
study. In addition, we preferred to use paired t-test tests with Bonferroni corrections for multi-testing to compare the test and reference standard measurements rather than other methods that account for unequal variances such as Welch’s method (43). The rationale for this was the fact that Welch’s method is not suitable for paired comparisons and could over-correct the results in a pilot study with a restricted sample size. A limitation inherent in the use of paired t-tests was the assumption that the variances in the distributions of the test measurements and reference standard measurements were equal. As a consequence, one could argue that the results of this study could be unreliable if the variances between the underlying samples varied (43). Another limitation of the study was the fact that the same readers performed measurements of MR images and phantom specimens, which could have prompted recall bias. To avoid such bias, a time interval between reading sessions was established a priori. Finally, although the agar phantoms used in this study may not fully simulate the signal intensity or SNR of maturing cartilage on MRI, it would be extremely challenging to assess the signal intensities of layers of cartilage collected from cadavers of children for ethical reasons and results from animal cadavers would not represent the thickness of maturing cartilage in children.
In conclusion, based on scan time, reference standard comparability and accuracy, FSPGR proved to be the most optimal MRI sequence for measuring maturing cartilage-mimicking phantoms. Further translation of these results into the clinic should be performed to validate them and thus optimize the use of MRI sequences for the assessment of maturing cartilage in the pediatric population.
’ ACKNOWLEDGMENTS
This work was presented as a scientific poster at the 2014 Society of
Pediatric Radiology Scientific Assembly in Washington, D.C. All funding
was derived from internal departmental funds and no external grants were used.
Table 2-Signal-to-noise ratios for the magnetic resonance imaging sequences employed in this study.
T1 SE GRE MPGR FSPGR
Matrix (pixels) 320x320 320x320 512x512 320x320 512x512 512x512 512x512 1024x1024
Slice thickness (mm) 1.5 4 1.5 4 1.5 1.5 0.5 1.5
SNR Phantom 1 44.4 66.5 25.8 35.0 11.7 39.2 21.7 15.4
Phantom 2 38.2 79.8 31.0 44.9 8.6 47.6 22.4 18.0
Phantom 3 27.0 90.7 34.1 19.2 10.0 31.9 21.1 12.3
Phantom 4 33.6 84.9 33.5 23.7 9.7 36.8 20.7 14.5
FSPGRfast spoiled gradient-recalled echo,GRE MPGRmultiplanar gradient-recalled echo,SNRsignal-to-noise ratio,T1 SET1-weighted spin-echo.
Table 3-Summary of factors influencing the appropriateness of different MRI sequences for measuring maturing cartilage using phantom 1.
Pulse sequence T1 SE GRE MPGR FSPGR
Matrix (pixels) 320x320 320x320 512x512 320x320 512x512 512x512 512x512 1024x1024
Slice thickness (mm) 1.5 4 1.5 4 1.5 1.5 0.5 1.5
FOV (mm) 150 150 150 150 150 160 160 160
Scan time (min) 6:11 6:11 9:48 3:40 5:49 3:36 3:38 10:33
Spatial resolution (mm) 0.47 0.47 0.29 0.47 0.29 0.31 0.31 0.16
p-value 0.049 0.020 0.030 0.111 0.007 0.048 0.10 0.051
SNR 44.4 66.5 25.8 35.0 11.7 39.2 21.7 15.4
’ AUTHOR CONTRIBUTIONS
McKinney JR, Sussman MS, Amirabadi A, Rayner T and Doria AS conceived and designed the study. McKinney JR and Doria AS acquired, analyzed and interpreted the data. Moineddin R performed all statistical analyses of the data. McKinney JR drafted the manuscript. All authors critically reviewed the manuscript for important intellectual content and
approved thefinal version for publication.
’ REFERENCES
1. Gougoutas AJ, Wheaton AJ, Borthakur A, Shapiro EM, Kneeland JB, Udupa JK, et al. Cartilage volume quantification via Live Wire segmen-tation. Acad Radiol. 2004;11(12):1389-95, http://dx.doi.org/10.1016/ j.acra.2004.09.003.
2. Wang Y, Wluka AE, Jones G, Ding C, Cicuttini FM. Use magnetic resonance imaging to assess articular cartilage. Ther Adv Musculoskelet Dis. 2012;4(2):77-97, http://dx.doi.org/10.1177/1759720X11431005. 3. Hemke R, Doria AS, Tzaribachev N, Maas M, van der Heijde DM,
van Rossum MA. Selecting magnetic resonance imaging (MRI) outcome measures for juvenile idiopathic arthritis (JIA) clinical trials: first report of the MRI in JIA special interest group. J Rheumatol. 2014;41(2):354-8, http://dx.doi.org/10.3899/jrheum.131081.
4. Miller E, Uleryk E, Doria AS. Evidence-based outcomes of studies addressing diagnostic accuracy of MRI of juvenile idiopathic arthritis. AJR Am J Roentgenol. 2009;192(5):1209-18, http://dx.doi.org/10.2214/AJR. 08.2304.
5. Burgkart R, Glaser C, Hyhlik-Dürr A, Englmeier KH, Reiser M, Eckstein F. Magnetic resonance imaging-based assessment of cartilage loss in severe osteoarthritis: accuracy, precision, and diagnostic value. Arthritis Rheum. 2011;44(9):2072-7, http://dx.doi.org/10.1002/1529-0131(200109) 44:9o2072::AID-ART35743.0.CO;2-3.
6. Cicuttini F, Forbes A, Morris K, Darling S, Bailey M, Stuckey S. Gender dif-ferences in knee cartilage volume as measured by magnetic resonance ima-ging. Osteoarthritis Cartilage. 1999;7(3):265-71, http://dx.doi.org/10.1053/ joca.1998.0200.
7. Peterfy CG, van Dijke CF, Janzen DL, Gluer CC, Namba R, Majumdar S, et al. Quantification of articular cartilage in the knee with pulsed saturation transfer subtraction and fat-suppressed MR imaging: optimization and validation. Radiology. 1994;192(2):485-91, http://dx.doi.org/10.1148/radiology.192.2. 8029420.
8. Dupuy DE, Spillane RM, Rosol MS, Rosenthal DI, Palmer WE, Burke DW, et al. Quantification of articular cartilage in the knee with three-dimensional MR imaging. Acad Radiol. 1996;3(11):919-24, http://dx.doi.org/10.1016/S1076-6332(96)80299-6.
9. Eckstein F, Schnier M, Haubner M, Priebsch J, Glaser C, Englmeier KH, et al. Accuracy of cartilage volume and thickness measurements with magnetic resonance imaging. Clin Orthop Relat Res. 1998;(352):137-48. 10. Sittek H, Eckstein F, Gavazzeni A, Milz S, Kiefer B, Schulte E, et al.
Assessment of normal patellar cartilage volume and thickness using MRI: an analysis of currently available pulse sequences. Skeletal Radiol. 1996; 25(1):55-62, http://dx.doi.org/10.1007/s002560050032.
11. Graichen H, von Eisenhart-Rothe R, Vogl T, Englmeier KH, Eckstein F. Quantitative assessment of cartilage status in osteoarthritis by quantitative magnetic resonance imaging: technical validation for use in analysis of cartilage volume and further morphologic parameters. Arthritis Rheum. 2004;50(3):811-6, http://dx.doi.org/10.1002/art.20191. 12. Jones G, Ding C, Glisson M, Hynes K, Ma D, Cicuttini F. Knee articular
cartilage development in children: a longitudinal study of the effect of sex, growth, body composition, and physical activity. Pediatr Res. 2003; 54(2):230-6, http://dx.doi.org/10.1203/01.PDR.0000072781.93856.E6. 13. Spannow AH, Stenboeg E, Pfeiffer-Jensen M, Fiirgaard B, Haislund M,
Ostergaard M, et al. Ultrasound and MRI measurements of joint cartilage in healthy children: a validation study. Ultraschall Med. 2001;32(Suppl 1): S110-6, http://dx.doi.org/10.1055/s-0029-1245374.
14. Rickey DW, Picot PA, Christopher DA, Fenster A. A wall-less vessel phantom for Doppler ultrasound studies. Ultrasound in Med Biol. 1995; 21(9):1163-76, http://dx.doi.org/10.1016/0301-5629(95)00044-5. 15. McCann AJ, Workman A, McGrath C. A quick and robust method for
measurement of signal-to-noise ratio in MRI. Phys Med Biol. 2013; 58(11):3775-90, http://dx.doi.org/10.1088/0031-9155/58/11/3775. 16. Firbank MJ, Coulthard A, Harrison RM, Williams ED. A comparison of
two methods for measuring the signal to noise ratio on MR images. Phys Med Biol. 1999;44(12):N261-4, http://dx.doi.org/10.1088/0031-9155/44/ 12/403.
17. Nitz WR, Balzer T, Grosu DS. Principles of magnetic resonance. In: Reimer P, Parizel PM, Meaney JFM, Stichnoth FA (eds). Clinical MR imaging: a practical approach. New York: Springer; 2010. p. 1-106. 18. Spannow AH, Pfeiffer-Jensen M, Andersen NT, Herlin T. Inter- and intra
observer variation of ultrasonographic cartilage thickness assessments in
small and large joints in healthy children. Pediatr Rheumatol. 2009;7:12, http://dx.doi.org/10.1186/1546-0096-7-12.
19. Eckstein F, Burstein D, Link TM. Quantitative MRI of cartilage and bone: degenerative changes in osteoarthritis. NMR Biomed. 2006;19(17):822-54, http://dx.doi.org/10.1002/nbm.1063.
20. Blumenkrantz G, Majumdar S. Quantitative magnetic resonance imaging of articular cartilage in osteoarthritis. Eur Cell Mater. 2007;13:76-86. 21. Jaremko JL, Cheng RW, Lambert RG, Habib AF, Ronsky JL. Reliability of
an efficient MRI-based method for estimation of knee cartilage volume using surface registration. Osteoarthritis Cartilage. 2006;14(9):914-22, http://dx.doi.org/10.1016/j.joca.2006.03.004.
22. Eckstein F, Glaser C. Measuring cartilage morphology with quantitative magnetic resonance imaging. Semin Musculoskelet Radiol. 2004;8(4): 329-53, http://dx.doi.org/10.1055/s-2004-861579.
23. Waterton JC, Solloway S, Foster JE, Keen MC, Gandy S, Middleton BJ, et al. Diurnal variation in the femoral articular cartilage of the knee in young adult humans. Magn Reson Med. 2000;43(1):126-32, http://dx.doi.org/ 10.1002/(SICI)1522-2594(200001)43:1o126::AID-MRM1543.0.CO;2-#. 24. Heudorfer L, Hohe J, Faber S, Englmeier KH, Reiser M, Eckstein F.
Precision MRI-based joint surface and cartilage density analysis of the knee joint using rapid water-excitation sequence and semi-automatic segmentation algorithm. Biomed Tech (Berl). 2000;45(11):304-10, http://dx.doi.org/10.1515/bmte.2000.45.11.304.
25. Glaser C, Burgkart R, Kutschera A, Englmeier KH, Reiser M, Eckstein F. Femoro-tibial cartilage metrics from coronal MR image data: technique, test-retest reproducibility, and findings in osteoarthritis. Magn Reson Med. 2003;50(6):1229-36, http://dx.doi.org/10.1002/mrm.10648. 26. Cicuttini FM, Wluka AE, Wang Y, Stuckey SL. Longitudinal study of
changes in tibial and femoral cartilage in knee osteoarthritis. Arthritis Rheum. 2004;50(1):94-7, http://dx.doi.org/10.1002/art.11483.
27. Keshava SN, Gibikote SV, Mohanta A, Poonnoose P, Rayner T, Hillard P, et al. Ultrasound and magnetic resonance imaging of healthy paediatric ankles and knees: a baseline for comparison with haemophilic joints. Hemophilia. 2015;21(3):e210-22, http://dx.doi.org/10.1111/hae.12614. 28. Crema MD, Roemer FW, Marra MD, Burstein D, Gold GE, Eckstein F,
et al. Articular cartilage in the knee: current MR imaging techniques and applications in clinical practice and research. Radiographics. 2011; 31(1):37-62, http://dx.doi.org/10.1148/rg.311105084.
29. Laor T, Chung T, Hoffer FA, Jaramillo D. Musculoskeletal magnetic resonance imaging: how we do it. Pediatr Radiol. 1996;26(10):695-700, http://dx.doi.org/10.1007/BF01383382.
30. Greenspan P. Orthopedic imaging: a practical approach, 5th edn. Philadelphia: Lippincott Williams & Wilkins; 2011.
31. Eckstein F, Cicuttini F, Raynauld JP, Waterton JC, Peterfy C. Magnetic resonance imaging (MRI) of articular cartilage in knee osteoarthritis (OA): morphological assessment. Osteoarthritis Cartilage. 2006;14(Suppl A): A46-75, http://dx.doi.org/10.1016/j.joca.2006.02.026.
32. Gold GE, Burstein D, Dardzinski B, Lang P, Boada F, Mosher T. MRI of articular cartilage in OA: novel pulse sequences and compositional/ functional markers. Osteoarthritis Cartilage. 2006;14(Suppl A):A76-86, http://dx.doi.org/10.1016/j.joca.2006.03.010.
33. Peterfy CG, Gold G, Eckstein F, Cicuttini F, Dardzinski B, Stevens R. MRI protocols for whole-organ assessment of the knee in osteoarthritis. Osteoarthritis Cartilage. 2006;14(Suppl A):A95-111, http://dx.doi.org/10.1016/j.joca.2006.02.029.
34. Eckstein F, Hudelmaier M, Wirth W, Kiefer B, Jackson R, Yu J, et al. Double echo steady state magnetic resonance imaging of knee articular cartilage at 3 Tesla: a pilot study for the Osteoarthritis Initiative. Ann Rheum Dis. 2006; 65(4):433-41, http://dx.doi.org/10.1136/ard.2005.039370.
35. Wirth W, Nevitt M, Hellio Le Graverand MP, Benichou O, Dreher D, Davies RY, et al. Sensitivity to change of cartilage morphometry using coronal FLASH, sagittal DESS, and coronal MPR DESS protocols-comparative data from the Osteoarthritis Initiative (OAI). Osteoarthritis Cartilage. 2010; 18(4):547-54, http://dx.doi.org/10.1016/j.joca.2009.12.003.
36. Hardy PA, Recht MP, Piraino D, Thomasson D. Optimization of a dual echo in the steady state (DESS) free-precession sequence for imaging cartilage. J Magn Reson Imaging. 1996;6(2):329-35, http://dx.doi.org/10.1002/jmri. 1880060212.
37. Eckstein F, Kunz M, Hudelmaier M, Jackson R, Yu J, Eaton CB, et al. Impact of coil design on the contrast-to-noise ratio, precision, and con-sistency of quantitative cartilage morphometry at 3 Tesla: a pilot study for the osteoarthritis initiative. Magn Reson Med. 2007;57(2):448-54, http://dx.doi.org/10.1002/mrm.21146.
38. Eckstein F, Kunz M, Schutzer M, Hudelmaier M, Jackson RD, Yu J, et al. Two year longitudinal change and test-retest-precision of knee cartilage mor-phology in a pilot study for the osteoarthritis initiative. Osteoarthritis Carti-lage. 2007;15(11):1326-32, http://dx.doi.org/10.1016/j.joca.2007.04.007. 39. Eckstein F, Wirth W. Quantitative cartilage imaging in knee osteoarthritis.
Arthritis. 2011. Available from PubMed: http://www.ncbi.nlm.nih.gov/ pubmed/22046518. http://dx.doi.org/10.1155/2011/475684.
Magn Reson Med. 1999;42(4):695-703, http://dx.doi.org/10.1002/(SICI) 1522-2594(199910)42:4o695::AID-MRM1143.0.CO;2-Z.
41. Carballido J, Eckstein F. Quantitative morphological imaging of the knee joint. In: Majumdar S (ed) Advances in MRI of the knee for osteoarthritis. Singapore: World Scientific Publishing Co. Pte. Ltd.; 2010. p. 143-184.
42. Barnett AG, van der Pols JC, Dobson AJ. Regression to the mean: what it is and how to deal with it. Int J Epidemiol. 2005;34(1):215-20, http://dx.doi.org/10.1093/ije/dyh299.
43. Ruxton GD. The unequal variance t-test is an underused alternative to Student’s t-test and the Mann–Whitney U test. Behav Ecol. 2006;