RAPID COMMUNICATION
Amino acids in squamous cell carcinomas and adjacent
normal tissues from patients with larynx and oral
cavity lesions
Izabel de Arruda Leme, Guilherme Vannucchi Portari, Gilberto Joa˜o Padovan, Fla´via Troncon Rosa, Francisco Verı´ssimo de Mello-Filho, Julio Se´rgio Marchini
Faculdade de Medicina de Ribeira˜o Preto, Laborato´rio de Espectrometria de Massas, Ribeira˜o Preto/SP, Brazil.
Email: [email protected] Tel.: 55 16 3602-4560
INTRODUCTION
Cancer patients experience metabolic disturbances that lead to nutritional status imbalance. The metabolic altera-tions of both host and tumor cells are predominantly caused by changes in the glucose metabolism of tumors, higher energy expenditures, decreases in ATP levels and increases in lactic acid production (1,2).
Cellular amino acid contents appear to be essential for tumor growth. Theuer (3) observed that the restriction of tryptophan, threonine, leucine, methionine, phenylalanine, valine and isoleucine contributed to the control of tumor growth in rats. However, host weight was affected by tryptophan, threonine, leucine and methionine restriction. The restriction of phenylalanine and tyrosine also reduced weight, causing a loss of fat and lean body mass and an increase in white cells and neutrophils (4).
Although it has been postulated that tumors utilize more amino acids than normal cells, few studies have compared the proportions of amino acids in tumor cells and paired normal tissues. Thus, the objective of the present study was to compare the amino acid content in malignant and adjacent normal tissues from the same patient.
METHODS
The study protocol was approved by the Ethics Committee of the University Hospital of the School of Medicine of Ribeira˜o Preto, and a signed informed consent form was obtained from all of the study participants. Patients diagnosed with squamous cell carcinoma of the larynx and oral cavity undergoing tumor resection surgery were enrolled in the study. Data collection occurred from August 2006 to July 2007 at the University Hospital, Ribeira˜o Preto, Sa˜o Paulo, Brazil.
Samples were obtained immediately after tumor removal. Macroscopic tumor samples were collected as far as possible from the necrosis area, and normal samples were collected as far as possible from the neoplastic area. Sample collection
was not performed in patients with macroscopically reduced resections. After tissue collection, the samples were weighed (BEL EngineeringTM) and stored at -20
˚
C for amino acid concentration analysis using gas chromatography with a flame ionization detector. These analyses were performed at the Mass Spectrometry Laboratory of the Department of Internal Medicine of the School of Medicine of the University of Sa˜o Paulo at Ribeira˜o Preto.Due to the low quantities of sample tissue tested, amino acid extraction was performed in combination with lipid extraction, using the method of Bligh & Dyer (5). In this process, 50 mg of tissue was homogenized for 5 minutes with 1 mL of chloroform-methanol solution (2:1), and distilled water was added to the solution in a volume that corre-sponded to 20% of the sample volume. The preparation was then once again homogenized for 5 minutes, and the resultant solution was centrifuged at 1000 rpm for 5 minutes to separate the chloroform (lower) and aqueous (upper) phases. Because amino acids are water soluble, the upper phase was used for the free amino acid analysis. This analysis involved chloroformate derivatization (6) and was conducted as described previously (7). Gas chromatography (ShimadzuTM GC–17A) analysis was conducted under the following conditions: injector temperature, 300
˚
C; detector temperature, 320˚
C; oven temperature, 110˚
C, increasing to 320˚
C at 0.5/ minute; column pressure, 60 KPa; and a split ratio of 1:20.The statistical analyses were performed using STATISTICA 8.0 (StatSoft, Inc., Tulsa, OK, USA). The Student’s t-test was used to compare the mean¡SD amino acid concentrations of malignant and normal larynx tissues (Table 1), malignant and normal oral tissues (Table 2), malignant larynx and oral tissues (Table 3), and normal larynx and oral tissues (Table 3). A post-hoc power analysis was performed to assess the data validity and sample size power. A significance level of 0.05 was used throughout this study.
RESULTS
A total of 51 patients were selected for the study. The average age of the study participants was 59¡11 years, and 88% of the studied patients were male. The mean patient weight was 64¡14 kg, and the mean BMI was 24¡5 kg/m2. Among the studied patients, 41% experienced weight loss, 18% experienced increased weight and 41% experienced no weight change.
Tissue samples were collected from 23 patients; eight samples could not be used for amino acid analysis due to
Copyrightß2012CLINICS– This is an Open Access article distributed under
the terms of the Creative Commons Attribution Non-Commercial License (http:// creativecommons.org/licenses/by-nc/3.0/) which permits unrestricted non-commercial use, distribution, and reproduction in any medium, provided the original work is properly cited.
No potential conflict of interest was reported.
CLINICS 2012;67(10):1225-1227 DOI:10.6061/clinics/2012(10)17
low tissue volume. The average weights of the tumor and normal tissue samples from the remaining 15 patients were 417¡323 mg and 304¡207 mg, respectively. The surgical margins of six samples were invaded by the tumor. After excluding these samples, we analyzed six samples of larynx lesions and nine samples from the following sites: the tongue, the floor of the mouth and the lip.
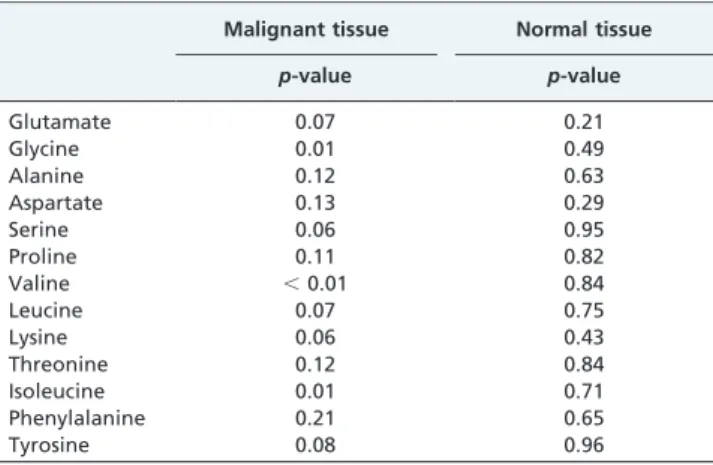
The larynx squamous cell carcinomas possessed higher concentrations of threonine, valine, serine, aspartate, gluta-mate and glycine compared with the surrounding normal tissues (Table 1). By contrast, there were no differences between the malignant and normal oral tissues (Table 2). The malignant oral tissues had lower concentrations of glycine, valine and isoleucine compared with the malignant larynx tissues. No differences were observed between the normal oral and larynx tissues (Table 3).
DISCUSSION
In this study, we examined amino acid concentrations in the malignant tissue of patients diagnosed with squamous
cell carcinoma of the head and neck who were undergoing tumor resection surgery. We used the normal tissue that surrounded sampled tumors as internal controls. The comparison of tissues from the same patient eliminates interference from factors such as diet, liver function, weight loss, and tumor site and stage.
No differences were detected between oral malignant squamous cell carcinomas and surrounding normal tissues (Table 2). Although the tissue type was the same for each tumor that was examined (squamous cells), each of these oral cavity lesions was located at a different site of the tongue, the floor of the mouth or the lip. Thus, the results with respect to oral cavity samples may have been affected by the heterogeneity of the samples.
Higher concentrations of threonine, valine, serine, aspar-tate, glutamate and glycine were detected in the malignant larynx tissue samples than in the surrounding normal tissues (Table 1). According to Hagmu¨ller et al. (8), comparisons of amino acids in tumor and normal tissues should consider that the observed concentrations are indicators of dynamic turnover status. Thus, our results may indicate either that tumor cells have a higher amino acid biosynthesis rate (1) or that tumor cells utilize more amino acids as sources of energy (8). However, given the anaerobic conditions of tumor cells, the oxidation of amino acids in these cells is minimal (2), although it has been well established that all of the areas of a tumor that are highly glycolytic are not necessarily hypoxic (9). The quantification of tricarboxylic acid (TCA) cycle intermediates should better explain these results.
A previousin vitrostudy demonstrated the accumulation
of alanine, aspartate and glutamate in malignant cells in the presence of oxygen; under anaerobic conditions, however, a decrease in alanine levels and an increase in glutamine concentrations was observed (10). The present data indicate that, compared with normal tissues, malignant tissues have higher concentrations of glutamate and aspartate but similar alanine concentrations. Although it is believed that tumor cells consume large amounts of glutamine to replenish the TCA cycle (1), anin vitrostudy in head and neck squamous
cell carcinoma cell lines revealed that glutamine is not the main energy source for these cells (11). No interpretations can be drawn from this study with respect to glutaminolysis because glutamine was not quantified due to its coelution with other amino acids.
Table 1 -The amino acid content (mmol/g) in malignant and normal tissues from patients with squamous cell carcinoma of the larynx.
Means¡SD p-value
Malignant
tissue Normal tissue
Glutamate 6.20¡2.69 1.93¡0.71 0.0071
Glycine 5.55¡1.59 2.55¡0.68 0.0091
Alanine 4.19¡0.52 3.20¡0.94 0.139
Aspartate 2.27¡1.41 0.55¡0.28 0.024*
Serine 1.43¡0.31 0.87¡0.38 0.012*
Proline 1.43¡0.48 0.89¡0.52 0.110
Valine 1.40¡0.18 0.75¡0.44 0.0031
Leucine 1.34¡0.29 0.92¡0.46 0.046
Lysine 1.23¡0.53 0.85¡0.36 0.109
Threonine 0.90¡0.24 0.50¡0.29 0.022*
Isoleucine 0.57¡0.10 0.36¡0.15 0.048
Phenylalanine 0.50¡0.15 0.39¡0.22 0.208
Tyrosine 0.32¡0.09 0.21¡0.09 0.118
SD: standard deviation*Power-test
$70%1Power-test $90%.
Table 2 -Amino acid content (mmol/g) in malignant and normal tissues of patients with squamous cell carcinoma of the oral cavity.
Mean¡SD p-value
Malignant
tissue Normal tissue
Glutamate 2.58¡1.22 3.19¡2.12 0.652
Glycine 2.36¡0.27 3.17¡2.01 0.563
Alanine 2.97¡1.61 3.68¡1.97 0.702
Aspartate 0.82¡0.29 0.87¡0.61 0.921
Serine 0.95¡0.19 0.90¡0.53 0.867
Proline 0.90¡0.06 1.00¡0.79 0.858
Valine 0.75¡0.12 0.82¡0.71 0.870
Leucine 0.90¡0.22 0.79¡0.67 0.733
Lysine 0.47¡0.18 0.64¡0.34 0.272
Threonine 0.63¡0.11 0.46¡0.20 0.348
Isoleucine 0.34¡0.05 0.31¡0.25 0.829
Phenylalanine 0.37¡0.07 0.32¡0.23 0.695
Tyrosine 0.20¡0.03 0.20¡0.13 0.902
SD: standard deviation *Pos hoc power$70%1Power-test$90%.
Table 3 -Amino acid comparison between larynx and oral cavity tissues.
Malignant tissue Normal tissue
p-value p-value
Glutamate 0.07 0.21
Glycine 0.01 0.49
Alanine 0.12 0.63
Aspartate 0.13 0.29
Serine 0.06 0.95
Proline 0.11 0.82
Valine ,0.01 0.84
Leucine 0.07 0.75
Lysine 0.06 0.43
Threonine 0.12 0.84
Isoleucine 0.01 0.71
Phenylalanine 0.21 0.65
Tyrosine 0.08 0.96
Positive p-value: larynx.oral cavity (see Tables 1 and 2 for details). Amino acids in tumor and normal tissues
de Arruda Leme I et al. CLINICS 2012;67(10):1225-1227
Despite the small sample size of this study, post-hoc power analyses produced values higher than 70% for all of the amino acids that differed significantly between squa-mous cell carcinomas and normal larynx tissues (threonine, valine, serine, aspartate, glutamate and glycine). Therefore, we recommend that amino acid statuses should be assessed in cancer patients because the nutrition of tumor cells is influenced by the nutrition of their host. In addition, further studies are needed to assess the effects of attempts to control tumor proliferation by limiting the dietary consumption of certain essential amino acids, such as threonine and valine.
ACKNOWLEDGMENTS
This study was supported by the Fundac¸a˜o de Amparo a Pesquisa do Estado de Sa˜o Paulo (Fapesp - 2006/56010-0).
AUTHOR CONTRIBUTIONS
Leme IA and Rosa FT were responsible for tissue sample collection and analysis, data interpretation, and drafting the manuscript. Portari GV and Padovan GJ analyzed the tissue samples. Mello-Filho FV was the physician responsible for the excision of the malignant tumors and surrounding tissues. Marchini JS supervised this research.
REFERENCES
1. Deberardinis RJ, Sayed N, Ditsworth D, Thompson CB. Brick by brick: metabolism and tumor cell growth. Curr Opin Genet Dev. 2008;18(1):54-61, http://dx.doi.org/10.1016/j.gde.2008.02.003.
2. Bongaerts GP, van Halteren HK, Verhagen CA, Wagener DJ. Cancer cachexia demonstrates the energetic impact of gluconeogenesis in human metabolism. Med Hypotheses. 2006;67(5):1213-22, http://dx.doi.org/ 10.1016/j.mehy.2006.04.048.
3. Theuer RC. Effect of essential amino acid restriction on the growth of female C57BL mice and their implanted BW10232 adenocarcinomas. J Nutr. 1971;101(2):223-32.
4. Harvie MN, Campbell IT, Howell A, Thatcher N. Acceptability and tolerance of a low tyrosine and phenylalanine diet in patients with advanced cancer - a pilot study. J Hum Nutr Diet. 2002;15(3):193-202, http://dx.doi.org/10.1046/j.1365-277X.2002.00365.x.
5. Bligh EG, Dyer WJ. A rapid method of total lipid extraction and purification. Can J Biochem Physiol. 1959;37(8):911-7.
6. Husek P. Gas chromatography of amino acids. J Chromatogr. 1975;113(2):139-230, http://dx.doi.org/10.1016/S0021-9673(00)86962-9. 7. Badawy AA, Morgan CJ, Turner JA. Application of the Phenomenex
EZ:faasttrade mark amino acid analysis kit for rapid gas-chromato-graphic determination of concentrations of plasma tryptophan and its brain uptake competitors. Amino Acids. 2008;34(4):587-96, http:// dx.doi.org/10.1007/s00726-007-0012-7.
8. Hagmuller E, Kollmar HB, Gunther HJ, Holm E, Trede M. Protein metabolism in human colon carcinomas: in vivo investigations using a modified tracer technique with L-[1-13C]leucine. Cancer Res. 1995; 55(5):1160-7.
9. Rajendran JG, Mankoff DA, O’Sullivan F, Peterson LM, Schwartz DL, Conrad EU, et al. Hypoxia and glucose metabolism in malignant tumors: evaluation by [18F]fluoromisonidazole and [18F]fluorodeoxyglucose posi-tron emission tomography imaging. Clin Cancer Res. 2004;10(7):2245-52, http://dx.doi.org/10.1158/1078-0432.CCR-0688-3.
10. Mazzio EA, Smith B, Soliman KF. Evaluation of endogenous acidic metabolic products associated with carbohydrate metabolism in tumor cells. Cell Biol Toxicol. 2010;26(3):177-88, http://dx.doi.org/10.1007/ s10565-009-9138-6.
11. Sandulache VC, Ow TJ, Pickering CR, Frederick MJ, Zhou G, Fokt I, et al. Glucose, not glutamine, is the dominant energy source required for proliferation and survival of head and neck squamous carcinoma cells. Cancer. 2011;117(13):2926-38, http://dx.doi.org/10.1002/cncr.25868.
CLINICS 2012;67(10):1225-1227 Amino acids in tumor and normal tissues
de Arruda Leme I et al.