ABSTRACT
Pattern electroretinography is used to assess the function of the inner retinal la yers, particularly the retinal ganglion cell layer, using a reversing checkerboard or grating pattern that maintains a constant overall mean luminance over time. A normal transient response comprises a positive component of the wave (P50) followed by a longer negative component of the wave (N95). Glaucomatous optic neu-ropathy causes progressive loss of retinal ganglion cells, potentially detectable as abnormalities on examination, particularly in the N95 component. Therefore, pattern electroretinography may be useful in the diagnosis and evaluation of glaucoma. The present article is an updated review of published data regarding the use of pattern electroretinography for the detection of glaucoma-induced retinal changes.
Keywords: Electroretinography; Glaucoma/diagnosis; Ocular hypertension; In-trao cular pressure; Vision ocular
RESUMO
O eletroretinograma de padrão reverso é utilizado para avaliar a função das camadas internas da retina, particularmente a camada de células ganglionares retinianas, utilizando um estímulo em xadrez ou barras alternantes, mantendo constante o nível de contraste total. A resposta transiente normal é constituída por uma onda positiva (P50) seguida de uma onda maior negativa (N95). A neuropatia óptica glaucomatosa causa perda progressiva das células ganglionares da retina, detectável como anor-malidades no exame, especialmente na onda N95. Por isso, o eletroretinograma de padrão reverso pode ser útil no diagnóstico e seguimento de pacientes glaucomatosos. Este artigo é uma revisão atualizada dos dados publicados a respeito da capacidade do eletroretinograma de padrão reverso em detectar alterações retinianas induzidas pelo glaucoma.
Descritores: Eletroretinografia; Glaucoma/diagnóstico; Hipertensão ocular; Pressão intraocular; Visão ocular
INTRODUCTION
Primary open-angle glaucoma (POAG) is likely the most common optic neuropathy and can lead to permanent visual damage if left un-treated(1). Raised intraocular pressure (IOP) is the most significant risk factor for the development and progression of POAG, although not all patients with ocular hypertension (OHT) develop glaucomatous damage(2). Lowering the IOP is currently the only available treatment option(1).
Glaucoma is characterized by chronic retinal ganglion cell (RGC) loss associated with loss of visual function. However, it is widely known that structural abnormalities in RGC and retinal nerve fiber layer (RNFL) may precede the development of visual field (VF) defects in glaucoma. Anatomical studies have documented that VF defects usually develop only after the loss of 30%-50% of ganglion cells(3). To prevent irreversible axonal loss in patients with glaucoma, structural abnormalities should be detected as early as possible; thus, it is im-portant to develop new and more reliable detection methods.
Over the past decade, a number of imaging techniques have been developed to detect early structural damage in glaucoma, including confocal scanning laser ophthalmoscopy (CSLO), scanning laser po-larimetry, and particlularly, optical coherence tomography(4). These techniques can be used to detect and quantify glaucomatous dama-ge in a reproducible manner, and have been shown to be significantly correlated with conventional methods used to assess glaucoma pro-gression, such as standard automated perimetry (SAP) and optic disc stereophotography(5). However, although imaging techniques have become an important tool in the diagnosis of glaucoma, they
occa-sionally fail to identify glaucomatous damage, particularly localized RFNL defects(6) and other structural changes, such as those observed in patients with preperimetric glaucoma. Currently available imaging techniques are more sensitive and specific for advanced glaucoma-tous damage(7).
Electrophysiological methods may also be used to identify early structural and functional damage in glaucoma. Over the past few years, patients with early-stage glaucoma have been evaluated for abnormalities using electrophysiological tests, including different forms of electroretinography (ERG)(8) and visual evoked potential (VEP)(9). On ERG, the amplitude of the photopic negative response, a measure of inner retinal function, may be reduced in early glauco -matous damage(8). Recently, multifocal ERG has been shown to de tect macular dysfunction in POAG(10), suggesting a preganglionic dys function of macular elements in the disease. With regard to VEP, previous studies have shown that a delay in the S-cone response may precede morphological and VF evidence of glaucomatous damage(9). Multifocal VEP has also been used for the objective assessment of glaucomatous VF defects(11). However, despite their ability to detect abnormalities in glaucoma, none of these electrophysiological me-thods directly measure RGC function.
However, RGC function may be estimated using pattern ERG (PERG), a specific form of electroretinography(12). In fact, several stu-dies have shown the ability of PERG to detect structural glaucoma-tous damage (which primarily involves the RGC layer) and have attem pted to correlate these findings with other glaucoma-related functional and morphological abnormalities(13-17). Increasing
eviden-The role of pattern-reversal electroretinography in the diagnosis of glaucoma
Importância do eletroretinograma de padrão reverso no diagnóstico do glaucoma
André CArvAlho Kreuz¹, MAriA KiyoKo oyAMAdA1, MArCelo hAtAnAKA1, Mário luiz ribeiro Monteiro1
Submitted for publication: June 30, 2014 Accepted for publication: November 4, 2014
Study conducted atDepartment of Ophthalmology, Universidade de São Paulo, São Paulo, SP, Brazil.
1 Department of Ophthalmology, Universidade de São Paulo, São Paulo, SP, Brazil.
Corresponding author: André Carvalho Kreuz. Rua da Consolação, 3268/61 - São Paulo, SP - 01416-000 - Brazil - Email: [email protected]
Funding: No specific financial support was available for this study.
ce highlights the importance of PERG amplitude abnormalities for the early diagnosis of glaucoma, especially in patients with pre-perimetric glaucoma(18). The purpose of the present article was to review pre-vious studies evaluating the use of PERG for the detection of glauco-matous damage and its correlation with other methods of structural and functional evaluation.
UNDERSTANDING PERG
O
RIGINOFTHERESPONSEThe first PERG model was described in 1964, when Riggs et al. showed that, in a normal patient, a contrast-reversing pattern could be used to generate a small electroretinographic signal, comprising a positive component (P50) followed by a negative component (N95) (i.e., the transient response). This technique is now referred to as PERG(19). In 1985, Berninger and Schuurmans reported that when temporal frequencies of stimulation are higher than 10 reversals per second (rev/s), the successive waveforms overlap and, therefore, the response assumes a sinusoidal configuration referred to as the steady-state response(20).
Although the exact origin of the PERG response has not been clearly established, a number of experimental studies suggest that it originates from the inner retinal layers, particularly the RGC layer. Be cause damage to the optic nerve results in retrograde degene-ration of the RGC, early studies investigating the origin of the PERG response focused on the effects of optic nerve section. The first such model was described in 1980, when PERG and flash ERG were recor-ded at two different time-points in a subject who had experienced optic nerve section due to an accident. On the first examination, a few days after the accident, both tests were normal; however, three months later, PERG was no longer measurable, while flash ERG was normal(21). Several authors have suggested that the PERG response may originate in the inner retina; indeed, experimental studies using animal models have confirmed the extinction of the PERG response after optic nerve section(22-24) and have related the phenomenon to RGC degeneration, as demonstrated by histological examination. Ho wever, using a similar study design, other researchers observed only partial extinction of the PERG response(25). Johnson found that in monkeys with induced intraocular hypertension, a PERG response was still present after almost all optic nerve fibers had been des-troyed, according to the results of histological examination(26). In a human patient with optic nerve glioma, Harrison et al. detected a PERG response 30 months after surgical transection of the optic ner-ve, although it was significantly reduced(27). Berninger and Arden also reported incomplete extinction of the PERG response three months after optic nerve transection: while the negative component of the wave was non-recordable, the positive component was still present, although it was reduced(28). Based on these findings, it has been sug-gested that the PERG response does not depend on RGC alone; part of the response - most likely the positive component of the wave - may originate from other retinal cells.
Experimental studies in humans have also assessed variations in the PERG response amplitudes at different check sizes (spatial fre-quencies). This phenomenon, called spatial tuning, is a property inhe rent to RGCs. In two studies, the spatial response function of the positive component did not show spatial tuning, as opposed to the amplitude of the negative component(20,29). Based on this finding, a non-ganglion cell component of P50 was proposed, which could, at least in part, be generated distally to the ganglion cells. N95, which displayed spatial tuning, was believed to be contrast-related and, consequently, generated by the RGC [42].
Holder conducted a clinical study to investigate the origin of PERG waves and observed that P50 was more affected than N95 in retinal and macular diseases, and that N95 was more affected than P50 in optic nerve dysfunction, supporting the hypothesis that the negative and positive PERG components have different origins(30).
In a recent experimental study, Viswanathan et al. tested the effects of tetrodoxin (TTX), a drug that blocks the spiking activity of amacrine and ganglion cells. They observed that the effects of TTX on PERG were similar to those observed with experimental glaucoma, sugges-ting that glaucoma-related reduction in the PERG response is due to compromised RGC spiking activity(31). The authors also observed that N95 was eliminated by TTX at higher frequencies, while P50 remained less affected than in experimental glaucoma. Because experimental glaucoma compromises the entire RGC layer and its ability to respond while TTX merely blocks spiking activity, the extinction of P50 in experimental glaucoma suggests an origin in local RGC potentials.
Based on the above-mentioned data, it may be inferred that the negative component is a contrast-related component generated by RGC spiking activity, while the positive component is partly RGC-de-rived and partly generated distally to the ganglion cells by a mecha-nism that is currently unclear(32).
Since the 1980s, many researchers have used PERG to study abnor malities associated with optic nerve disorders, although the re cording techniques used in early research varied considerably from study to study(33,34). This, in part, explains the discrepancies among these early studies. The first attempt to standardize the methodolo-gy occurred in 1984(35); subsequently, in 1998, 2007 and 2012, the In ternational Society for Clinical Electrophysiology of Vision (ISCEV) published guidelines standardizing the PERG methodology.
M
ETHODOLOGYThe present methodology is described in the 2012 ISCEV stan-dard for clinical PERG(36). The retinal cells are stimulated by a pattern of contrast-reversing black and white squares or bars presented as a checkboard or grating on a monitor, while a constant overall mean lu-minance is maintained. The check size presented on the monitor and the reversal rate can be adjusted at the discretion of the investigator. Retinal evoked potentials are recorded with electrodes that do not interfere with pattern clarity, such as gold foil, Dowson-Trick-Litzkow or Hong Kong loops placed on the corneal limbus, over or under the lower lid. Surface reference electrodes are placed in the outer canthus of each eye, and a ground electrode is attached to the forehead.
Because of its small amplitude, the PERG response is highly sus-ceptible to artifacts. Interference from eye movement and blink is common and should be avoided. Pattern clarity and fixation on the fovea are important for reliability of the response measurement. The presence of cataracts, non-corrected refractive errors or reduced cor-neal transparency can affect image contrast and, consequently, the PERG response(37). Degenerative maculopathy, diabetic retinopathy and other retinal diseases can also compromise the quality of the res ponse(38).
T
RANSIENTANDSTEADY-
STATEPERG
RESPONSEThe PERG response consists of small signals, typically approxima-tely 2-8 µV in normal individuals. Two types of PERG responses (tran-sient and steady-state) can be obtained depending of the reversal rate of the patterned stimulus. The transient PERG response, obtained when the reversal rate is <6 rev/s, is expressed as a single, averaged response. The steady-state PERG response, obtained when the rever-sal rate is >8 rev/s(39), represents an overlap of successive waveforms. Normal transient PERG is represented by a small initial negative com-ponent at 35 ms (N35), which is not always visible, followed by a larger positive component at 45-60 ms (P50) and then by a large negative component at 90-100 ms (N95). A comparison of PERG responses according to reversal rate is presented in figure 1.
the steady-state response, the amplitude of the sinusoidal wave can be analyzed using a fast Fourier transform. The implicit time (time to peak) is the time between the onset of the contrast reversal and the peak of the component of interest, while latency is defined as the time between the onset of the contrast reversal and the response.
M
ULTIFOCALPERG (
MFPERG)
Standard PERG detects the collective response of the ganglion cells. However, such a global response is rarely useful to detect patho-logical changes in localized areas of the retina. Because some optic nerve diseases, particularly glaucoma, may present with focal RGC defects in the early stages, interest in methods capable of assessing the function of specific retinal areas is increasing(40,41).
mfPERG can detect responses from specific regions, mainly in the macular area, which is densely populated with RGCs and pregan-glionic elements. The ability to measure bioelectrical responses from localized macular areas could be used to establish a relationship between focal RGC dysfunction and focal defects identified by the examination(42). In an experimental and clinical study, Harrison et al. suggested that mfPERG response originates mainly from inner retinal elements (RGCs), with some contribution from outer retinal cells(42).
The earliest studies described different forms of stimulation of specific areas of the retina(41,43). The basic methodological difference compared with standard PERG is the multifocal stimulus: hexagons or squares displayed on a monitor alternating between black and white in a temporal pattern according to a binary m-sequence. The morphology of the retinal response is similar to full-field PERG.
PERGLA
Developed by Porciatti et al. in 2004(44) primarily for the diagnosis and follow-up of glaucoma patients, PERGLA is another method of
obtaining PERG data. It differs from the classic method by the use of skin electrodes placed on the lower eyelids instead of corneal electrodes and by the use of a vertical grating pattern rather than a checkerboard pattern(44). As with the conventional method, a tem-poral frequency of >8 rev/s (steady-state) and Fourier analysis are used. Because the use of a skin electrode reduces the amplitude of the response, spatial-temporal characteristics of the stimulus that maximize the response amplitude are chosen, and the response com-ponent is isolated from unwanted biological activity (noise). While the amplitude response is lower than that of standard PERG, artifacts due to eye movement are less intrusive. The use of skin electrodes avoids some of the problems associated with corneal electrodes: opti-cal de gradation of pattern stimulus, electrode instability, low patient compliance and dependency on a skilled operator. The objective of the method is to make the standard PERG simpler and more patient- and user-friendly.
As in standard PERG, defocus has a negative impact on PERGLA results(45). In addition, significant variability is observed in PERGLA me-asurements when they are obtained by different operators(45). The use of a single operator reduces variability(46), and PERGLA measurements have been shown to be satisfactorily reproducible(47).
PERG STUDIES IN GLAUCOMA
Since the first description of PERG abnormalities in glaucoma in 1982(48), several studies describing changes in amplitude and latency have been published, with correlations to RGC dysfunction seconda-ry to primaseconda-ry glaucoma, congenital glaucoma(49) or OHT.
A
BNORMALITIESINPERG
AMPLITUDEA large number of studies have demonstrated that glaucomatous damage is associated with a reduction in PERG response amplitude.
In 1983, Wanger and Persson submitted 11 patients with unilateral glaucoma to PERG and observed a significant reduction in amplitude in 10 glaucomatous eyes compared with the fellow eye(14). Howe and Mitchell studied 17 patients with unilateral glaucoma and reported that both P50 and N95 were reduced compared with the contrala-teral eye(28), consistent with the findings of other authors(33,50). When studying the involvement of specific waves in glaucoma, Weinstein et al. and Ohta et al. observed a more pronounced reduction in N95 than in P50(51,52). Few studies have demonstrated reductions in P50(30); in most studies, N95 was the most affected component, supporting the notion that the negative component is more closely associated with RGC function.
In view of the increasing awareness of the relevance of PERG abnormalities to the diagnosis of glaucoma, the role of elevated IOP in PERG response has been extensively investigated. Wanger and Persson submitted seven patients with unilateral OHT to PERG and found reduced amplitudes in four cases(53). In addition, experimental studies have investigated whether elevated IOP can affect PERG res-ponse in the absence of glaucomatous damage. Marx et al. induced OHT in one eye of five primates by applying lasers to the trabecular meshwork, and recorded PERG before and after laser application(54). The authors observed a progressive PERG amplitude reduction throughout the follow-up period, with three monkeys exhibiting compromised PERG amplitudes before developing clinically signifi-cant cupping, supporting the hypothesis that OHT in humans could affect PERG amplitude before the emergence of glaucomatous da-mage. Johnson et al. also observed reduced amplitudes in monkeys with artificially elevated IOP, and correlated this reduction with RGC damage on histological examination(26). In an attempt to explain the reduction in PERG response caused by high IOP, Siliprandi et al. pro-posed that amplitudes decrease in acute intraocular hypertension secondary to reduction in eye perfusion pressure and retinal blood supply(55). The majority of researchers have reported reductions in PERG amplitude associated with elevated IOP, although there are exceptions(26). The mechanism appears to involve the absence of acti vity secondary to RGC loss, reduced activity of viable RGC or a combination of these factors. However, it is important to consider that in such experimental studies, IOP elevation is typically very high and induced in an acute manner, which is considerably different from the situation that is typically observed in glaucoma patients. The fact that reductions in PERG amplitude precede optic disk damage suggests the existence of dysfunction in RGC prior to apoptosis. This has been supported by Banitt et al., who reported abnormalities in PERG amplitude preceding the development of optic nerve RNFL thinning detected by optical coherence tomography (OCT) in glau-coma suspects(56).
Based on the observed correlation between high IOP and redu-ced PERG response, likely as a result of RGC dysfunction, Feghali et al. demonstrated that, in rabbits with low PERG amplitude associated with high IOP, the amplitude was immediately normalized when the IOP was lowered(57). Other studies have evaluated the effect of medically or surgically reduced IOP on PERG response in humans(58-60). After following OHT patients treated with timolol as well as a control group receiving placebo for six years, Nesher et al. observed a signi-ficant correlation between IOP levels and steady-state PERG ampli-tude(58). Spadea et al. observed no recovery of the PERG amplitude trabaculectomy was performed on eyes with advanced glaucoma(59); however, other authors reported that the PERG response could be restored after pharmacologically induced IOP reduction in low- and high-tension glaucomatous eyes, even in the presence of early VF de fects(60), suggesting that PERG reduction is related not only to RGC loss, but also to RGC dysfunction. Elevated IOP has an influence on this dysfunction in patients with OHT and glaucoma; therefore, con-trolling IOP is likely important to the re-establishment of normal RGC function in patients with non-advanced glaucoma.
The response amplitude may be compromised in OHT, but not all eyes with OHT have reduced amplitude(61). Thus, studies have been
conducted to evaluate the risk of OHT eyes developing glaucoma, depending on the presence or absence of a reduced response am-plitude. A longitudinal study showed that one of 15 eyes with OHT with reduced PERG amplitude developed glaucomatous VF defects after three years(62). Pfeiffer followed 29 eyes with OHT for up to three years: five of 12 eyes with abnormal baseline PERG developed glau-comatous field defects, but no defects were observed among eyes with normal PERG (n=18)(63). In a recent study involving 120 eyes of OHT patients followed for 10 years, glaucoma was detected by de-creased PERG amplitudes four years before VF changes occurred(64). These studies suggest that the presence of reduced PERG amplitudes in patients with OHT and in glaucoma suspects may be a predictor of glaucoma.
Another study involving glaucoma suspects examined the pre-dictive value of PERG abnormalities for developing VF defects. The positive and negative predictive values were 69% and 80%, respecti-vely, and N95 had the best predictive value(65). In addition, Bayer and Erb observed that an abnormal N95 amplitude could identify 88% of pre-perimetric glaucomatous eyes before the development of VF loss(66).
Based on the frequently observed association between glaucoma and reduced PERG amplitudes, some researchers have tested diffe-rent check sizes and reversal rates in order to evaluate the sensitivity of the method to detect glaucoma. The response was found to be frequency-dependent in glaucoma (the higher the frequency, the more strongly related)(16,67). The steady-state response at 16 rev/s was relatively more affected than the transient response when comparing responses in the same individual(16); however, rates >18 rev/s could not distinguish normal patients from glaucomatous patients(68). Most studies have demonstrated that steady-state PERG with a reversal rate between 10 and 20 rev/s yields the greatest sensitivity for the detection of glaucomatous damage(16,67,68).
The detection of PERG amplitude reduction also depends on check size(69-71). When large checks (16°) are used, the PERG response is relatively preserved in early glaucoma and reduced in advanced glaucoma(70); however, when small checks (0.8°) are used, the res-ponse is compromised in both early and advanced glaucoma(26,70). This indicates loss of spatial tuning (a characteristic of RGC) with the progression of glaucomatous damage. However, Trick noticed that when very small checks (<0.5°) were used, measurements were no longer meaningful(67). Likewise, in an experimental study, Marx et al. induced OHT in three monkeys and observed that, in the absence of optic nerve cupping, the PERG response obtained with small checks was compromised earlier compared with the response obtained with large checks(71).
Studies have also been performed to investigate the effect of medications on the PERG response in glaucoma. In a recent clinical trial involving patients with glaucoma, the use of antioxidants partly prevented PERG amplitude reduction, suggesting a favorable influen-ce on RGC function(72).
However, the results of these studies may have been influenced by a number of confounding factors. For example, aging is associa-ted with natural RGC loss and, consequently, a natural reduction in amplitude response(73). It is, therefore, important to use age-matched controls in such analyses. Second, the presence of diurnal(74) and in-traindividual variability in IOP during the day may interfere with the PERG response and compromise interpretation(75). Whenever possi-ble, PERG should be measured at the same time of the day to improve comparability. Third, when Jacobi et al. investigated the questions of reproducibility and intraindividual variability, they found a positive correlation between right and left eyes but no correlation between measurements made at seven-day intervals(75). Although this was not suggested by the authors, the difference may be partially explained by variability in IOP. If so, this could interfere with the follow-up analysis of glaucoma patients.
inte-resting because it reduces the problem of populational variability of absolute amplitudes and is not affected by aging(41). Watanabe et al. were among the first to use ratios in a study comparing PERG ampli-tudes of the central and paracentral ring areas(40).
In normal eyes, amplitudes obtained with 0.8° and 16° checks are closely correlated, but this correlation is compromised in early glaucoma: initially, a reduction is observed for amplitudes measured with small checks (0.8°); later, changes become detectable with large checks (16°) as well. Because normal patients are likely to display a high amplitude with both small and large checks (0.8° and 16°), in-terindividual variability(75) may interfere with comparisons between groups. To circumvent this, a PERG ratio was created (steady-state PERG amplitude with 0.8° checks/PERG amplitude with 16° checks) using a frequency of 16 rev/s(74,76). Normalization using the response obtained with large checks may reduce interindividual variability. A longitudinal study following 54 eyes with elevated IOP for 10 years suggested that the PERG ratio was a better biomarker than the PERG amplitude for the detection of glaucoma prior to the emergence of VF defects(76).
It is important to remember that in advanced cases of glaucoma, the denominator may be so small that the PERG ratio becomes unre-liable(76). Interestingly, dioptrical defocus and wide-angle scattering, as observed in patients with cataracts, affect the PERG ratio in the same pattern as glaucoma, compromising the PERG response to 0.8° checks but not to 16° checks(70,77). This may compromise the interpre-tation of PERG results, especially because most glaucoma patients exhibit media opacities, even in the early stages.
Another alternative to overcome some of the above-mentioned difficulties, especially those related to eye movement and blinking during acquisition, is the use of PERGLA. According to Ventura, PERG results were abnormal in at least one of the outcome measures in 69% of patients with early manifest glaucoma(15). This finding is sup-ported by other studies(78,79). Using PERGLA, Sehi et al. evaluated the effect of lowering IOP in glaucoma patients with reduced amplitudes and concluded that amplitudes could be improved by trabeculec-tomy(80), but not by pharmacological treatment(81). The difference may lie in the level of IOP reduction: in the first study, IOP was reduced from 19 mmHg to 10 mmHg, while in the second study, the reduction was only 20%.
A
BNORMALITIESINLATENCYUnlike amplitude, little attention has been devoted to the matter of delay in the time of onset of response. Ringens and Parisi observed a delay in the PERG response in glaucoma patients(50,82) and Komata found a prolonged P50 peak time(83). With regard to OHT, Arai et al. reported an elongated latency of P50(62) and Marx et al. reported a delay in mean PERG latency(84). Similar to amplitude, latency is known to increase with age(85). In a recent study, Jafarzadehpour et al. also reported N95 latency delay in glaucoma suspects and patients with early glaucoma(86). Overall, only a small number of authors have re-ported abnormalities in latency.
A
BNORMALITIESINMFPERG
When introduced, mfPERG was expected to enable the evalua-tion of the spatial extent of glaucoma-related reducevalua-tion in PERG amplitude(87,88). The technique has already been shown to correlate well with OCT findings for VF defects and RGC defects, such as in hemianopia due to chiasmal compression(89). However, in three major studies involving glaucoma patients, mfPERG did not reflect localized ganglion cell loss(90-92). Stiefelmeyer et al. observed decreased P50 and N95 values, mainly in the central region, but failed to establish a correlation with VF defects(92). The other two studies reported similar results, suggesting that PERG is diffusely compromised in glaucoma and that current mfPERG technology is of little or no use in the de-tection of localized VF defects in this patient population.
CORRELATION BETWEEN PERG AND OTHER METHODS IN THE EVALUATION OF STRUCTURAL ABNORMALITIES IN GLAUCOMA
Several articles have investigated the correlation between PERG and other methods in the detection of structural damage of the optic nerve and the RFNL. With regard to fundoscopic abnormalities, Drance et al. was one of the first to correlate PERG and morphological findings of glaucomatous optic nerve damage(93). Marx et al. reported that increasing cupping of the optic disc correlated well with pro-gressive amplitude reduction at IOP levels >40 mmHg(54). Ventura et al. observed that the presence of fundoscopic optic nerve damage (vertical cup/disc ratio >0.5; cup/disc asymmetry ≥0.2; notching or disc hemorrhage) and reduced PERGLA amplitude could predict the later progression of glaucomatous defects(15). With regard to structu-ral analysis based on complementary examinations, a weak but significant correlation has been reported between PERG and CSLO with regard to the shape of the optic disc(94).
PERG amplitudes and RFNL thickness abnormalities assessed by OCT and scanning laser polarimetry (GDx) have also been correlated. Parisi et al. observed that OCT-measured overall and temporal optic nerve RFNL thickness was significantly correlated with P50 implicit time delay and with P50-N95 peak-to-peak(17). However, Ventura et al. observed a weak correlation in patients with early glaucoma: reduc-tions in PERG amplitude were more evident than expected based on the amount of RGC loss estimated by OCT, suggesting that although the RGC population was not greatly reduced, the cells had become severely dysfunctional(15). When comparing the results obtained by OCT and PERG in OHT and early glaucoma patients, Falsini et al. obser-ved a structure-function relationship in the glaucoma group that was absent in the OHT group(95), suggesting that, in the early stage of the disease, loss of RGC function is detectable by PERG before it becomes evident on OCT. Using GDx analysis, Toffoli et al. observed a good correlation between RNFL thickness and PERG amplitude measurements(96). This discrepancy may be explained by the fact that PERG reductions may be associated with either dysfunction or loss of RGC, whereas on OCT RNFL is only affected in the latter case.
CORRELATION BETWEEN PERG AND OTHER METHODS IN THE EVALUATION OF FUNCTIONAL ABNORMALITIES IN GLAUCOMA
PERG can reveal impairment of RGC function before it is detecta-ble by conventional perimetry. A clear central area of a VF with peripheral glaucomatous defect may display reduced amplitude(18). In a study by Ventura et al., 52% of pre-perimetric glaucoma patients (abnormal disc with normal SAP) exhibited PERG abnormalities(15).
A significant correlation between PERG amplitudes and global VF indices (mean deviation [MD] and corrected pattern standard deviation) has been reported(97). With regard to MD, PERG amplitude deteriorates as VF defect advances(18). Whereas Garway-Heath et al. observed a linear correlation between PERG amplitude and differen-tial light sensitivity in the VF (expressed on a logarithmic dB scale)(98), Hood et al. observed no correlation between N95 amplitude and N95:P50 ratio with regard to MD(99) and reported that 25% of patients with abnormal VF had normal PERG responses. The absence of a linear correlation between PERG amplitude values was explained by the wide range of amplitude among normal eyes and the fact that, even in advanced glaucoma, PERG is never reduced to zero due to the presence of noise.
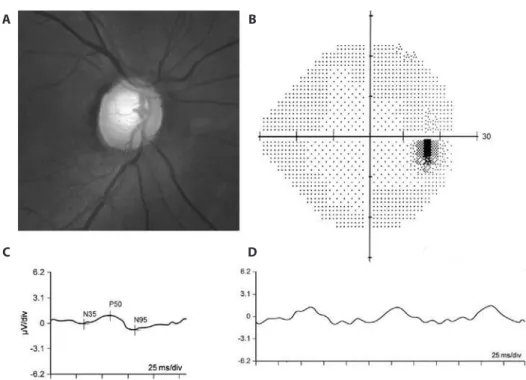
Figure 2. Representative example of an eye with pre-perimetric glaucoma and reduced pattern electroretinogram (PERG) responses. A) Fundus photograph showing glaucomatous cupping; B) Normal standard automated perimetry (24-2 SITA Standard test); C) Reduced transient PERG responses (P50= 0,95µV; N95= 1,65µV); D) Reduced steady-state PERG amplitude response (1.78 µV).
while the PERG response is normal in a glaucoma patient with VF de -fect, perimetry detects peripheral focal field loss in a patient with near-nor mal RGC function(100).
Although a correlation between glaucomatous VF defects and reduced PERG amplitude in the corresponding hemifield has already been reported(41), it is important to remember that standard PERG is not appropriate for the detection of focal glaucomatous damage(102).
PERG has also been compared with SAP and FDT with regard to diagnostic accuracy in glaucoma patients, and was found to be simi-lar to the former and somewhat inferior to the latter(103).
CONCLUSIONS
Based on our review of current data, pattern electroretinography appears to be a good option for detecting RGC dysfunction in glauco-ma patients with or without VF loss. However, some methodological aspects may interfere with routine use, such as the technical difficulty in obtaining data, and certain factors and conditions prevalent in glaucoma patients, including advanced age, media opacities and associated retinal diseases. Thus, further studies and technical deve-lopments are necessary to improve the ability of PERG technology to detect glaucoma, especially early-stage disease, in patients with mild or absent VF defects.
REFERENCES
1. Weinreb RN, Khaw PT. Primary open-angle glaucoma. Lancet. 2004;363(9422):1711-20. 2. Keltner JL, Johnson CA, Anderson DR, Levine RA, Fan J, Cello KE, et al. The association between glaucomatous visual fields and optic nerve head features in the Ocular Hypertension Treatment Study. Ophthalmology. 2006;113(9):1603-12.
3. Harwerth RS, Carter-Dawson L, Shen F, Smith EL, 3rd, Crawford ML. Ganglion cell losses underlying visual field defects from experimental glaucoma. Invest Ophthalmol Vis Sci. 1999;40(10):2242-50.
4. Chen TC, Zeng A, Sun W, Mujat M, de Boer JF. Spectral domain optical coherence tomography and glaucoma. Int Ophthalmol Clin. 2008;48(4):29-45.
5. Mansouri K, Leite MT, Medeiros FA, Leung CK, Weinreb RN. Assessment of rates of structural change in glaucoma using imaging technologies. Eye (Lond). 2011;25(3): 269-77.
6. Jeoung JW, Park KH. Comparison of Cirrus OCT and Stratus OCT on the ability to de tect localized retinal nerve fiber layer defects in preperimetric glaucoma. Invest Oph thalmol Vis Sci. 2010;51(2):938-45.
7. Leite MT, Zangwill LM, Weinreb RN, Rao HL, Alencar LM, Sample PA, et al. Effect of di sease severity on the performance of Cirrus spectral-domain OCT for glaucoma diagnosis. Invest Ophthalmol Vis Sci. 2010;51(8):4104-9.
8. Viswanathan S, Frishman LJ, Robson JG, Walters JW. The photopic negative response of the flash electroretinogram in primary open angle glaucoma. Invest Ophthalmol Vis Sci. 2001;42(2):514-22.
9. Korth MJ, Junemann AM, Horn FK, Bergua A, Cursiefen C, Velten I, et al. [Synopsis of various electrophysiological tests in early glaucoma diagnosis-temporal and spa tiotemporal contrast sensitivity, light- and color-contrast pattern-reversal electro-retinogram, blue-yellow VEP]. Klin Monbl Augenheilkd. 2000;216(6):360-8. 10. Parisi V, Ziccardi L, Centofanti M, Tanga L, Gallinaro G, Falsini B, et al. Macular function
in eyes with open-angle glaucoma evaluated by multifocal electroretinogram. Invest Ophthalmol Vis Sci. 2012;53(11):6973-80.
11. Hood DC, Thienprasiddhi P, Greenstein VC, Winn BJ, Ohri N, Liebmann JM, et al. De -tecting early to mild glaucomatous damage: a comparison of the multifocal VEP and automated perimetry. Invest Ophthalmol Vis Sci. 2004;45(2):492-8.
12. Holder GE, Brigell MG, Hawlina M, Meigen T, Vaegan, Bach M. ISCEV standard for cli-nical pattern electroretinography-2007 update. Doc Ophthalmol. 2007;114(3):111-6. 13. Bach M, Hoffmann MB. Update on the pattern electroretinogram in glaucoma. Optom
Vis Sci. 2008;85(6):386-95.
14. Wanger P, Persson HE. Pattern-reversal electroretinograms in unilateral glaucoma. Invest Ophthalmol Vis Sci. 1983;24(6):749-53.
15. Ventura LM, Porciatti V, Ishida K, Feuer WJ, Parrish RK, 2nd. Pattern electroretinogram abnormality and glaucoma. Ophthalmology. 2005;112(1):10-9.
16. Bach M, Speidel-Fiaux A. Pattern electroretinogram in glaucoma and ocular hyper-tension. Doc Ophthalmol. 1989;73(2):173-81.
17. Parisi V, Manni G, Centofanti M, Gandolfi SA, Olzi D, Bucci MG. Correlation between optical coherence tomography, pattern electroretinogram, and visual evoked poten-tials in open-angle glaucoma patients. Ophthalmology. 2001;108(5):905-12. 18. Bach M, Sulimma F, Gerling J. Little correlation of the pattern electroretinogram (PERG)
and visual field measures in early glaucoma. Doc Ophthalmol. 1997;94(3):253-63. 19. Riggs LA, Johnson EP, Schick AM. Electrical Responses of the Human Eye to Moving
Stimulus Patterns. Science. 1964;144(3618):567.
20. Berninger T, Schuurmans RP. Spatial tuning of the pattern ERG across temporal fre -quency. Doc Ophthalmol. 1985;61(1):17-25.
21. Groneberg A, Teping C. Topodiagnostik von Sehstörungen durch Ableitung retinaler und kortikaler Antworten auf Umkehr Kontrastmuster. Ber Zusammenkunft Dtsch Ophthalmol Ges. 1980;77:409-15.
A B
22. Maffei L, Fiorentini A, Bisti S, Hollander H. Pattern ERG in the monkey after section of the optic nerve. Exp Brain Res. 1985;59(2):423-5.
23. Hollander H, Bisti S, Maffei L, Hebel R. Electroretinographic responses and retrograde changes of retinal morphology after intracranial optic nerve section. A quantitative analysis in the cat. Exp Brain Res. 1984;55(3):483-93.
24. Mafei L, Fiorentini A. Electroretinographic responses to alternating gratings before and after section of the optic nerve. Science. 1981;211(4485):953-5.
25. Blondeau P, Lamarche J, Lafond G, Brunette JR. Pattern electroretinogram and optic nerve section in pigeons. Curr Eye Res. 1987;6(6):747-56.
26. Johnson MA, Drum BA, Quigley HA, Sanchez RM, Dunkelberger GR. Pattern-evoked potentials and optic nerve fiber loss in monocular laser-induced glaucoma. Invest Ophthalmol Vis Sci. 1989;30(5):897-907.
27. Harrison JM, O’Connor PS, Young RS, Kincaid M, Bentley R. The pattern ERG in man following surgical resection of the optic nerve. Invest Ophthalmol Vis Sci. 1987;28(3): 492-9.
28. Berninger TA, Arden GB. The pattern electroretinogram. Eye (Lond). 1988;2 Suppl: S257-83.
29. Trick GL, Wintermeyer DH. Spatial and temporal frequency tuning of pattern-reversal retinal potentials. Invest Ophthalmol Vis Sci. 1982;23(6):774-9.
30. Holder GE. Significance of abnormal pattern electroretinography in anterior visual pathway dysfunction. Br J Ophthalmol. 1987;71(3):166-71.
31. Viswanathan S, Frishman LJ, Robson JG. The uniform field and pattern ERG in maca-ques with experimental glaucoma: removal of spiking activity. Invest Ophthalmol Vis Sci. 2000;41(9):2797-810.
32. Holder GE. Pattern electroretinography (PERG) and an integrated approach to visual pathway diagnosis. Prog Retin Eye Res. 2001;20(4):531-61.
33. Papst N, Bopp M, Schnaudigel OE. Pattern electroretinogram and visually evoked cortical potentials in glaucoma. Graefes Arch Clin Exp Ophthalmol. 1984;222(1):29-33. 34. Bobak P, Bodis-Wollner I, Harnois C, Maffei L, Mylin L, Podos S, et al. Pattern electro-retinograms and visual-evoked potentials in glaucoma and multiple sclerosis. Am J Oph thalmol. 1983;96(1):72-83.
35. Ringens PJ, van Lith GH, Vijfvinkel-Bruinenga S. A standardized method for recording pattern-elicited electroretinograms in normal human subjects. Ophthalmologica. 1984; 188(2):106-10.
36. Bach M, Brigell MG, Hawlina M, Holder GE, Johnson MA, McCulloch DL, et al. ISCEV standard for clinical pattern electroretinography (PERG): 2012 update. Doc Ophthalmol. 2013;126(1):1-7.
37. Bach M, Mathieu M. Different effect of dioptric defocus vs. light scatter on the pattern electroretinogram (PERG). Doc Ophthalmol. 2004;108(1):99-106.
38. Ventura LM, Golubev I, Feuer WJ, Porciatti V. The PERG in diabetic glaucoma suspects with no evidence of retinopathy. J Glaucoma. 2010;19(4):243-7.
39. Bach M, Hawlina M, Holder GE, Marmor MF, Meigen T, Vaegan, et al. Standard for pattern electroretinography. International Society for Clinical Electrophysiology of Vision. Doc Ophthalmol. 2000;101(1):11-8.
40. Watanabe I, Iijima H, Tsukahara S. The pattern electroretinogram in glaucoma: an evaluation by relative amplitude from the Bjerrum area. Br J Ophthalmol. 1989;73(2): 131-5.
41. Graham SL, Wong VA, Drance SM, Mikelberg FS. Pattern electroretinograms from hemifields in normal subjects and patients with glaucoma. Invest Ophthalmol Vis Sci. 1994;35(9):3347-56.
42. Harrison WW, Viswanathan S, Malinovsky VE. Multifocal pattern electroretinogram: cellular origins and clinical implications. Optom Vis Sci. 2006;83(7):473-85. 43. Horn F, Mardin C, Korth M, Martus P. Quadrant pattern ERG with SLO stimulation in
nor-mals and glaucoma patients. Graefes Arch Clin Exp Ophthalmol. 1996;234 Suppl 1:S174-9. 44. Porciatti V, Ventura LM. Normative data for a user-friendly paradigm for pattern
electroretinogram recording. Ophthalmology. 2004;111(1):161-8.
45. Vizzeri G, Tafreshi A, Weinreb RN, Bowd C. Effect of operator and optical defocus on the variability of pattern electroretinogram optimized for glaucoma detection (PERGLA). J Glaucoma. 2010;19(2):77-82.
46. Bowd C, Tafreshi A, Vizzeri G, Zangwill LM, Sample PA, Weinreb RN. Repeatability of pattern electroretinogram measurements using a new paradigm optimized for glau-coma detection. J Glauglau-coma. 2009;18(6):437-42.
47. Fredette MJ, Anderson DR, Porciatti V, Feuer W. Reproducibility of pattern electrore-tinogram in glaucoma patients with a range of severity of disease with the new glau coma paradigm. Ophthalmology. 2008;115(6):957-63.
48. May JG, Ralston JV, Reed JL, Van Dyk HJ. Loss in pattern-elicited electroretinograms in optic nerve dysfunction. Am J Ophthalmol. 1982;93(4):418-22.
49. Roy MS, Barsoum-Homsy M, Hanna N, Chevrette L, Trick GL. Pattern electroretinogram and spatial contrast sensitivity in primary congenital glaucoma. Ophthalmology. 1997;104(12):2136-42.
50. Ringens PJ, Vijfvinkel-Bruinenga S, van Lith GH. The pattern-elicited electroretinogram. I. A tool in the early detection of glaucoma? Ophthalmologica. 1986;192(3):171-5. 51. Weinstein GW, Arden GB, Hitchings RA, Ryan S, Calthorpe CM, Odom JV. The pattern
electroretinogram (PERG) in ocular hypertension and glaucoma. Arch Ophthalmol. 1988;106(7):923-8.
52. Ohta H, Tamura T, Kawasaki K, Yonemura D. [Negative wave in human pattern ERG and its suppression in glaucoma]. Nihon Ganka Gakkai Zasshi. 1986;90(6):882-7.
53. Wanger P, Persson HE. Pattern-reversal electroretinograms in ocular hypertension. Doc Ophthalmol. 1985;61(1):27-31.
54. Marx MS, Podos SM, Bodis-Wollner I, Howard-Williams JR, Siegel MJ, Teitelbaum CS, et al. Flash and pattern electroretinograms in normal and laser-induced glaucomatous primate eyes. Invest Ophthalmol Vis Sci. 1986;27(3):378-86.
55. Siliprandi R, Bucci MG, Canella R, Carmignoto G. Flash and pattern electroretinograms during and after acute intraocular pressure elevation in cats. Invest Ophthalmol Vis Sci. 1988;29(4):558-65.
56. Banitt MR, Ventura LM, Feuer WJ, Savatovsky E, Luna G, Shif O, et al. Progressive loss of retinal ganglion cell function precedes structural loss by several years in glaucoma suspects. Invest Ophthalmol Vis Sci. 2013;54(3):2346-52.
57. Feghali JG, Jin JC, Odom JV. Effect of short-term intraocular pressure elevation on the rabbit electroretinogram. Invest Ophthalmol Vis Sci. 1991;32(8):2184-9.
58. Nesher R, Trick GL, Kass MA, Gordon MO. Steady-state pattern electroretinogram follo-wing long term unilateral administration of timolol to ocular hypertensive subjects. Doc Ophthalmol. 1990;75(2):101-9.
59. Spadea L, Giuffre I, Bianco G, Balestrazzi E. PERG and P-VEP after surgical trabeculec-tomy in primary open-angle glaucoma. Eur J Ophthalmol. 1995;5(2):92-5. 60. Ventura LM, Porciatti V. Restoration of retinal ganglion cell function in early glaucoma
after intraocular pressure reduction: a pilot study. Ophthalmology. 2005;112(1):20-7. 61. Trick GL. Pattern reversal retinal potentials in ocular hypertensives at high and low
risk of developing glaucoma. Doc Ophthalmol. 1987;65(1):79-85.
62. Arai M, Yoshimura N, Sakaue H, Chihara E, Honda Y. A 3-year follow-up study of ocular hypertension by pattern electroretinogram. Ophthalmologica. 1993;207(4):187-95. 63. Pfeiffer N, Tillmon B, Bach M. Predictive value of the pattern electroretinogram in
high-risk ocular hypertension. Invest Ophthalmol Vis Sci. 1993;34(5):1710-5. 64. Bode SF, Jehle T, Bach M. Pattern electroretinogram in glaucoma suspects: new
findings from a longitudinal study. Invest Ophthalmol Vis Sci. 2011;52(7):4300-6. 65. Gonzalvo Ibanez FJ, Fernandez Tirado FJ, Almarcegui Lafita C, Polo Llorens V, Sanchez
Perez A, Honrubia Lopez FM. [Predictive value of the pattern-electroretinogram in glaucoma]. Arch Soc Esp Oftalmol. 2001;76(8):485-91.
66. Bayer AU, Erb C. Short wavelength automated perimetry, frequency doubling technology perimetry, and pattern electroretinography for prediction of progressive glaucomatous standard visual field defects. Ophthalmology. 2002;109(5):1009-17. 67. Trick GL. Retinal potentials in patients with primary open-angle glaucoma:
physiolo-gical evidence for temporal frequency tuning deficits. Invest Ophthalmol Vis Sci. 1985; 26(12):1750-8.
68. Hiss P, Fahl G. [Changes in the pattern electroretinogram in glaucoma and ocular hypertension are dependent on stimulus frequency]. Fortschr Ophthalmol. 1991;88(5): 562-5.
69. Porciatti V, Falsini B, Brunori S, Colotto A, Moretti G. Pattern electroretinogram as a function of spatial frequency in ocular hypertension and early glaucoma. Doc Ophthal-mol. 1987;65(3):349-55.
70. Bach M, Hiss P, Rover J. Check-size specific changes of pattern electroretinogram in patients with early open-angle glaucoma. Doc Ophthalmol. 1988;69(3):315-22. 71. Marx MS, Podos SM, Bodis-Wollner I, Lee PY, Wang RF, Severin C. Signs of early damage
in glaucomatous monkey eyes: low spatial frequency losses in the pattern ERG and VEP. Exp Eye Res. 1988;46(2):173-84.
72. Falsini B, Marangoni D, Salgarello T, Stifano G, Montrone L, Di Landro S, et al. Effect of epigallocatechin-gallate on inner retinal function in ocular hypertension and glaucoma: a short-term study by pattern electroretinogram. Graefes Arch Clin Exp Ophthalmol. 2009;247(9):1223-33.
73. Korth M, Horn F, Storck B, Jonas J. The pattern-evoked electroretinogram (PERG): age-related alterations and changes in glaucoma. Graefes Arch Clin Exp Ophthalmol. 1989;227(2):123-30.
74. Otto T, Bach M. Retest variability and diurnal effects in the pattern electroretinogram. Doc Ophthalmol. 1996;92(4):311-23.
75. Jacobi PC, Walter P, Brunner R, Krieglstein GK. Reproducibility and intraindividual variability of the pattern electroretinogram. Ger J Ophthalmol. 1994;3(4-5):216-9. 76. Bach M, Unsoeld AS, Philippin H, Staubach F, Maier P, Walter HS, et al. Pattern ERG as
an early glaucoma indicator in ocular hypertension: a long-term, prospective study. Invest Ophthalmol Vis Sci. 2006;47(11):4881-7.
77. Bayer AU, Maag KP, Erb C. Detection of optic neuropathy in glaucomatous eyes with normal standard visual fields using a test battery of short-wavelength automated perimetry and pattern electroretinography. Ophthalmology. 2002;109(7):1350-61. 78. Yang A, Swanson WH. A new pattern electroretinogram paradigm evaluated in terms
of user friendliness and agreement with perimetry. Ophthalmology. 2007;114(4):671-9. 79. Bowd C, Vizzeri G, Tafreshi A, Zangwill LM, Sample PA, Weinreb RN. Diagnostic accuracy of pattern electroretinogram optimized for glaucoma detection. Ophthalmology. 2009; 116(3):437-43.
80. Sehi M, Grewal DS, Goodkin ML, Greenfield DS. Reversal of retinal ganglion cell dys function after surgical reduction of intraocular pressure. Ophthalmology. 2010; 117(12):2329-36.
81. Sehi M, Grewal DS, Feuer WJ, Greenfield DS. The impact of intraocular pressure re-duction on retinal ganglion cell function measured using pattern electroretinogram in eyes receiving latanoprost 0.005% versus placebo. Vision Res. 2011;51(2):235-42. 82. Parisi V, Pernini C, Guinetti C, Neuschuler R, Bucci MG. Electrophysiological
83. Komata M, Shirao Y, Watanabe M, Kawasaki K. Delay of pattern electroretinogram peaks and its correlation to contrast threshold for motion perception in glaucoma. Ophthalmic Res. 1995;27(2):110-7.
84. Marx MS, Bodis-Wollner I, Lustgarten JS, Podos SM. Electrophysiological evidence that early glaucoma affects foveal vision. Doc Ophthalmol. 1987;67(3):281-301. 85. Celesia GG, Kaufman D, Cone S. Effects of age and sex on pattern electroretinograms
and visual evoked potentials. Electroencephalogr Clin Neurophysiol. 1987;68(3):161-71. 86. Jafarzadehpour E, Radinmehr F, Pakravan M, Mirzajani A, Yazdani S. Pattern electroreti -nography in glaucoma suspects and early primary open angle glaucoma. Journal of ophthalmic & vision research. 2013;8(3):199-206.
87. Hoffmann MB, Flechner JJ. Slow pattern-reversal stimulation facilitates the assessment of retinal function with multifocal recordings. Clin Neurophysiol. 2008;119(2):409-17. 88. Chan HH, Ng YF, Chu PH. Applications of the multifocal electroretinogram in the
detection of glaucoma. Clin Exp Optom. 2011;94(3):247-58.
89. Monteiro ML, Hokazono K, Cunha LP, Oyamada MK. Correlation between multifocal pattern electroretinography and Fourier-domain OCT in eyes with temporal hemia-nopia from chiasmal compression. Graefes Arch Clin Exp Ophthalmol. 2013;251(3): 903-15.
90. Klistorner AI, Graham SL, Martins A. Multifocal pattern electroretinogram does not demonstrate localised field defects in glaucoma. Doc Ophthalmol. 2000;100(2-3): 155-65.
91. Lindenberg T, Horn FK, Korth M. [Multifocal steady-state pattern-reversal electroreti-nography in glaucoma patients]. Ophthalmologe. 2003;100(6):453-8.
92. Stiefelmeyer S, Neubauer AS, Berninger T, Arden GB, Rudolph G. The multifocal pattern electroretinogram in glaucoma. Vision Res. 2004;44(1):103-12.
93. Drance SM, Airaksinen PJ, Price M, Schulzer M, Douglas GR, Tansley BW. The corre-lation of functional and structural measurements in glaucoma patients and normal subjects. Am J Ophthalmol. 1986;102(5):612-6.
94. Salgarello T, Colotto A, Falsini B, Buzzonetti L, Cesari L, Iarossi G, et al. Correlation of
pattern electroretinogram with optic disc cup shape in ocular hypertension. Invest Ophthalmol Vis Sci. 1999;40(9):1989-97.
95. Falsini B, Marangoni D, Salgarello T, Stifano G, Montrone L, Campagna F, et al. Struc-ture-function relationship in ocular hypertension and glaucoma: interindividual and interocular analysis by OCT and pattern ERG. Graefes Arch Clin Exp Ophthalmol. 2008; 246(8):1153-62.
96. Toffoli G, Vattovani O, Cecchini P, Pastori G, Rinaldi G, Ravalico G. Correlation between the retinal nerve fiber layer thickness and the pattern electroretinogram amplitude. Ophthalmologica. 2002;216(3):159-63.
97. Neoh C, Kaye SB, Brown M, Ansons AM, Wishart P. Pattern electroretinogram and auto-mated perimetry in patients with glaucoma and ocular hypertension. Br J Ophthal mol. 1994;78(5):359-62.
98. Garway-Heath DF, Holder GE, Fitzke FW, Hitchings RA. Relationship between electro-physiological, psychophysical, and anatomical measurements in glaucoma. Invest Ophthalmol Vis Sci. 2002;43(7):2213-20.
99. Hood DC, Xu L, Thienprasiddhi P, Greenstein VC, Odel JG, Grippo TM, et al. The pattern electro retinogram in glaucoma patients with confirmed visual field deficits. Invest Ophthalmol Vis Sci. 2005;46(7):2411-8.
100. Ventura LM, Porciatti V. Pattern electroretinogram in glaucoma. Curr Opin Ophthal-mol. 2006;17(2):196-202.
101. Bach M, Birkner-Binder D, Pfeiffer N. [In incipient glaucoma the pattern electroretino-gram displays diffuse, retinal damage]. Ophthalmologe. 1993;90(2):128-31. 102. Neppert B, Breidenbach K, Dannheim F, Hellner KA. [Chronic open angle glaucoma:
correlation of pattern electroretinography and visual field indices]. Ophthalmologe. 1996;93(5):539-43.
103. Tafreshi A, Racette L, Weinreb RN, Sample PA, Zangwill LM, Medeiros FA, et al. Pattern electroretinogram and psychophysical tests of visual function for discriminating between healthy and glaucoma eyes. Am J Ophthalmol. 2010;149(3):488-95.