3 4 5 Arq Bras Oftalmol. 2014;77(6):345-50 http://dx.doi.org/10.5935/0004-2749.20140087
INTRODUCTION
Accurate determination of central corneal thickness (CCT) has be come increasingly important in ophthalmic applications. CCT mea surement is crucial in preoperative ocular evaluations, particular-ly when performing laser in situ keratomileusis because the amount of correction is limited by the corneal thickness(1). Moreover, this parameter is important in the risk assessment for glaucoma progres-sion in patients with ocular hypertenprogres-sion and glaucoma(2). Corneal thickness measurements are also extensively used in the diagnosis of keratoconus and other corneal disorders(3).
There are several techniques used for CCT measurement. One of these, an ultrasound-based technique, is considered to be the gold standard. However,this is limited because it is a contact technique with the potential drawbacks of causing discomfort to patients and introducing measurement errors secondary to probe misplacement or corneal compression. Furthermore, this contact technique does not enable investigators to obtain a corneal pachymetry map, and the thinnest point of the cornea cannot be determined, although this is very important for decision-making in refractive surgery. Therefore, new non-contact CCT measurement techniques have been
develo-Comparison of central corneal thickness measurements using optical
low-coherence reflectometry, Fourier domain optical coherence tomography,
and Scheimpflug camera
Comparação entre medidas de espessura central da córnea com relectometria óptica de baixa coerência,
tomograia de coerência óptica de domínio Fourier, e câmera Scheimplug
Saban Gonul1, benGu ekinci koktekir1, berker bakbak1, SanSal Gedik1
Submitted for publication: August 4, 2014 Accepted for publication: September 22, 2014
Study conducted at Selcuk University Faculty of Medicine, Department of Ophthalmology, Konya, Turkey.
1 Selcuk University Faculty of Medicine, Department of Ophthalmology, Konya, Turkey.
Funding: No specific financial support was used for this study.
Disclosure of potential conflicts of interest: None of the authors have any potential conflicts of interest to disclose.
Corresponding author: Saban Gonul. Selcuk University Faculty of Medicine - Department of Ophthal-mology. Konya - Turkey - E-mail: [email protected]
ABSTRACT
Purpose: To compare the results of central corneal thickness (CCT ) measurements obtained using optical low-coherence reflectometry (OLCR), Fourier domain optical coherence tomography (FD-OCT ), and a Scheimpflug camera (SC), combined with Placido corneal topography.
Methods: A total of 25 healthy subjects were enrolled in the present study, and one eye of each subject was included. A detailed ophthalmic examination was performed in all cases following CCT measurements with OLCR, FD-OCT, and SC. The results were compared using an ANOVA test. Bland-Altman analysis was used to demonstrate agreement between methods. Intra-examiner repeatability was assessed by using intraclass correlation coefficients (ICCs).
Results: Statistically significant differences were observed between the results of the CCT measurements obtained using the three different devices (p=0.009). Significant correlations were found between OLCR and FD-OCT (r=0.97; p<0.0001), FD-OCT and SC (r=0.91; p<0.0001), and OLCR and SC (r=0.95; p<0.0001). The 95% limits of agreement (LOA) obtained from Bland-Altman plots were from -7.2 μm to 28.7 μm for OLCR versus FD-OCT, from -19.2 μm to 30.4 μm for OLCR versus SC, and from -42.6 to 32.3 μm for FD-OCT versus SC. Intra-examiner repeatability was excellent for each method, with ICCs >0.98.
Conclusions: Although the results of CCT measurements obtained from these three devices were highly correlated with one another and the mean differences between instruments were comparable with the reported diurnal CCT fluctuation, the measurements are not directly interchangeable in clinical practice because of the wide LOA values.
Keywords: Cornea/anatomy & histology; Corneal topography/methods; Tomo-graphy, optical coherence/methods; Fourier analysis; Comparative study; Obser ver variation
RESUMO
Objetivo: Comparar os resultados de medições de espessura corneana central (CCT ) obtidos com reflectometria óptica de baixa coerência (OLCR), tomografia de coerência óptica de domínio Fourier (FD-OCT ), e uma câmera Scheimpflug (SC), combinada com topografia corneana de placido.
Métodos: Um olho de cada de 25 indivíduos saudáveis foram incluídos neste estudo. Um exame oftalmológico detalhado foi realizado em todos os casos após as medidas de CCT com OLCR, FD-OCT, e SC. Os resultados foram comparados por meio do teste ANOVA. Análise de Bland-Altman foi utilizada para demonstrar concordância entre os métodos. A repetibilidade intra-examinador foi avaliada por meio de coeficientes de correlação intraclasse (ICCs).
Resultados: Foram observadas diferenças estatisticamente significativas entre os resultados das medidas de CCT obtidas a partir de três dispositivos diferentes (p=0,009). Foram encontradas correlações significativas entre OLCR e FD-OCT (r=0,97, p<0,0001), FD-OCT e SC (r=0,91, p<0,0001), e OLCR e SC (r=0,95; p<0,0001). Os limites de 95% de confiança (LOA) obtidos a partir de gráficos de Bland-Altman foram de -7,2 a 28,7 μm para OLCR contra FD-OCT, de -19,2 a 30,4 μm para OLCR contra SC, e de -42,6 a 32,3 μm para FD-OCT contra SC. A repetibilidade intra-examinador foi excelente para cada método com ICCs>0,98.
Conclusões: Apesar de os resultados das medições CCT obtidos a partir destes três dispositivos terem sido altamente correlacionados entre si e as diferenças médias entre os instrumentos serem comparáveis à flutuação relatado da CCT diurna, as medições não são diretamente intercambiáveis na prática clínica em razão da largura dos valores limites de confiança.
346 Arq Bras Oftalmol. 2014;77(6):345-50
ped. At present, various non-contact imaging technologies are avai-lable for CCT measurement. Interferometry has been proposed to be more precise and reliable than ultrasound for CCT measurement(4,5). The relatively new Lenstar LS900 (Haag-Streit, Switzerland) instru-ment uses an interferometry technique to perform biometry of the whole eye in approximately 20 s per measurement(6).
Optical coherence tomography (OCT) is another imaging mo-dality that provides noncontact measurement of CCT. Recently, Fourier domain OCT (FD-OCT) has demonstrated greater speed, shor-ter acqui sition time, high resolution, and less motion error compared with a time-domain OCT (TD-OCT)(7). The commercially available FD-OCT (RTvue-100, Optovue Inc, Fremont, CA) has a scan rate of 26,000 A-scans per second and an axial resolution of 5 µm. It obtains high-resolution, cross-sectional images of the cornea and provides a pachymetry map(8,9).
The Scheimplug camera (SC) combined with Placido corneal to -pography (Sirius; CSO Inc, Firenze, Italy) is a new to-pography device that enables rapid acquisition of cross-sectional images of the cor-nea. It can measure 35,632 points on the anterior corneal surface and 30,000 on the posterior corneal surface, in high-resolution mode, in approximately 5-6 s. A pachymetric map is then reconstructed using the point-by-point anterior and posterior corneal surface data(10).
These non-contact instruments have been shown to have good repeatability in normal eyes(3,6,9-15). However, there are limited data available regarding the agreement among CCT measurements obtai-ned using OLCR, FD-OCT, and SC. The aim of the present study was to evaluate the level of agreement among CCT measurements acquired by these instruments.
METHODS
Twenty-ive healthy subjects (15 females and 10 males) admitted for routine ophthalmic examination at Selcuk University Faculty of Medicine Ophthalmology Department were recruited for the present study. This study adhered to the tenets of the Declaration of Helsinki, and all subjects provided informed consent for participation. Inclu-sion criteria were a negative history of chronic ocular or systemic disease and ocular surgery and no signs of previous or present ocular disease; subjects with refractive errors over ±1 diopter spherical or cylindrical values were excluded. The age of the subjects ranged from 12 to 52 years (mean, 27.8 ± 7.2 years). CCT was measured in both
eyes using OLCR, FD-OCT, and SC following a complete ophthalmic examination, but only the right eye of each subject was included in the study. The same examiner sequentially obtained the measure-ments using OLCR, FD-OCT, and SC. Three consecutive scans were obtained using each device. The mean values of these three readings was used for analysis.
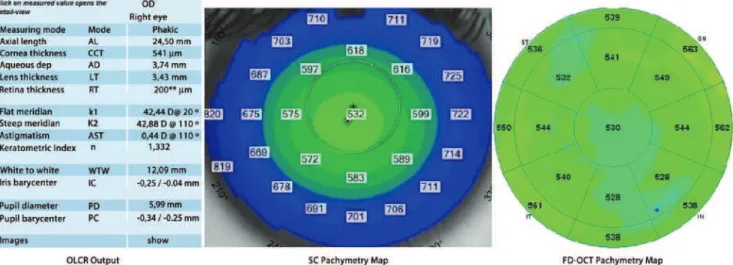
In the examination using OLCR, the subjects were asked to gaze at the round circle in front of them. The CCT measurements, which were automatically calculated by the internal software of the device, recorded, and interpreted. For the SC examination, the investigator observed the image of the eye on the monitor, brought the image into focus, and centralized it on the monitor. When the image was in focus, the CCT measurements were taken and assessed using the pachymetry map. For the FD-OCT examination, infrared lights were temporally placed to the subject’s eye to provide illumination of the ocular surface. CCT measurements, which were automatically assessed using the pachymetry map, were recorded and interpreted (Figure 1).
For optimal scan quality, the patients were instructed to blink completely just before each measurement to achieve proper ocular surface, to stare at the target, and not to blink during the measure-ment. Moreover, images were only obtained after a bright, centered corneal apex relection during the SC and FD-OCT measurements. Repeat scans were performed if the signal strength index of the image was <30 during FD-OCT measurements and if poor acquisition quality was observed during SC measurements. Improper images were automatically excluded during OLCR measurements. Therefore, the study included only centered and proper scans.
Statistical analysis was performed using SPSS version 11.5 (SPSS Inc., Chicago, IL) for Windows (Microsoft Corporation, Redmond, WA). The descriptive statistics were presented as mean ± standard de-viation. To ascertain the association between the three methods of evaluation, Spearman’s rank correlation coeicient (r) was calculated. The results of CCT measurements obtained using each device were compared by using a repeated-measures analysis of variance (ANOVA) test, and pair-wise comparisons were performed using Bonferroni adjustment tests. A p value <0.05 was considered to be statistically signiicant. Bland-Altman(16) analysis was used to demonstrate agree-ment between methods, and 95% limits of agreeagree-ment (LOA) were calculated. Intra-examiner repeatability was determined using intra-class correlation coeicients (ICCs).
Figure 1. Optical low-coherence relectometry output, Scheimplug camera and Fourier domain optical coherence tomography pachymetry maps demonstrating central
347
Arq Bras Oftalmol. 2014;77(6):345-50 RESULTS
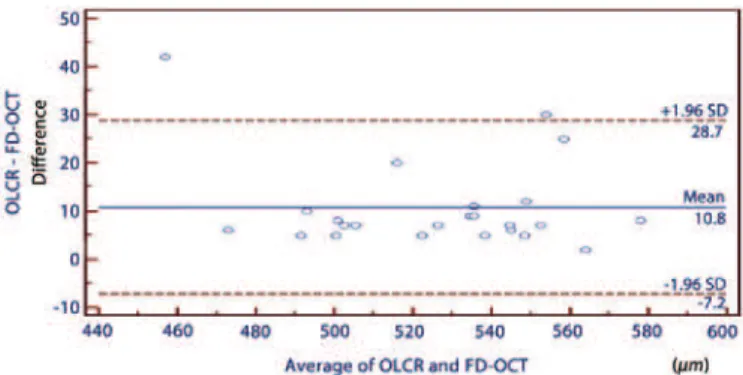
Table 1 summarizes the mean CCT values measured using OLCR, SC, and FD-OCT. Signiicant correlations were found between all pair-wise comparisons (p<0.0001) (Table 2). In comparing the three instruments using repeated-measures ANOVAs, a statistically sig-niicant diference was observed between the results of the CCT measurements (p=0.009). There was a signiicant diference in the measurements between OLCR and FD-OCT; hovewer, no statistically signiicant diferences were observed between the results of the CCT measurements in the other pair-wise comparisons (OLCR ver-sus SC and FD-OCT verver-sus SC) obtained using ANOVAs with Bonferroni adjustment tests (Table 2). The respective Bland-Altman plots bet ween each pair of the three devices are shown in igures 2 through 4. The plots show that the OLCR measurement was higher than the FD-OCT measurement (mean diference, 10.8 μm) (Figure 2). The OLCR mea-surement was also higher than the SC meamea-surement, with a mean diference of 5.6 μm (Figure 3), and the FD-OCT measurement was thinner than the SC measurement (mean diference, 5.2 μm) (Figure 4). Considering the 95% LOA obtained from Bland-Altman plots for these comparisons, the OLCR and FD-OCT measurement displayed the smallest range of LOA (35.9 μm). The other LOA ranges were 49.6 μm between OLCR and SC, and 74.9 μm between FD-OCT and SC.
Intra-examiner repeatability of each method showed that the ICCs were excellent for each method, ranging from 0.98 to 0.99 (Table 3).
DISCUSSION
Corneal thickness measurements can be performed using ultra-sound-based or optical-based techniques. Traditional ultrasound pa-chymetry has been the gold standard method of measuring CCT for many years(17). However, ultrasound pachymetry is a contact method, which requires topical anesthesia and may carry a risk of infection or mechanical trauma unless proper precautions are taken(18). Moreover, the instillation of topical anesthesia may cause the overestimation of CCT measurements in this technique(19). Thus, there are several advan-tages in using a non-contact procedure for CCT measurements(17,20).
In the current study, FD-OCT had a slightly lower mean CCT surement (by a mean of 5.16 µm) compared with the SC CCT mea-surement, although this diference was not statistically signiicant. In contrast, signiicantly higher CCT measurements using TD-OCT (Stratus) were described by Ceylan et al.(21) when comparing TD-OCT values to SC (Pentacam). In their study, CCT measurements were ob-tained manually with the TD-OCT device, unlike in our study. Thus, in their study, the CCT measurements could have been overestimated during manual measurement because of misalignment of the central
cornea. On the other hand, Ishibazawav et al.(11) showed that the CCT measurement obtained using FD-OCT (RTVue-100) was signiicantly thinner than that obtained with SC (Pentacam). They proposed that the higher resolution of FD-OCT compared with SC could have led to better corneal edge detection, resulting in underestimation of the CCT. In our study, another topography system, also based on the SC (Sirius), was used, and its CCT measurements were, on average, 5.16 ± 8.08 µm thicker than the FD-OCT measurements; however, the diference was not statistically signiicant.
In several studies, the CCT measurements acquired with OCT were substantially lower than those obtained with SC and OLCR(8-11,22-24). A possible explanation for this diference was described by Li et al.(25) They used TD-OCT (Visante) in their study; this device uses software analysis that places boundary lines on the anterior and posterior corneal surface to automatically measure CCT. The anterior boundary line is often placed slightly below the anterior corneal surface. This results in slightly lower CCT values when using the automatic CCT measurements, which we used for our comparative analysis. Howe-ver, the FD-OCT was used in our study. Because FD-OCT has greater speed, shorter acquisition time, high resolution, and less motion error compared with TD-OCT, detection of the anterior boundary line could be improved. Therefore, the mean diference in CCT mea-surements between FD-OCT and SC was small and not statistically sig niicant in our study.
In the current study, we found that the results of CCT measure-ments obtained from these three devices were highly correlated with one another (95.0%, 91.0%, and 97% in pair-wise comparisons; Table 2). However, it has been shown that a high correlation coeicient does not always relect a high agreement between two compared ins-truments. Therefore, mean diferences between instruments should be irst considered, while considering the agreements between instruments to conclude whether these instruments could be used interchangeably for CCT measurements. In our study, these values were not statistically signiicant except for the diference between FD-OCT and OLCR measurements. In addition, the mean diferences in all pair-wise comparisons were comparable with the reported diur nal CCT luctuation(26). In order to assess the agreement among the instruments, we used the Bland-Altman plots that describe the range in which 95% of all diferences are anticipated to fall. Although the OLCR and FD-OCT measurements displayed the smallest range of LOA (35.9 μm), it ranged from 28.70 to -7.20, meaning that these ins-truments might measure the CCT as far as 28.7 mm higher or 7.2 mm lower than one another. These values were not comparable with the diurnal CCT luctuation. Thus, we conclude that the measurements are not directly interchangeable for all comparisons in clinical practi-ce because of the wide LOA values.
Table 4 summarizes the previous studies comparing the three methods in CCT measurements. Chen et al.(9) also investigated the agreement between another SC (Pentacam) and the same FD-OCT used in our study. In their study, the range of 95% LOA was 23.2 μm, which is considerably narrower than those found in our study (74.9 μm). They concluded that measurements with both instruments could be used interchangeably despite statistically signiicant diference between devices because the diference was comparable with the reported diurnal CCT luctuation(26).Conversely, Milla et al.(10)
sho-Table 1. Mean ± SD values for central corneal thickness (CCT) measures obtained with the three devices
OLCR SC FD-OCT p-value
CCT, µm 531.88 ± 29.10 526.28 ± 25.51 521.12 ± 30.92 0.009
OLCR= optical low coherence relectometry; SC= Scheimplug camera; FD-OCT= Fou-rier-domain optical coherence tomography.
Table 2. Pairwise comparison of central corneal thickness measurements using optical low coherence relectometry (OLCR), Scheimplug camera (SC) and Fourier-domain optical coherence tomography (FD-OCT)
Pairwise comparison Mean diference ± SD, μm Spearman rank correlation coeicient *, r 95% limits of agreement, μm p-value**
OLCR/SC -5.60 ± 12.65 0.95 30.40 to -19.20 <0.110
FD-OCT/SC -5.16 ± 19.09 0.91 32.30 to -42.60 <0.568
OLCR/FD-OCT 10.76 ± 09.16 0.97 28.70 to -7.20 <0.001
3 4 8 Arq Bras Oftalmol. 2014;77(6):345-50
wed poor agreement between the pachymetric maps provided by TD-OCT system (Visante) and the same SC used in our study. In their study, the range of the 95% LOA was 40.7 μm. They inferred that the range of the 95% LOA was too broad to interchange the measure-ments with both instrumeasure-ments. As the measuremeasure-ments obtained using the SC were always higher than those obtained using TD-OCT in their study, they emphasized that this diference is important, especially when screening candidates for excimer laser refractive surgery. In addition, several studies that compared the agreement between TD-OCT (Visante) and SC (Pentacam) for CCT measurement showed that these devices should not be used interchangeably in a clinical setting because of poor agreement(6,22,27). Similarly, Ishibazawa et al.(11) showed that the 95% LOA for the CCT measurement between
ano-ther SC (Pentacam) and the same FD-OCT used in our study was 44 μm, which was not wider than those found in our study (74.9 μm). They concluded that CCT measurements with these devices should not be used interchangeably in a clinical setting. Similarly, in our study, the ranges of 95% LOA between FD-OCT and SC were broad and in accordance with literature, as stated above.
In our study, considering the 95% LOA obtained from Bland-Altman plots for these comparisons, the OLCR and FD-OCT measurement displayed the smallest range of LOA (35.9 μm). López-Miguel et al.(14) observed that the 95% LOA for the CCT measurement between another FD-OCT (Cirrus) and the same OLCR used in our study was 44.93 μm, which was slightly wider than those found in our study. They suggested that CCT measurements obtained with these devices could be used interchangeably, with minimum calibration adjust-ment. Nevertheless, they mentioned that these small diferences between devices might be clinically relevant, especially in patients considering refractive surgery and patients with glaucoma.
Cruysberg et al.(23) reported that the 95% LOA for the CCT measu-rement between TD-OCT (Visante) and the same OLCR used in our study was 26 μm, which was slightly narrower than those observed in our study. In their study, the diference between the CCT measu-rements of the OLCR and the TD-OCT was statistically signiicant, resulting in higher CCT values using OLCR compared with TD-OCT. The OLCR measurement was also higher than the FD-OCT measure-ment in our study. O’Donnell et al.(6) also reported that the 95% LOA for the CCT measurement between TD-OCT (Visante) and the same OLCR used in our study was 65.52 μm, which was much wider than those observed in our study. They suggested that CCT measures from these instruments should not be used interchangeably because of poor agreement between these instruments. In our study, reasonable agreement was found between the OLCR and the FD-OCT, in contrast with their study.
In the current study, we found that the range of 95% LOA between OLCR and SC was 49.6 μm. On the other hand, Chen et al.(28) reported that the 95% LOA for the CCT measurement between the same devi-ces used in our study was 22.33 μm, which was considerably narrower than those observed in our study. They suggested that CCT measure-ments from these instrumeasure-ments can be used interchangeably, because of good agreement between these instruments. This discrepancy might be caused by the diference of the mean CCT values between the two studies. In our study, the mean CCT values measured by OLCR and SC were 531.88 µm and 526.28 ± 25.51 µm, respectively. In their study, the mean CCT values were not mentioned. For these reason, further studies on a larger range of CCT thicknesses are warranted.
In conditions with statistically non-signiicant mean diferences between two devices, the agreement between the devices can be determined using the magnitude of the LOA. In addition, whether the range of LOA includes zero mean diference between devices on Bland-Altman plots is also important to draw conclusions regarding the agreement between two devices. All these factors can determine the agreement between two devices and whether both devices can be used interchangeably. On the other hand, whether this agreement is clinically satisfactory depends on the clinical situation. In patients undergoing refractive surgery, for instance, overestimation of CCT could lead to serious complications, whereas underestimation of CCT could lead to the exclusion of eligible patients from refractive surgery procedures(1). Similarly, these faulty measurements may be misleading with regard to the diagnosis and treatment of glaucoma cases(2). In such cases, the range of LOA should not only be narrow, but the zero mean diference between the devices should also be in the middle of that narrow range on Bland-Altman plots in order to use the two devices interchangeably. In the current study, the zero mean diference falls in the middle of the range of LOA for all device pairs. However, the ranges of LOAs for all the device pairs were too broad to use both devices interchangeably.
Interestingly, there were a few participants who were obvious outliers in Bland-Altman plots, causing larger diferences in CCT
Figure 3. A Bland-Altman plot comparing the central corneal thickness measurements
obtained using optical low-coherence relectometry and the Scheimplug camera.
Figure 2. A Bland-Altman plot comparing the central corneal thickness measurements
obtained using optical low-coherence relectometry and Fourier domain optical cohe-rence tomography.
Table 3. Intra-examiner repeatability of each method of central corneal thickness measurements
Methods ICC 95% CI
OLCR 0.9874 0.9715-0.9945
SC 0.9838 0.9632-0.9928
FD-OCT 0.9901 0.9776-0.9956
3 4 9 Arq Bras Oftalmol. 2014;77(6):345-50
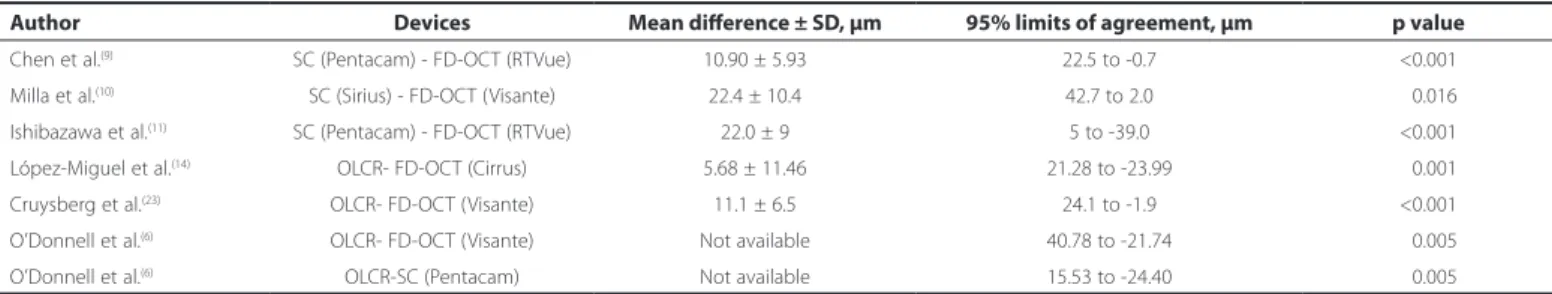
Table 4. Previous studies comparing three methods in central corneal thickness measurements
Author Devices Mean diference ± SD, μm 95% limits of agreement, μm p value
Chen et al.(9) SC (Pentacam) - FD-OCT (RTVue) 10.90 ± 5.93 22.5 to -0.7 <0.001
Milla et al.(10) SC (Sirius) - FD-OCT (Visante) 22.4 ± 10.4 42.7 to 2.0 <0.016
Ishibazawa et al.(11) SC (Pentacam) - FD-OCT (RTVue) 22.0 ± 9 5 to -39.0 <0.001
López-Miguel et al.(14) OLCR- FD-OCT (Cirrus) 5.68 ± 11.46 21.28 to -23.99 <0.001
Cruysberg et al.(23) OLCR- FD-OCT (Visante) 11.1 ± 6.5 24.1 to -1.9 <0.001
O’Donnell et al.(6) OLCR- FD-OCT (Visante) Not available 40.78 to -21.74 <0.005
O’Donnell et al.(6) OLCR-SC (Pentacam) Not available 15.53 to -24.40 <0.005
SD= standard deviation; FD-OCT= Fourier-domain optical coherence tomography; SD OCT= spectral-domain optical coherence tomography; OLCR= optical low coherence relectometry; SC= Scheimplug camera.
measurements between devices, which induced poor agreement between the devices. We were unable to determine which device caused these diferent CCT measurements because our study did not include any ultrasound-based CCT measurements, which is the gold standard in CCT measurement. However, this might have been caused by some subjects with CCT values at the upper/lower limit of normal. Therefore, further studies including a larger number of subjects with extreme values of CCT as well as ultrasound-based CCT measurements are warranted.
The results of the present study demonstrated that all devices have high repeatability in healthy subjects and were in accordance with the literature(3,6,9-15). In addition, the FD-OCT exhibited slightly better repeatability compared with the other devices. A possible explanation for this is that FD-OCT measures CCT with greater speed and shorter acquisition time, reducing error due to eye motion. Also, FD-OCT has high resolution, which enables the precise delineation of the boundaries of the cornea. These factors reduce the variability of measurements acquired with FD-OCT.
There are some limitations that must be addressed. In our study, ultrasound pachymetry, the gold standard in CCT measurement, was not included because our main purpose was to evaluate the level of agreement among CCT measurements acquired by three non-in-vasive techniques. In addition, these measurements were acquired only from healthy subjects. Therefore, further studies are needed to assess the agreement of measurements in patients with conditions such as cataract, keratoconus, ocular hypertension, and other corneal disorders.
In conclusion, the results of CCT measurements obtained using these three devices are correlated with one another, and the mean differences are comparable with the reported diurnal CCT
luctua-tion; however, the agreement expressed by the 95% LOA values is broad for all the device pairs. This suggests that clinicians should be aware of the diferences between these noncontact devices, and that they should not be used interchangeably for CCT measurements in the evaluation of patients with glaucoma or in patients who are candidates for refractive procedures.
REFERENCES
1. Wang Z, Chen J, Yang B. Posterior corneal surface topographic changes after laser in situ keratomileusis are related to residual corneal bed thickness. Ophthalmology. 1999;106(2):406-9.
2. Weinreb RN, Friedman DS, Fechtner RD Cioi GA, Coleman AL, Girkin CA et al. Risk assessment in the management of patients with ocular hypertension. Am J Ophthal-mol. 2004;138(3):458-67.
3. Bjeloš Rončević M, Bušić M, Cima I, Kuzmanović Elabjer B, Bosnar D, Miletić D. In-traobserver and interobserver repeatability of ocular components measurement in cataract eyes using a new optical low coherence relectometer. Graefes Arch Clin Exp Ophthalmol. 2011;249(1):83-7.
4. Drexler W, Baumgartner A, Findl O, Hitzenberger CK, Sattmann H, Fercher AF Submi-crometer precision biometry of the anterior segment of the human eye. Invest Ophthalmol Vis Sci. 1997;38(7):1304-13.
5. Drexler W, Findl O, Menapace R, Rainer G, Vass C, Hitzenberger CK, et al. Partial coheren-ce interferometry: a novel approach to biometry in cataract surgery. Am J Ophthalmol. 1998;126(4):524-34.
6. O’Donnell C, Hartwig A, Radhakrishnan H. Comparison of central corneal thickness and anterior chamber depth measured using LenStar LS900, Pentacam, and Visante AS-OCT. Cornea. 2012;31(9):983-8.
7. Gonzalez-Garcia AO, Vizzeri G, Bowd C, Medeiros FA, Zangwill LM, Weinreb RN. Repro-ducibility of RTVue retinal nerve iber layer thickness and optic disc measurements and agreement with Stratus optical coherence tomography measurements. Am J Ophthalmol. 2009;147(6):1067-74.
8. Huang J, Pesudovs K, Yu A, Wright T, Wen D, Li M, et al. A comprehensive comparison of central corneal thickness measurement. Optom Vis Sci. 2011;88(8):940-9. 9. Chen S, Huang J, Wen D, Chen W, Huang D, Wang Q. Measurement of central corneal
thickness by high-resolution Scheimplug imaging, Fourier-domain optical coheren-ce tomography and ultrasound pachymetry. Acta Ophthalmol. 2012;90(5):449-55. 10. Milla M, Piñero DP, Amparo F, Alió JL. Pachymetric measurements with a new
scheim-plug photography-based system: intraobserver repeatability and agreement with optical coherence tomography pachymetry. J Cataract Refract Surg. 2011;37(2):310-6. 11. Ishibazawa A, Igarashi S, Hanada K, Nagaoka T, Ishiko S, Ito H, Yoshida A, et al. Central corneal thickness measurements with Fourier-domain optical coherence tomogra-phy versus ultrasonic pachymetry and rotating Scheimplug camera. Cornea. 2011; 30(6):615-9.
12. Keech A, Simpson T, Jones L. Repeatability of pachymetry and thinnest point loca li-zation using a fourier-domain optical coherence tomographer. Optom Vis Sci. 2010; 87(10):736-41.
13. Prakash G, Agarwal A, Jacob S, Kumar DA, Agarwal A, Banerjee R. Comparison of fourier-domain and time-domain optical coherence tomography for assessment of corneal thickness and intersession repeatability. Am J Ophthalmol. 2009;148(2):282-90. 14. López-Miguel A, Correa-Pérez ME, Miranda-Anta S, Iglesias-Cortiñas D, Coco-Martín
MB, Maldonado MJ. Comparison of central corneal thickness using optical low-cohe-rence relectometry and spectral-domain optical cohelow-cohe-rence tomography. J Cataract Refract Surg. 2012;38(5):758-64.
15. Koktekir BE, Gedik S, Bakbak B. Comparison of central corneal thickness measurements with optical low-coherence relectometry and ultrasound pachymetry and reprodu-cibility of both devices. Cornea. 2012;31(11):1278-81.
16. Bland JM, Altman DG. Statistical methods for assessing agreement between 2 me-thods of clinical measurement. Lancet. 1986;1(8476):307-10.
Figure 4. A Bland-Altman plot comparing the central corneal thickness measurements
350 Arq Bras Oftalmol. 2014;77(6):345-50
17. Barkana Y, Gerber Y, Elbaz U, Schwartz S, Ken-Dror G, Avni I, et al. Central corneal thi ckness measurement with the Pentacam Scheimplug system, optical low-co he-rence relectometry pachymeter and ultrasound pachymetry. J Cataract Refract Surg. 2005;31(9):1729-35.
18. Lackner B, Schmidinger G, Pieh S, Funovics MA, Skorpik C. Repeatability and repro-ducubility of central corneal thickness measurement with Pentacam, Orbscan and ul trasound. Optom Vis Sci. 2005;82(10):892-9.
19. Montero JA, Ruiz-Moreno JM, Fernandez-Munoz M, Rodriguez-Palacios MI. Efect of topical anesthetics on intraocular pressure and pachymetry. Eur J Ophthalmol. 2008; 18(5):748-50.
20. Kawamorita T, Uozato H, Kamiya K, Bax L, Tsutsui K, Aizawa D, et al. Repeatability, re-producibility, and agreement characteristics of rotating Scheimplug photography and scanningslit corneal topography for corneal power measurement. J Cataract Refract Surg. 2009;35(1):127-33.
21. Ceylan OM, Turk A, Erdurman C, Mumcuoglu T, Erdem U, Gokce G, et al. Comparison of oculus pentacam and stratus optical coherence tomography for measurement of central corneal thickness. Cornea. 2011;30(6):670-4.
22. Doors M, Cruysberg LP, Berendschot TT, de Brabander J, Verbakel F, Webers CA, et al. Comparison of central corneal thickness and anterior chamber depth measurements
using three imaging technologies in normal eyes and after phakic intraocular lens im-plantation. Graefes Arch Clin Exp Ophthalmol. 2009;247(8):1139-46.
23. Cruysberg LP, Doors M, Verbakel F, Berendschot TT, De Brabander J, Nuijts RM. Evalua-tion of the Lenstar LS 900 non-contact biometer. Br J Ophthalmol. 2010;94(1):106-10. 24. Mylonas G, Sacu S, Buehl W, Ritter M, Georgopoulos M, Schmidt-Erfurth U. Performan-ce of three biometry deviPerforman-ces in patients with diferent grades of age-related cataract. Acta Ophthalmol. 2011;89(3):237-41.
25. Li H, Leung CK, Wong L, Pang CP, Weinreb RN, Lam DS. Comparative study of central corneal thickness measurement with slit-lamp optical coherence tomography and visante optical coherence tomography. Ophthalmology. 2008;115:796-801. 26. Lattimore MR Jr, Kaupp S, Schallhorn S, Lewis R 4th. Orbscan pachymetry:
implica-tions of a repeated measures and diurnal variation analysis. Ophthalmology. 1999; 106(5):977-81.
27. Gorgun E, Yenerel NM, Dinc UA, Oncel B, Kucumen RB, Oral D, et al. Comparison of non-contact methods for the measurement of central corneal thickness. Ophthalmic Surg Lasers Imaging. 2011;42(5):400-7.
28. Chen W, McAlinden C, Pesudovs K, Wang Q, Lu F, Feng Y, et al. Scheimplug-Placido to pographer and optical low-coherence relectometry biometer: repeatability and agreement. J Cataract Refract Surg. 2012;38(9):1626-32.