ABSTRACT:Introduction: In Brazil, the spatial distribution of leprosy is heterogeneous. Areas with high transmission of the disease remain in the North, Center-west and Northeast. Areas with high transmission of the disease remain in the Northern, Central-Western and Northeastern regions of the country. Objective: to describe the spatial distribution of leprosy in municipalities with high risk of transmission, in the periods from 2001 – 2003 and 2010 – 2012. Methods: This was an ecological study using data from the Notiiable Diseases Information System (SINAN). They included all municipalities in the states of Mato Grosso, Tocantins, Rondônia, Pará and Maranhão. The following leprosy indicators were calculated per 100,000 inhabitants: incidence rate of leprosy, incidence rate in children aged less than 15 years and rate of new cases with grade 2 disabilities. The spatial scan statistic was used to detect signiicant clusters (p ≤ 0.05) in the study area. Results: In the period 2001 – 2003, the scan spatial statistics identiied 44 signiicant clusters for the leprosy incidence rate, and 42 signiicant clusters in the period 2010 – 2012. In the period 2001 – 2003, it was possible to identify 20 signiicant clusters to the incidence rate in children aged less than 15, and 14 signiicant clusters in the period 2010 – 2012. For the rate of new cases with grade 2 disability, the scan statistics identiied 19 signiicant clusters in the period 2001 – 2003, and 14 signiicant clusters in the period 2010 – 2012. Conclusions: Despite the reduction in the detection of leprosy cases, there is a need intensify disease control actions, especially in the clusters identiied.
Keywords: Leprosy. Ecological studies. Spatial analysis. Epidemiological surveillance. Cluster analysis. Communicable diseases.
Analysis of the epidemiological situation of
leprosy in an endemic area in Brazil: spatial
distribution in the periods 2001 – 2003 and
2010 – 2012
Análise da situação epidemiológica da hanseníase em uma área endêmica
no Brasil: distribuição espacial dos períodos 2001 – 2003 e 2010 – 2012
Lúcia Rolim Santana de FreitasI, Elisabeth Carmen DuarteI, Leila Posenato GarciaII
INúcleo de Medicina Tropical, Universidade de Brasília – Brasília (DF), Brazil. IIInstituto de Pesquisa Econômica Aplicada – Brasília (DF), Brazil.
Corresponding author: Lúcia Rolim Santana de Freitas. Campus Universitário Darcy Ribeiro, s/n, Asa Norte, CEP: 70904-970, Brasília, DF, Brasil. E-mail: [email protected]
INTRODUCTION
Leprosy is a chronic disease caused by the bacillus Mycobacterium leprae, which afects mostly the skin and the peripheral nerves1,2, and represents a public health issue in some parts of the world, including Brazil. According to a report by the World Health Organization (WHO), in 2014, 213,899 new cases of leprosy were notiied in the world. In Brazil, in the same year, 31,064 new cases of leprosy were notiied. Of these, 2,341 (7.5%) new cases corresponded to people aged less than 15 years, and 2,034 (6.5%) patients pre-sented grade 2 disabilities3.
To intensify the strategies of intervention and control of leprosy in speciic geographic zones, the spatial analysis has been used by identifying the distribution of the condition in a national, regional and local level4-8.
In Brazil, the spatial distribution of leprosy is heterogeneous: the States that are more socioeconomically developed in the South Region reached the goal of eliminat-ing leprosy as a public health issue — prevalence of less than 1 case per 10,000 inhabi-tants. However, pockets of high load of the disease remain in the North, Center-West and Northeast regions of Brazil, considered the areas where the disease is mostly trans-mitted in the country1,8-10.
A cluster analysis conducted in 2009 by the Ministry of Health showed that the States of Mato Grosso, Tocantins, Rondônia, Pará and Maranhão are still areas with high risk of persistent transmission of leprosy10. Recently, systems of geographic information and
RESUMO:Introdução: No Brasil, a distribuição espacial da hanseníase é heterogênea. Áreas com alta transmissão da doença permanecem nas regiões Norte, Centro-Oeste e Nordeste do país. Objetivo: Descrever a distribuição espacial da hanseníase em municípios brasileiros com alto risco de transmissão, nos períodos 2001 – 2003 e 2010 – 2012. Métodos: Trata-se de um estudo ecológico com dados do Sistema de Informação de Agravos de Notiicação (SINAN). Foram incluídos todos os municípios localizados nos Estados de Mato Grosso, do Tocantins, de Rondônia, do Pará e do Maranhão. Os seguintes indicadores de hanseníase foram calculados por 100.000 habitantes: taxa de incidência de hanseníase, taxa de incidência em menores de 15 anos e a taxa de casos novos com grau 2 de incapacidade (por 100.000 habitantes). A estatística espacial scan foi usada para detectar clusters signiicativos (p ≤ 0,05) na área de estudo. Resultados: No período 2001 – 2003, a estatística espacial scan identiicou 44 clusters signiicativos para a taxa de incidência da hanseníase, e 42 clusters signiicativos no período 2010 – 2012. No período 2001 – 2003, foram identiicados 20 clusters signiicativos para a taxa de incidência em menores de 15 anos, e 14 clusters signiicativos no período 2010 – 2012. Para a taxa de casos novos com grau 2 de incapacidade, a estatística scan identiicou 19 clusters signiicativos no período 2001 – 2003, e 14 agrupamentos signiicativos no triênio 2010 – 2012. Conclusão: Apesar da redução na detecção de casos de hanseníase, há uma necessidade de intensiicar as ações de controle da doença, especialmente nos clusters identiicados.
spatial analysis became important tools for the epidemiology, helping to understand the dynamics of transmission of several diseases. These results may be used as guides to elaborate programs to control leprosy, aiming at directing the intervention for high-risk areas6,8,11. Therefore, getting to know the spatial and temporal patterns of the disease in the cities of these States is essential to provide subsidies to plan for surveillance actions and to control the disease.
Therefore, the objective of this study was to describe the spatial distribution of leprosy in a group of Brazilian cities with high risk of transmission of this disease.
METHODS
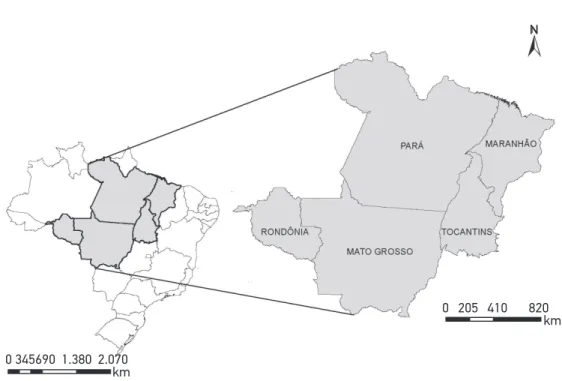
An ecological study, with spatial analysis, was conducted using data from the Notiiable Diseases Information System (SINAN)12, in the years 2001 – 2003 and 2010 – 2012. The units of study analysis were the 692 cities in the States of Mato Grosso, Tocantins, Rondônia, Pará and Maranhão. This group is located in the central area of Brazil (Figure 1). The study area occupies 2,998,569 km2 and, according to the Demographic Census 2010, its total pop-ulation was 20.1 million inhabitants, which represents 10.6% of the Brazilian poppop-ulation.
In the years 2001 – 2003 and 2010 – 2012, the following epidemiological indicators of leprosy were calculated for the cities in the group: incidence rate of leprosy/100,000
N
0 345690 1.380 2.070 km
km 0 205 410 820
inhabitants, incidence rate in people aged less than 15 years/100,000 inhabitants, and rate of new cases with grade 2 disabilities/100,000 inhabitants. The size of the resident popu-lation in 2010, used as a denominator, came from Census 2010, and the other years used in this study were obtained from intercensal projections produced by the Brazilian Institute of Geography and Statistics (IBGE)12,13.
The spatial statistics scan was used to detect signiicant clusters inside the study area in the analyzed period. This technique is deined by a circular geographic window that moves around the area of interest14,15. The method identiies one region, formed by all areas with the respective centroids inside the circle, and tests the constant risk null hypothesis versus the alternative hypothesis that there is high risk of occurrence of events inside the window, in comparison to the outside. The model with the Poisson distribution was used. This model is based on a number of events (cases of leprosy) distributed according to a known popu-lation at risk16,17. The statistical signiicance was evaluated considering p ≤ 0.05 (likelihood ratio test). The clusters were identiied using a purely spatial analysis14, with a search radius of up 100 km7.
The analyses were conducted with the softwares SatScan 9.318 and ArcGis 9.2 (Environmental Systems Research Institute, Redlands, CA, USA)19.
This study was approved by the Research Ethics Committee in the School of Health Sciences of Universidade de Brasília, CAAE 20249613.9.0000.0030 and Report n. 392.809, issued on September 10, 2013. This study was conducted exclusively with secondary data, of public access, without identiication of subjects, and its procedures are in accordance with the principles of ethics in research involving human beings.
RESULTS
From 2001 – 2012, 176,929 cases of leprosy were notiied in the group of cities, which is equivalent to 34.6% of all cases in Brazil. In the cluster, from 2001 – 2003, 404 (58.4%) cities were classiied as hyperendemic (mean annual incidence rate higher than 40 cases/100,000 inhabitants), with maximum value of 538.5 cases per 100,000 inhabitants. On the other hand, from 2010 – 2012, 402 (58.1%) cities were classiied as hyperendemic, with maximum value of 314.5 cases per 100,000 inhabitants.
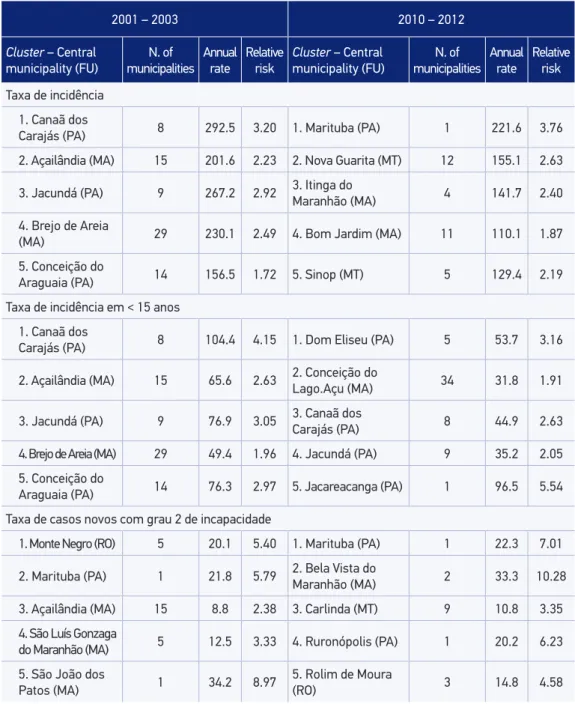
For the rate of new cases with grade 2 disabilities, the spatial statistics scan identiied 19 signiicant clusters from 2001 – 2003, of which 7 are located in the State of Pará. From 2010 – 2012, the spatial statistics scan identiied 14 signiicant clusters for this rate, with homoge-neous concentration among the 5 Brazilian states belonging to the group (Table 1).
Table 1. Clusters most signiicant statistically* deined by using the spatial scan statistic, according to indicators and periods.
2001 – 2003 2010 – 2012
Cluster – Central municipality (FU)
N. of municipalities
Annual rate
Relative risk
Cluster – Central municipality (FU)
N. of municipalities
Annual rate
Relative risk
Taxa de incidência 1. Canaã dos
Carajás (PA) 8 292.5 3.20 1. Marituba (PA) 1 221.6 3.76
2. Açailândia (MA) 15 201.6 2.23 2. Nova Guarita (MT) 12 155.1 2.63
3. Jacundá (PA) 9 267.2 2.92 3. Itinga do
Maranhão (MA) 4 141.7 2.40
4. Brejo de Areia
(MA) 29 230.1 2.49 4. Bom Jardim (MA) 11 110.1 1.87
5. Conceição do
Araguaia (PA) 14 156.5 1.72 5. Sinop (MT) 5 129.4 2.19
Taxa de incidência em < 15 anos 1. Canaã dos
Carajás (PA) 8 104.4 4.15 1. Dom Eliseu (PA) 5 53.7 3.16
2. Açailândia (MA) 15 65.6 2.63 2. Conceição do Lago.Açu (MA) 34 31.8 1.91
3. Jacundá (PA) 9 76.9 3.05 3. Canaã dos Carajás (PA) 8 44.9 2.63
4. Brejo de Areia (MA) 29 49.4 1.96 4. Jacundá (PA) 9 35.2 2.05
5. Conceição do
Araguaia (PA) 14 76.3 2.97 5. Jacareacanga (PA) 1 96.5 5.54
Taxa de casos novos com grau 2 de incapacidade
1. Monte Negro (RO) 5 20.1 5.40 1. Marituba (PA) 1 22.3 7.01
2. Marituba (PA) 1 21.8 5.79 2. Bela Vista do
Maranhão (MA) 2 33.3 10.28
3. Açailândia (MA) 15 8.8 2.38 3. Carlinda (MT) 9 10.8 3.35
4. São Luís Gonzaga
do Maranhão (MA) 5 12.5 3.33 4. Ruronópolis (PA) 1 20.2 6.23
5. São João dos
Patos (MA) 1 34.2 8.97
5. Rolim de Moura
(RO) 3 14.8 4.58
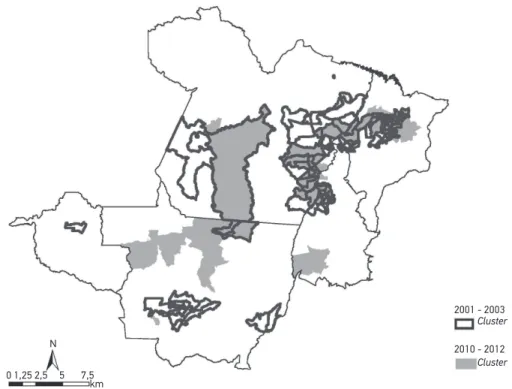
Figure 2 shows the 15 most signiicant clusters for the incidence rate of leprosy, from 2001 – 2003 and 2010 – 2012. Of these, the overlapping of three clusters with the same main municipality stands out (Marituba, Altamira and Paragominas), located in the State of Pará, and the city of Araguaiana, in Mato Grosso, which are among the 15 most signiicant clus-ters. From 2001 – 2003, the most signiicant cluster included eight municipalities in Pará. On the other hand, from 2010 – 2012, the most signiicant cluster included only the city of Maratuba, located in the Metropolitan region of Belém.
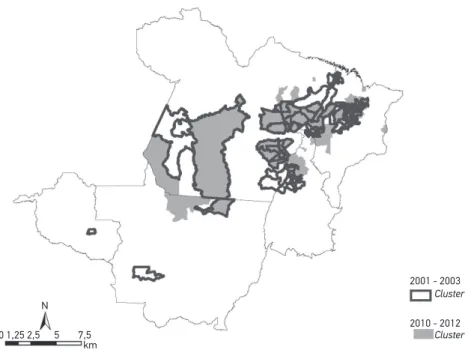
Figure 3 shows the 15 most signiicant clusters for the incidence rate of leprosy in adolescents aged less than 15 years from 2001 – 2003 and 2010 – 2012. Of these, the overlapping of three clusters with the same main city stands out (Itaituba, Marituba and São João do Araguaia), located in the State of Pará, and the city of Ariquemes, in Rondônia. From 2001 – 2003, the most signiicant cluster included eight cities in Pará. On the other hand, from 2010 – 2012, the most signiicant cluster included ive cities, also located in Pará.
Figure 4 shows the 14 most signiicant clusters for the rate of new cases with grade 2 disabilities, between 2001 – 2003 and 2010 – 2012. Of these, the overlapping of only one cluster with the same main municipality stands out, located in the city of Marituba (Pará). From 2001 – 2003, the most signiicant cluster included ive cities of Rondônia. On the other hand, from 2010 – 2012, the most signiicant cluster included only the city of Marituba (Pará).
0 1,25 2,5 5 7,5 km
2001 - 2003
Cluster
Cluster
2010 - 2012 N
0 1,25 2,5 5 7,5 km
2001 - 2003
Cluster
Cluster
2010 - 2012 N
Figure 3. Most signiicant clusters for the incidence rate in adolescents aged less than 15 years (per 100,000 inhabitants), deined by using the spatial scan statistics, according to periods 2001 – 2003 and 2010 – 2012. Brazil, 2001 – 2012.
0 1,25 2,5 5 7,5 km
2001 - 2003
Cluster
Cluster
2010 - 2012 N
There was an overlap of 17 clusters with the same main municipality for the 3 indica-tors in the period of 2010 – 2012. The States of Mato Grosso, Maranhão and Pará stand out, which, together, concentrated 13 of these clusters. On the other hand, among the indica-tors incidence rate and rate of new cases with grade 2 disabilities, there was an overlap of 11 clusters with the same main municipality in the period of 2010 – 2012.
DISCUSSION
This study analyzed the group of Brazilian municipalities that concentrates 34.6% of all cases of leprosy notiied in the country, from 2001 – 2012. In this group, 58% of the cities were classiied as hyperendemic, in both analyzed periods. The spatial analysis allowed to identify the statistically signiicant clusters for the three indicators analyzed. In this analy-sis, the States of Pará and Mato Grosso stood out, which, together, presented the highest number of clusters for the incidence rate of leprosy, in both periods. Besides, some clus-ters were identiied (n = 17) in which there were overlaps of high rates for the three indi-cators analyzed.
is worth to mention the overlapping of clusters with high rates for the three indicators analyzed in this study, showing high risk of incidence of leprosy, active transmission of the disease and late diagnosis.
Several explanations can be given for these indings. Among them, some stand out:
1. the ones connected with the social vulnerabilities of the geographic areas;
2. those related with quality of health care;
3. the ones related with the quality of information in health as an element of distortion of the results analyzed.
As to the social vulnerabilities of the population, several studies have been pointing out to its association with the risk of leprosy6,9,25-31. In particular, Freitas et al.9, in a recent national study, mention some ecological aspects signiicantly associated with higher inci-dence rates of leprosy among the cities in Brazil. In this matter, the authors highlight higher rate ratios between cities with high levels of illiteracy, larger population, higher pro-portion of households with inadequate sanitation, higher levels of urbanization, higher mean number of people per rooms in the households, and more income inequality, mea-sured by the Gini Index9. Besides, Silva et al.32, in an ecological study carried out in the Brazilian Amazon, describe there is evidence of association between intensive deforesta-tion and high incidence rates of leprosy, also highlighting the precarious social condi-tions of the cities analyzed32. Therefore, according to this reference, the explanations for the persistence of leprosy in statistically signiicant clusters for decades, described in this study and by other authors, may be a consequence of the persistence of poverty pockets and precarious life conditions of these populations. Therefore, the initiatives to face that should include actions of income distribution, social inclusion and improvement of life conditions in general.
As to the explanations related with the quality of health care, it is important to consider that, even though there is not an efective vaccine, leprosy is treatable, and the treatment is free in the entire country. When associated with other control measurements, it strongly limits the transmission potential of the disease33. Therefore, it is plausible to assume that qualiied health care, guided by equity, has the potential to increase the healing chances and to minimize the exposure of the population to the sickness. The early diagnosis of the con-dition, adherence to treatment (followed by non-abandonment) and the strengthening of prevention actions and disease control are certainly relevant elements that can contribute with the control of leprosy in the more vulnerable Brazilian populations. The lack of these elements may, in a way, explain the persistence of leprosy for at least ten years in some clus-ters identiied in this study and by other authors7,10,22.
geographically diicult to access, therefore making it diicult to reach the health services. Freitas et al.9 observed a gradient increment in the incidence rates of leprosy (attenuated) in the Brazilian cities when the proportion of coverage of the Family Health Program (PSF) units increased, and when the percentage of examinated contacts increased9,34. This fact may point to the existence of under-notiication of cases, which, gradually, may be over-come when the basic care services improve their ability and quality. Even though this study adopted the term “incidence rate” for the new notiied cases, these indings reinforce the idea that this measure relects both the incidence of the disease and the ability of detecting new cases. The motivation was used to give relevance to these outcomes, such as popula-tion morbidity load, ad not only statistics of notiied cases. On the other hand, it is import-ant to notice that the “incidence rate” of leprosy estimated here is an underestimation of the real incidence rate, since it is based only on the notiied cases33. Besides, Richardus and Habbema35 warn us that the trends in the detection rates of new cases of the disease only relect the trend in the incidence rates, unless there is not any major change in the proba-bility of detecting cases throughout the studied years.
Other limitations may be related with the methodological options of this study, which used the municipality as the smallest unit of analysis. It is worth to remember that, even inside the Brazilian municipalities, important variations of the leprosy indicators can be found and require an analysis. In fact, a study conducted in the municipality of Castanhal (Pará) identiied an intra-municipal heterogeneity in the distribution of leprosy, with sig-niicant clusters of high and low rates of disease detection8. Therefore, an intra-municipal description of the clusters identiied as signiicant in this study should be approached in fur-ther analyses. Besides, the interpretation of the “persistence” of a speciic cluster should be seen considering that clusters are deined based on a main municipality. Another limitation, related with the scan spatial statistics, is that clusters are always deined as circles or ellipses. In this sense, an area with low frequency of cases surrounded by areas with a higher num-ber of cases can be included in a cluster, even though their characteristics may be diferent17. Besides, the scan spatial statistics uses the geographic coordinates of the municipality as a geographic reference, which may not relect the real distribution of cases inside the cities7.
Some of the limitations can be minimized by the conduction of more detailed analysis in the cities involved in the identiied clusters, therefore allowing identifying the proile of the disease and deining more speciic control strategies.
CONCLUSION
allows relecting about the quality of information and surveillance systems, and points to new strategies of investigation in this theme.
ACKNOWLEDGMENTS
The authors would like to thank the Health Surveillance Secretariat (SVS) in the Brazilian Ministry of Health, for providing the data.
1. Brasil. Ministério da Saúde. Portaria Conjunta no 125,
de 26 de março de 2019, que deine ações de controle da hanseníase. Brasília: Ministério da Saúde; 2009.
2. Walker SL, Lockwood DNJ. The clinical and immunological features of leprosy. Br Med Bull 2006; 77-78(1): 103-21. DOI: 10.1093/bmb/ldl010
3. World Health Organization (WHO). Global leprosy update, 2014: need for early case detection. Wkly Epidemiol Rec 2015; 90(36): 461-76.
4. Bakker MI, May L, Hatta M, Kwenang A, Klatser PR, Oskam L, et al. Genetic, household and spatial clustering of leprosy on an island in Indonesia: a population-based study. BMC Med Genet 2005; 6: 40. DOI: 10.1186/1471-2350-6-40
5. Fischer EAJ, Pahan D, Chowdhury SK, Richardus JH. The spatial distribution of leprosy cases during 15 years of a leprosy control program in Bangladesh: an observational study. BMC Infect Dis 2008; 8: 126. DOI: 10.1186/1471-2334-8-126
6. Queiroz JW, Dias GH, Nobre ML, Dias MCDS, Araújo SF, Barbosa JD, et al. Geographic information systems and applied spatial statistics are eicient tools to study Hansen’s disease (leprosy) and to determine areas of greater risk of disease. Am J Trop Med Hyg 2010; 82(2): 306-14. DOI: 10.4269/ajtmh.2010.08-0675
7. Alencar CH, Ramos Jr AN, Santos ES, Richter J, Heukelbach J. Clusters of leprosy transmission and of late diagnosis in a highly endemic area in Brazil: focus on diferent spatial analysis approaches. Trop Med Int Health 2012; 17(4): 518-25. DOI: 10.1111/j.1365-3156.2011.02945.x
8. Barreto JG, Bisanzio D, Guimarães LS, Spencer JS, Vazquez-Prokopec GM, Kitron U, et al. Spatial analysis spotlighting early childhood leprosy transmission in a hyperendemic municipality of the Brazilian Amazon region. PLoS Negl Trop Dis 2014; 8(2): e2665. DOI: 10.1371/journal.pntd.0002665
9. Freitas LR, Duarte EC, Garcia LP. Leprosy in Brazil and its association with characteristics of municipalities: ecological study, 2009-2011. Trop Med Int Health 2014; 19(10): 1216-25. DOI: 10.1111/tmi.12362
10. Penna ML, Oliveira ML, Penna GO. The epidemiological behaviour of leprosy in Brazil. Lepr Rev 2009; 80(3): 332-44.
11. Brasil. Ministério da Saúde. Saúde Brasil 2013: uma análise da situação de saúde e das doenças transmissíveis relacionadas à pobreza. In: Distribuição espacial das doenças relacionadas à pobreza no Brasil. Brasília: Ministério da Saúde; 2014. p. 287-324.
12. Brasil. Ministério da Saúde. DATASUS; Portal da Saúde 2014. [Internet]. Disponível em: http://tabnet.datasus. gov.br (Acessado em 20 março de 2014).
13. Brasil. Instituto Brasileiro de Geograia e Estatística (IBGE). Sinopse do Censo Demográico 2010. Brasília: IBGE; 2011.
14. Kulldorf M, Nagarwalla N. Spatial disease clusters: detection and inference. Stat Med 1995; 14(8): 799-810.
15. Kulldorff M. A spatial scan statistic. Commun Stat Theory Methods 1997; 26(6): 1481-96. DOI: 10.1080/03610929708831995
16. Scheelbeek PFD, Balagon MVF, Orcullo FM, Maghanoy AA, Abellana J, Saunderson PR. A retrospective study of the epidemiology of leprosy in Cebu: an eleven-year proile. PLoS Negl Trop Dis 2013; 7(9): e2444. DOI: 10.1371/journal.pntd.0002444
17. Br asil. Ministério da Saúde. Secretaria de Vigilância em Saúde. Departamento de Vigilância Epidemiológica. Sistema de Informação de Agravos de Notificação–Sinan: normas e rotinas. Brasília: Ministério da Saúde; 2006.
18. Kulldorf BM. SaTScan User Guide for version 9.3. [Internet]. Disponível em: http://www.satscan.org (Acessado em 14 de maio de 2014).
19. ArcGis 9.2. [computer prog r am]. Redlands (CA): ESRI; 2010.
20. Radis comunicação e saúde. Problema persistente. Revista Radis 2015. [Internet]. Disponível em: http:// www6.ensp.iocruz.br/radis/revista-radis/150/ reportagens/problema-persistente (Acessado em 22 de outubro de 2015).
21. World Health Organization (WHO). Week ly epidemiological record. Geneva: WHO; 2010; 85(35): 337-48.
22. Alencar CH, Ramos AN, Barbosa JC, Kerr LR, Oliveira ML, Heukelbach J. Persisting leprosy transmission despite increased control measures in an endemic cluster in Brazil: the uninished agenda. Lepr Rev 2012; 83(4): 344-53.
23. Cury MRCO, Paschoal VDA, Nardi SMT, Chierotti AP, Rodrigues AL, Chiaravalloti-Neto F. 2012. Spatial analysis of leprosy incidence and associated socioeconomic factors. Rev Saúde Pública 2012; 46(1): 110-8. DOI: 10.1590/S0034-89102011005000086
24. Duarte-Cunha M, Souza-Santos R, Matos HJ, Oliveira ML. Aspectos epidemiológicos da hanseníase: uma abordagem espacial. Cad de Saúde Pública 2012; 28(6): 1143-55. DOI: 10.1590/S0102-311X2012000600013
25. Ponnighaus JM, Fine PE, Sterne JA, Bliss L, Malema SS, Kileta S. Incidence rates of leprosy in Karonga District, northern Malawi: patterns by age, sex, BCG status and classiication. Int J Lepr Other Mycobact Dis 1994; 62(1): 10-23.
26. Kerr-Pontes LR, Barreto ML, Evangelista CM, Rodrigues LC, Heukelbach J, Feldmeier H. Socioeconomic, environmental, and behavioural risk factors for leprosy in North-east Brazil: results of a case-control study. Int J Epidemiol 2006; 35(4): 994-1000. DOI: 10.1093/ ije/dyl072
27. Imbiriba EN, Silva AL, Souza WV, Pedrosa V, Cunha M G, Garnelo L. Desigualdade social, crescimento urbano e hanseníase em Manaus: abordagem espacial. Rev Saúde Pública 2009; 43(4): 656-65. DOI: 10.1590/ S0034-89102009005000046
28. Sales AM, Ponce de Leon A, Duppre NC, Hacker MA, Nery JA, Sarno EM, et al. Leprosy among patient contacts: a multilevel study of risk factors. PLoS Negl Trop Dis 2011; 5(3): e1013. DOI: 10.1371/journal.pntd.0001013
29. Suzuki K, Akama T, Kawashima A, Yoshihara A, Yotsu RR, Ishii N. Current status of leprosy: epidemiology, basic science and clinical perspectives. J Dermatol 2012; 39(2): 121-9. DOI: 10.1111/j.1346-8138.2011.01370.x
30. Moura ML, Dupnik KM, Sampaio GA, Nóbrega PF, Jeronimo AK, Miranda Dantas RL, et al. Active surveillance of Hansen’s Disease (leprosy): importance for case inding among extra-domiciliary contacts. PLoS Negl Trop Dis 2013; 7(3): e2093. DOI: 10.1371/ journal.pntd.0002093
31. Cabral-Miranda W, Chiaravalloti Neto F, Barrozo LV. Socio-economic and environmental efects inluencing the development of leprosy in Bahia, north-eastern Brazil. Trop Med Int Health 2014; 19(12): 1504-14. DOI: 10.1111/tmi.12389
32. Silva DR, Ignotti E, Souza-Santos R, Hacon SSouza. Hanseníase, condições sociais e desmatamento na Amazônia brasileira. Rev Panam Salud Publica 2010; 27(4): 268-75. DOI: 10.1590/S1020-49892010000400005
33. Noordeen SK. Elimination of leprosy as a public health problem: progress and prospects. Bull World Health Organ 1995; 73(1): 1-6.
34. Nery JS, Pereira SM, Rasella D, Penna ML, Aquino R, Rodrigues LC, et al. Efect of the Brazilian conditional cash transfer and primary health care programs on the new case detection rate of leprosy. PLoS Negl Trop Dis 2014; 8(11): e3357. DOI: 10.1371/journal.pntd.0003357
35. Richardus JH, Habbema JD. The impact of leprosy control on the transmission of M. leprae: is elimination being attained? Lepr Rev 2007; 78(4): 330-7.
Received on: 05/23/2016