DETERMINANTS OF GLOBAL DEVELOPMENT IN HUMAN MOTIVATION
ŢÂMPU DIANA LARISA
POSTDOCTORAL RESEARCHER, THE ROMANIAN ACADEMY
Bucharest, Romania
[email protected]
Abstract
We live in a world were manner of use of information is crucial in determining the level of performance. Each country around the globe uses a proper way of spreading information and communication. Studies present the Information and Communication Technology (ICT) indicator the proper tool to provide an objective evaluation of the countries performance. The question that this research wants to answer is what are the main ways of motivation (extrinsic and intrinsic) in countries where ICT Development Index reaches the highest values in the last 2 years. In this way, we want to verify if ICT has different predictors and different possible consequence that depend on human motivation. Thus relying on calculations made by the International Telecommunication Union for ICT and key factors of motivation this paper will present if there is any relationship between citizens motivation and ICT. This hypothesized model will be illustrated with data from thirty developed countries.
Keywords: information society, ICT, motivation, Regression analysis, behavioral economic
JEL Classification: D03, O11
1.Introduction
The formers years have been characterized by the constant growth in the spread of information and communication technology. The analysis of information and communication technology (ICT) at the economy level brings growing awareness as the spread of the Internet grows immediately (Kauffman & Kumar, 2005). Way to measure ICT was a concern of the researchers from Grigorovici, Constantin, Jayakar, Taylor & Schement (2004) till the early Wu & Chu (2010). In order to scale ICT developments at different levels, there can be identified studies that use absolute score (Dragomirescu & Sharma, 2009; Gerami, 2010). The International Telecommunication Union (ITU) states that each country tries to improve its telecommunications sector (ITU, 2002). By using absolute scores, each one is able to report an increase in ICT infrastructure (UNCTAD, 2003).
The ICT Development Index (IDI) is a composite index combining 11 indicators into one benchmark pattern. The IDI purpose is to control and analyze developments in information and communication technology (ICT) across countries. The indicator was first stated by ITU in 2008 and introduced in the 2009 edition of Measuring the Information Society (ITU, 2009). Its main objectives are to measure the level of development over time of ICT, the progress in both developed and developing countries, as well as the potential development that a country may have.
In order to see if IDI is influenced by the country citizens, their way of being productive, and their ways of life, we analyzed the relation between it and GDP/hour worked, Engagement, Life satisfaction. The objective
of this study is to take ICT Development Index (IDI), which ranks countries’ performance with regard to ICT infrastructure, use and skills (ITU, 2014) and to verify if it have different predictors and different possible consequence that depend on human motivation.
Although in the last hundred years there has been a revolution in the concept of "rewards" and its
meaning in organizational context, there isn’t any valid method that measure motivation of citizens at the macroeconomic level. Assuming that on the based theories underlying motivations are the people needs (Maslow A.H., 1943), their attitude to work (McGregor D., 1960), the factors that influence their satisfaction at work understood as emotional state (Herzberg F., 1959) or their expectations (Vroom, V. H., 1964) we have chosen three particular indicators that we may assume to measure citizens motivation: GDP/hour worked, Engagement, Life satisfaction. All of them are social indicators measured by OECD. Measuring feelings can be very subjective, but is the only way in which we can quantify a personal evaluation of an individual motivation. The idea of choosing those three indicators relies on the expectations theory of Vroom (1964).
Our assumption was based on the following:
• The GDP/hour worked measure the productivity of the population for the entire economy. In the
• The opinion that every individual has about himself and about the possibility to achieve a given
objective from which he submits certain efforts will be measured by Engagement. Individuals are not motivated to work if their results aren’t as expected, in this way their engagement in work will be lower.
• The relationship between each individual and his work result will be measured using: Life
satisfaction. Each individual attaches a certain characterization to his results, a certain amount of reward. In terms of motivation theory, the way that a particular experience influences an individual in a positive or negative way can be quantified using life satisfaction indicator. These experiences have the ability to motivate people to pursue and reach their goals.
According to the expectations theory, motivation at work keeps one hand on the relationship between employee beliefs and efficiency efforts and another one on the importance given to different forms of reward. So, in order to determine what make an individual to make efforts to perform tasks that contribute to the efficiency of an organizational subunit assembly, to the organization to which belongs, and in the end to its country development we will rely on the above assumptions.
2.Research methodology
The question that this research wants to answer is if there is any direct correlation between motivation and development measured by ICT Development Index. For doing this, we have used IDI provided by ITU (2014) in order to measure the developments in information and communication technology.
The idea that developments in information and communication technology should be gain by human motivation will be illustrated from an empirical point of view with data from thirty developed countries around the globe (Australia, Austria, Belgium, Canada, Chile, Czech Republic, Denmark, Estonia, Finland, France, Germany, Hungary, Iceland, Ireland, Israel, Italy, Japan, Luxembourg, Mexico, Netherlands, Norway, Poland, Portugal, Slovak , Romania, Spain, Sweden, Switzerland, Turkey, United Kingdom).
Concerning the relationship between ICT development index and human motivation, were formulated and tested in this study the following hypotheses:
H1. There is a correlation between the extents to which Life satisfaction influences IDI. H2. There is a correlation between the GDP/hour worked and IDI.
H3. There is a correlation between Engagement and IDI. H4. IDI can be predicted using motivation indicators
In order to response to the first three assumptions we have analyzed the strength of association between the two elements: IDI and motivation, using 2 correlation coefficient: Spearman and Pearson. The last hypothesis was tested using an automatic linear modeling procedure. All the hypotheses above were tested using Statistical Package for Social Sciences (SPSS). The dependent variable is IDI, the three independent variables are: GDP/hour worked, Engagement, Life satisfaction. In the end, in order to choose what method is best, we will use the method of least errors.
The time frame of the analysis is directly influenced by the data availability. Although the results presented in this paper are relevant and of great interest, a limit of the research is represented by the reduced timeframe ( 2012 and 2013) of 30 countries.
3.Results and discussion
As we have assumed there is a direct strong relationship between IDI and motivation.
First of all we have used Spearman correlation as the data range has only 30 cases. Spearman is a coefficient based on the rank, is not influenced by average representativeness and is generally used when the research group is small (less than 30 cases) ( Spearman, 1987)
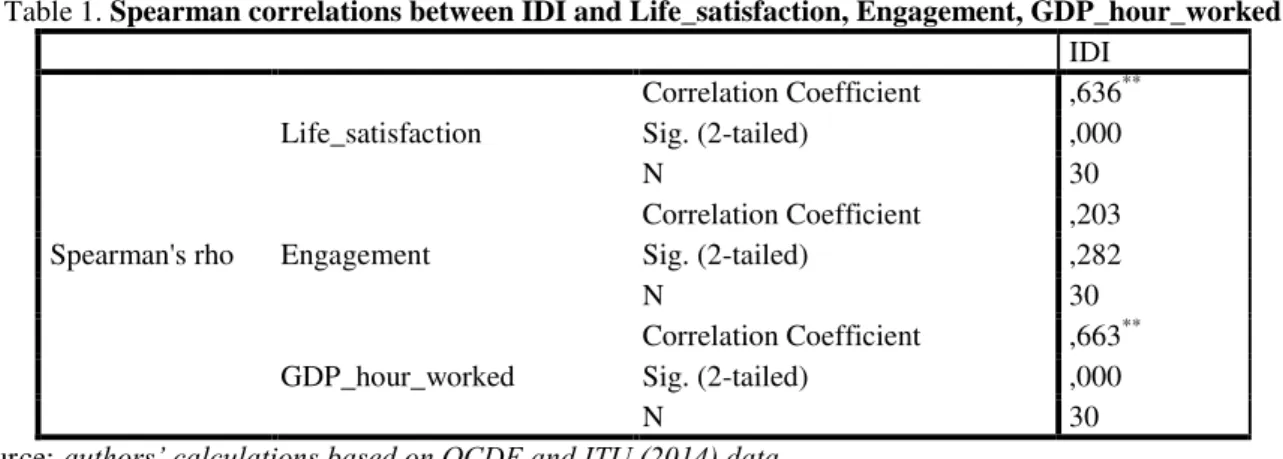
Table 1. Spearman correlations between IDI and Life_satisfaction, Engagement, GDP_hour_worked IDI
Spearman's rho
Life_satisfaction
Correlation Coefficient ,636**
Sig. (2-tailed) ,000
N 30
Engagement
Correlation Coefficient ,203
Sig. (2-tailed) ,282
N 30
GDP_hour_worked
Correlation Coefficient ,663**
Sig. (2-tailed) ,000
N 30
After the calculation, we can admit that we have a positive correlation between Life_satisfaction and IDI (Coefficient of 0,636) and between GDP_hour_worked and IDI (Coefficient of 0,663). There cannot be identified a correlation between Engagement and IDI (Coefficient of 0,282). We can accept the significance of this correlation only if we have significance threshold lower than 0.01. For both ones, the value of Sig. (2-tailed) is zero, so we can admit that we have a significant statistics for Life_satisfaction and GDP_hour_worked. In this case, we admit that the hypothesis 1 and 3 are accepted and we reject the hypothesis 2.
In order to verify the degree of contingency of the above variables, checking whether they are associated as in the presented hypothesis or not, we have calculated Pearson correlation also. The results were similar like in the Spearman correlation. There is a strong connection between Life_satisfaction and IDI and between GDP_hour_worked and IDI. For both ones, the value of Sig. (2-tailed ) is below 0.05, so the statistic is significant.
Table 2. Pearson correlations between IDI and Life_satisfaction, Engagement, GDP_hour_worked IDI
Life_satisfaction
Pearson Correlation ,507**
Sig. (2-tailed) ,004
N 30
Engagement
Pearson Correlation ,176
Sig. (2-tailed) ,352
N 30
GDP_hour_worked
Pearson Correlation ,624**
Sig. (2-tailed) ,000
N 30
**. Correlation is significant at the 0.01 level (2-tailed). Source: authors’ calculations based on OCDE and ITU (2014) data
The fact that there is a correlation between these indicators can also be observed also from the below graphs. From the upward trendline in both situation we can conclude that the more GDP_hour_worked and Life satisfaction increase, the more increase we have in IDI.
Figure 1. Correlation between Life_satisfaction. GDP_hour_worked and IDI
Source: authors’ calculations based on OCDE and ITU (2014) data
In order to test the Hypothesis 4, we have used a multiple automatic linear modeling procedures in
SPSS. For doing this, we ensured that our data “passes" the six assumptions that are required for linear
regression to give a valid result (Seber G.A.F., Lee A.J., 2003). 1. The variables are measured at the continuous level.
2. There is a linear relationship between variables.
3. There are no significant outliers in our data. Even if there are some outliers we don’t consider them to be
significant because we have detected those using SPSS statistics.
4. There is independence of observations (verified through Watson statistic). The value of Durbin-Watson test is 2,104 (Table 3). The general rule is that the residuals are uncorrelated is the Durbin-Durbin-Watson statistic is approximately 2, so indicating in our case a no serial correlation. (Watson D., 1950).
5. The fifth assumption tests the homoscedasticity – meaning the variances along the line of the variables. As
Figure 2. Homoscedasticity scatterplot
Source: authors’ calculations based on OCDE and ITU (2014) data
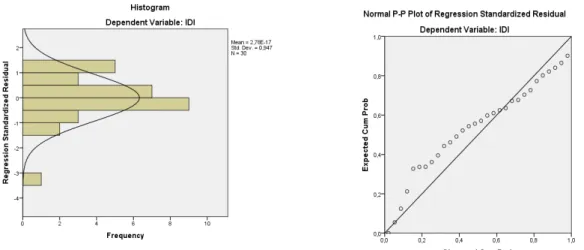
6. The last assumption that we have verified was the residuals (errors) of the regression line in order to verify if they are or not approximately normally distributed. We have done that using both the histogram and the Normal P-P Plot.
Figure 3. Residual analyses plot ( Histogram and P-Plot)
Source: authors’ calculations based on OCDE and ITU (2014) data
As can be seen from the graph that shows the histogram of residues, we see that the distribution is symmetric, which means that it is normal and the errors are normally distributed for the tested data, with a mean around the zero value. Finally, we have the Normal P-P Plot of Regression Standardized Residual values. As we expected, the values are very close to the reference line, which indicate very little deviation of the expected values from the observed values.
The detailed regression results are summarized in Table 3,4 and 5. Table 3. Regression Model Summaryb M
od el
R R
Square
Adjusted R Square
Std. Error of the Estimate
Change Statistics
Durbin-Watson R
Square Change
F Change df1 df2 Sig. F Chang e
1 ,669a ,448 ,407 ,8103248 ,448 10,935 2 27 ,000 2,104 a. Predictors: (Constant), GDP_hour_worked, Life_satisfaction
b. Dependent Variable: IDI
Source: authors’ calculations based on OCDE and ITU (2014) data
The adjusted Multiple Correlation squared (R2=0,448) refers to the combined correlation of each predictor with the IDI. So 44.8% of the variance of IDI is accounted for GDP/hour worked, Life satisfaction. I consider that the value computed for R2 it is a little bit optimistic, and I presume that the value of Adjusted R2 to be a more realistic one: 40.7%.
Model Sum of Squares df Mean Square F Sig.
1
Regression 14,360 2 7,180 10,935 ,000b
Residual 17,729 27 ,657
Total 32,089 29
a. Dependent Variable: IDI
b. Predictors: (Constant), GDP_hour_worked, Life_satisfaction Source: authors’ calculations based on OCDE and ITU (2014) data
In the ANOVA table, the most important statistic is the significance F – which is used to test the significance of the independent variables. The computations indicates that our model's R² is significantly different from zero ( F(2,27) = 10,935, p<.0005 which is less than 0.05, and indicates that, overall, the regression model statistically significantly predicts the outcome variable).
Table 5. Regression coeffiecientsa
Model Unstandardized
Coefficients
Standardize d
Coefficients
t Sig. 95,0% Confidence
Interval for B
B Std. Error Beta Lower
Bound
Upper Bound
1
(Constant) 3,946 1,183 3,335 ,002 1,518 6,373
Life_satisfaction ,331 ,196 ,274 1,689 ,003 -,071 ,733 GDP_hour_wor
ked ,028 ,009 ,495 3,052 ,005 ,009 ,047
a. Dependent Variable: IDI
Source: authors’ calculations based on OCDE and ITU (2014) data
The coefficients table provides the necessary information to predict IDI from GDP/hour worked, as well as whether these ones contribute statistically significantly to the model. As can be observed the variable
“Engagement” was excluded in the final model, as his coefficient in a previous computation seems to be zero.
The equation for the current model is:
IDI = 3,946+.331 Life_satisfaction+0,28 GDP_hour_worked (1)
Therefore, a coefficient is significant (non-zero in the equation of the regression) where Sig <α. Our
materiality threshold is α = 0.05. From our computation, we have the following situation for Sig. : - For constant, Sig = .002<.05 that implys the facts that we reject the hypothesis of nullity for
constant;
- Life satisfaction, Sig = .003 <.05 that implys the facts that we reject the hypothesis of nullity for Life satisfaction.
- GDP_hour_worked, Sig = ,005<.05 that implys the facts that we reject the hypothesis of nullity for GDP_hour_worked.
All coefficients are lower than the materiality threshold, meaning that they are significant. In the end, after all, the tests we assume that we can accept hypotheses 4: IDI can be predicted using motivation indicators. The remain variables that seem to influence IDI in our test were: GDP/hour worked, Life satisfaction.
4.Conclusion and Recommendations
In order to find if there is any relationship between citizen’s motivation and ICT we have done an
empirical research on thirty developed countries around the world with the highest ICT. The numerical stability of the algorithm used in this research was conducted according to the sensitivity of the rounding errors and other numerical uncertainties that may
appear in the calculation.
In the end, in order to see how well these methods describe our supposition we have analyzed RMSE and MSE. RMSE value is 0.810. We use it because unlike R-squared that is a relative measure of fit, RMSE is an absolute measure of fit. 0.810 – is the unexplained variance of the model – which signify a good fit of the model. We are conscious that the value of RMSE just qualify the model and not classify it in trusted or untrusted.
to which basic needs are met and the degree to which a variety of other purposes is inspected as attainable. According to Maslow and Herzberg theories, the degree of motivation in this countries is high. In addition, improving motivation will conduct to improving Life satisfaction – that might give rise to a better economic development, a better way of spreading information and communication.
In order to analyze the aspects that influence Life satisfaction, we had put into discussion the micro-social domains first that link the macroeconomic indicator with the citizens. The most important one is income. The macroeconomic theory states that, as income and consumption increase, a greater number of needs can be satisfied, and, by definition, the motivation of the people increases as well. In this way, we can argue that IDI is small in particular countries because the level of income is small. Deaton (2008), reveal a particularly strong relationship between income and life satisfaction among ‘low-income’ countries – that can be successfully continued with also a strong correlation between Life satisfaction and IDI. People from countries where IDI has a
low value aren’t enough motivated by their income in order to satisfy their basic needs.
Work-related conditions are another element that influence Life satisfaction, and that is influenced and influence people motivation. Clark & Oswald (1994) assume that the consequence of being jobless, at any level, is statistically important and negatively connected with Life satisfaction. Work is central to individual identity, social roles, and social status, it influences people attitude to work and their motivation. In countries were IDI reaches a low value can be easily correlated with countries with a high level of unemployment, poor work conditions. Jobs satisfaction – the way in which people like or dislike their jobs (Spector, 1997) is another important element of Life satisfaction. A high income, but with a low level of satisfaction at work is similar to a low level of motivation and in the end with a low level of IDI.
Macroeconomic life domains that influence Life satisfaction and IDI are personal and cultural values, macro-social and political conditions, economic inequality, macro-social expenditures and political freedom (Haller & Hadler,
2006). This conception can also be reduced to Maslow’s hierarchy of needs – and motivation theory. What have
in common countries with a high IDI are good’ governance performance, high life expectancy, low infant mortality, strong credibility in the government. All of these, records low levels in countries where IDI is low (Romania had an IDI of 5.83 in 2013, in contrast to Denmark which had a level of 8.86 (ITU, 2014)). The solution required to improve human motivation at the macroeconomic level – so that the whole matrix of indicators would rise, is to improve the perception that citizens have in legal system, educational system, social security system and healthcare services.
At the microeconomic level – the solution in order to improve human motivation may rely on organizations. But it is not about the organization but about the people from that particular organizations. There is no performance organization in the world unless employment aren’t professionals, if they don’t like in working one with another. This is why it is so important that people to be motivated. The market framework is changing. Inadequacy at these trends relies on low level of development in any field, but the determinants of high macroeconomic indicators stand in the area of citizens and their motivation.
5. Acknowledgment:
This work was financially supported through the project "Routes of academic excellence in doctoral and post-doctoral research - READ" co-financed through the European Social Fund, by Sectoral Operational Programme Human Resources Development 2007-2013, contract no POSDRU/159/1.5/S/137926.
6. References
1. Bradley, R.H. & Corwyn, R.F, Life Satisfaction among European American, African, American, Chinese American, Mexican American, and Dominican American Adolescents, International Journal of Behavioral Development, 28 (5), 385-40, 2004;
2. Clark, A.E. & Oswald, A.J., Unhappiness and Unemployment, The Economic Journal, 104 (424), 648-659 , 1994;
3. Damiani E, Avison D, Naeve A, Horner DG. Best Practices for the Knowledge Society. Knowledge, Learning, Development and Technology, All Berlin Heidelberg: Springer; 2009. p. 328–37, 2009; 4. Deaton, A.Income, Health and Well-Being around the World: Evidence from theGallup World Poll,
Journal of Economic Perspectives, 22 (2), 53-72, 2008;
5. Durbin, J.; Watson, G. S., Testing for Serial Correlation in Least Squares Regression, I. Biometrika 37 (3–4): 409–428, 1950;
6. Grigorovici DM, Constantin C, Jayakar K, Taylor RD, Schement JR.InfoMetrics. A structural
7. Heller, D., Judge, T.A. & Watson, D. The Confounding of Personality and TraitAffectivity in the Relationship between Job and Life Satisfaction, Journal of Organizational Behavior, 23 , 815-835. 8. Herzberg F., 1959, The motivation to Work, N-Y, John Wiley and Sons, Vol 47, 2002;
9. International Telecommunication Union (ITU). World telecommunication development report. Geneva, Switzerland: International Telecommunication Union, 2002;
10. International Telecommunication Union (ITU). World telecommunication development report. Geneva, Switzerland: International Telecommunication Union, 2014;
11. Kauffman RJ, Kumar A. A critical assessment of the capabilities of five measures for ICT development. Retrieved from http://www.misrc.umn.edu/workingpapers/abstracts/0506.aspx. , 2005; 12. Martikainen, L. The Many Faces of Life Satisfaction among Finnish Young Adults. Journal of
Happiness Studies, . DOI 10.1007/s10902-008-9117-2, 2008;
13. Maslow A.H. A theory of Human Motivation, Psyhological Review,Harper & Row, pag 370-396,1943; 14. McGregor D.Human. Side of Organization, McGraw-Hill, N.Z., pag 6, 1960;
15. Seber, G. A. F., Lee, A. J. Linear regression analysis, 2nd ed. Wiley, 2003;
16. Spearman, C. The proof and measurement of association between two things, The American journal of psychology 100 (3–4): 441–471,1987;
17. Spector, P.E. Job Satisfaction: Application, Assessment, Causes, and Consequences. Thousand Oaks, California, Sage Publications,1997;
18. United Nations Conference on Trade and Development (UNCTAD). Information and Communication Technology Development Indices. Retrieved April 13, 2010,
http://www.unctad.org/en/docs/iteipc20031_en.pdf 2003. 19. Vroom, V. H. Work and motivation. 1st ed., Jossey-Bass,1964;
20. Wu F-S, Chu W-L. Diffusion models of mobile telephony. J Bus Res ; 63(5):497–501,2010;