A Work Project, presented as part of the requirements for the Award of a Masters Degree in Management from the NOVA – School of Business and Economics.
Non–profit and investment attractiveness – best practices under a national perspective Ana Rita Antunes & 925
A Project carried out on the Management of Non-profit organizations course, under the supervision of:
Miguel Alves Martins
2
Index
Abstract ... 3
Purpose of Project – General Overview ... 4
A brief literature review ... 5
Discussion of the topic ... 7
NPIs across the for–profit sector – the national perspective ... 7
The non-profit sector – national scenario ... 7
Overview ... 8
Methodology ... 8
Results and discussion ... 9
Psi–20 analysis ... 16
Conclusion ... 19
Appendices ... 22
3
Abstract
This Work Project (WP) aims to measure the investment attractiveness of the social sector by providing a general overview of the investment strategies and motivations behind Non-Profit Initiatives (NPIs) performed by the For-Profit sector (FP), usually perceived as corporate social responsibility (CSR). Through the development of a structured survey and a structured analysis of the NPIs performed by Psi–20 companies over the last five years, the final purpose of the project is to provide a set of tools to non-profit organizations to attract investment to their projects.
4
Purpose of Project – General Overview
The aim of this WP is to measure the attractiveness of investment in NPIs by defining a set of conclusions and recommendations to support Non–Profit Organizations (NGOs) to attract investment.
In order to identify the factors and motivations behind NPIs, a deep research was conveyed to identify theories, models and reports on this matter. With the intent of understanding the local perspective, it was performed a deep analysis on strategies associated to NPIs enhanced by companies coted on the Lisbon index, Psi–20, in the last five years. Additionally, a structured survey was conducted to assess specific dimensions of this matter, such as, motivations to perform this type of initiatives enhanced, geographic location, choosing criteria, and reporting methods.
Subsequently, a data analysis will be performed followed by an integration of theoretical and national perspectives to provide insights on the fragilities and similarities of the national approaches for this matter.
5
A brief literature review
NPIs assume various forms, dimensions and models. When performed by the FP sector, NPIs are usually perceived as corporate social responsibility (CSR). The concept of CSR comprehends countless perspectives with diverse focus.
In 1991, Carroll defined CSR as a responsibility that goes above and beyond what is legally required in four main dimensions: economic, legal, ethical and philanthropic responsibilities. Later in 1998, Clarke identified three main perspectives on CSR: profit maximization for shareholders (neoclassical theory), accountability and concerns for all stakeholders and an active promotion of social projects (Fernandes, 2010). Later, Porter and Kramer identified an interrelationship between business and society under a shared value principle considering moral obligation, sustainability, license to operate and reputation (Porter & Kramer, 2006).
The raising significance of CSR is linked with communal and social connotation attached to the etymology of the word “company” and the rise of different business approaches developed in a certain society, affecting its different dimensions and, consequently, determining the number of stakeholders for who the company holds relative responsibility (Asongu, 2007).
6 BCSD, 2006; Asongu, 2007; Fernandes, 2010; Lim, 2010; Oliveira, 2010). Empirical evidence on this matter demonstrated that NPIs increases financial performance, perceived value, and generates notoriety and visibility.
NPIs performed by the FP sector, usually in the form of CSR initiatives, generally assume, as main supporting techniques monetary, contributions such as financial support/donation/grant, commonly associated to specific projects rather than institutions, and non-financial donations such as gender contributions and volunteering, mostly occasional and one–off frequency initiatives related to company’s business activity (Pinto, 2004; Porter & Kramer, 2006). In terms of investment techniques on social matters, there are a wide range of approaches such as socially responsible investment (SRI), impact investment (IM), and social investment (SI), (Achleitner, Heinecke, Noble, Schöning, & Spiess–Knafl, 2011). SRI is a philanthropy investment including non–financial and ethical concerns such as social, environmental or governmental matters when selecting, retaining, or realizing investments (Mansley, 2000; Hudson, 2005). IM defines an intention to generate measurable social and environmental impact besides financial return. Social investment (SI) defines the application of capital to generate financial and social returns, in other words, provide private contributions to public benefit (ACEVO, 2010).
7
Discussion of the topic
So far, it was provided an overview of NPIs on its different dimensions, at this moment, it is important to have a perspective of both the NP and FP sectors.
NPIs across the for–profit sector – the national perspective
KPMG, in 2006, revealed that 25% of the companies listed in Psi–20 published sustainability reports, mainly through independent and integrated reports verified by one of the Big Four audit companies. In terms of reporting standards, GRI was the most commonly used. Also, communication and environmental departments were considered accountable for these matters. The study also highlighted increase reputation and credibility as reasons to produce and verify reports on this matter. Moreover, transport, construction, commerce and banking sectors and industries presented higher concerns on NPIs focused on society and governance, ethics and conduct, social, environmental and economic matters.
Under a FP perspective, the study also identified as main benefits associated to NPIs: boost confidence of investors and financial institutions, compliance with internal/external demands, performance comparisons, more control, creation market opportunities, and attract and retain talent. And as main difficulties: costs and resource constraints, absence of environmental/ sustainability departments, lack of involvement of top management, and transparency requirements.
The non-profit sector – national scenario
The non–profit sector, in Portugal, emerged in the Roman Empire revealing long historical heritage. Its size represent near 3.2 % of national gross domestic product and near 2.8% of the total national Gross Value Added (GVA), in 2010i. In terms resources,
8 they are mainly generated by output. Despite its highly fragmented legal framework, associations and co-operatives are the most common legal structures across the sector. The NP sector faces critical challenges related with its own legal structure, lack of public awareness limited civil society capacity and hostile relationships with the government (Franco, Sokolowski, Hairel, & Salamon).
Overview
NPIs performed by for-profit companies, usually perceived as CSR, is a complex matter involving different perspectives, types of initiatives, supporting techniques, motivations and strategies. The NP sector itself presented increasing importance in the economy despite its complexity and fragmentation. In line this, and as an attempt to understand the different magnitudes of this matter, the following paragraphs will discuss the research method and the results obtained in order to depict tendencies on investment attractiveness in key areas such as target definition, marketing & communication and credibility and transparency.
Methodology
9 The survey, launched in Qualtricsii, was divided in six main areas: characterization of the organization and the sector, description of NPIs, motivations, decision making process and criteria, departments accountable for reporting, communication and reporting methods.
Results and discussion
The analysis on NPIs performed by Psi–20 companies in the last five years was focused on areas of action, supporting techniques, investment and number of activities performed, reporting methods and standards & accreditation and international presence (see figures 10 to 14). Altri, Cofina and Espírito Santo Financial Group were excluded due to the absence of available information on this matter.
Industry and Sector analysis
The evolution of the NPIs in the bank and financial industry evidenced that, although not considered the core area of action, culture occupied a distinct position evidencing a connection with the industry due to the its importance and visibility to a Nation and the ability to target specific and broad targets. Moreover, the investment trends evidenced a straight link between amounts invested and the company’s net result in the sense that the higher net result, the higher investment in NPIs, and the other way around. Also, it was found a straight link between the size of the company and the international presence in the sense that the bigger companies, the stronger and wider international presence.
Area of action Education and Society
Supporting techniques Financial support/donations/grants
Reporting method Integrated report in the management/annual report Reporting standards GRI
Figure 1 – NPIs strategies in the bank and financial industry between 2007 and 2011.
10 The tendencies on NPIs across the Basic materials – Forest products and Paper sector evidenced no trends on reporting methods and standards were identified, possibly due to the different business structures, its communication methods adopted and the late incorporation of social concerns in holdings. Moreover, the investment tendencies revealed a later concern for social matters in holdings contrasting with detailed commitments and initiatives communicated by subsidiaries. Also, no international NPIs were performed possibly justified by the high concentration of the operational activity in Portugal.
Area of action Education and society
Supporting techniques Financial support/donations/grants and sponsorship Reporting method No trend
Reporting standards No trend
Figure 2 – NPIs strategies in the basic materials sector between 2007 and 2011.
Throughout the consumer and retail industry, it can be clearly identified a leader and a follower on which the first exhibit higher international presence and higher number of NPIs despite the lower amounts invested. It was found a straight link between the amounts invested, the number of NPIs enhanced and the company’s net result in the sense that the higher net result, the higher investment in NPIs, and the higher number of NPIs performed, and the other way around. The stronger international presence can be explained by the different internationalization methods.
Area of action Society
Supporting techniques Financial support/donations/grants and sponsorship Reporting method No trend
Reporting standards No trend
11 activity in Portugal. Across this sector can be clearly identified the existence of a leader, a follower and an outsider if reporting standards & accreditation and existence of a corporate foundation are considered as distinction factor.
Area of action Society
Supporting techniques Financial support/donations/grants Reporting method Sustainability report
Reporting standards Existence of reporting standards and accreditation in larger companies
Figure 4 – NPIs strategies in the communications sector between 2007 and 2011.
Within the Electric industry, the tendencies on NPIs identified a homogenization of reporting methods possibly linked with the higher tendencies for reporting standards and accreditation. Concerning the amounts invested, and despite the lack of information for some of the players, it can be depicted a strict relationship between financial performance and investment in NPIs in the sense that the higher net result, the higher investment in NPIs and the other way around. The analysis on international presence, existence of a corporate foundation and accreditation depict the existence of a leader and a follower, inside this industry.
Area of action Society
Supporting techniques Financial support/donations/grants
Reporting method Integrated report in the management/annual report Reporting standards No trends
Figure 5 – NPIs strategies in the electric industry between 2007 and 2011.
For the sake of consistency of this WP, in the remaining industries and sectors, the trends on NPIs are represented by the individual tendencies depicted from the analysis of the only player in the Psi–20 index.
The NPIs trends on the Energy – Alternative sources industry revealed a link between the existence of operational activity and international NPIs.
Area of action Culture, education, sports and society Supporting techniques Financial support/donations/grants
12 Reporting standards GRI
Figure 6 – NPIs strategies in the energy – alternative sources sector from 2007 to 2011. The building materials sector exhibited lack of information and detail on NPIs for 2010 and 2011. Between 2007 and 2009, it was found a link between internationalization method and international NPIs performing NPIs in all countries with operational business activity. Also, it was found a negative relationship between amounts invested in NPIs and financial performance in the sense that the higher financial performance, the lower investment in NPIs, and the other way around.
Area of action Education and society
Supporting techniques Financial support/donations/grants Reporting method Sustainability report
Reporting standards No trends
Figure 7 – NPIs strategies in the building materials sector between 2007 and 2011. The trends on the construction sector revealed a link between internationalization method and international NPIs in the sense that NPIs were performed in all countries with operational business activity. A corporate foundation was created in 2009 to
assume the company’s social image.
Area of action Education and health
Supporting techniques Financial support/donations/grants Reporting method Sustainability report
Reporting standards GRI
Figure 8 – NPIs strategies in the construction sector between 2007 and 2011.
The NPIs tendencies across the oil & gas identified, considering the information available for the last three years, a close relationship between financial performance and the amounts invested in NPIs in the sense that the higher net result, the higher investment in NPIs, and the other way around. Also, it was found a link between the existence of operational activity and international NPIs. The creation of a Galp Energia
foundation in 2009 emphasized the turning point in the company’s NPIs strategy.
13 Supporting techniques Financial support/donations/grants
Reporting method Sustainability report Reporting standards GRI
Figure 9 – NPIs strategies in the construction sector between 2007 and 2011.
Survey – Analysis of the results
The survey was answered by 11 companies out of the 20 listed in the Psi–20 index incorporating the Basic materials – Forest products and Paper, Bank & Financial industry, Communication, Consumer and Retail, Energy – Alternative sources and Electric industries and sectors. The analysis performed (see figure 15 to 19) depicted the main tendencies by industry/sector and index, as a whole.
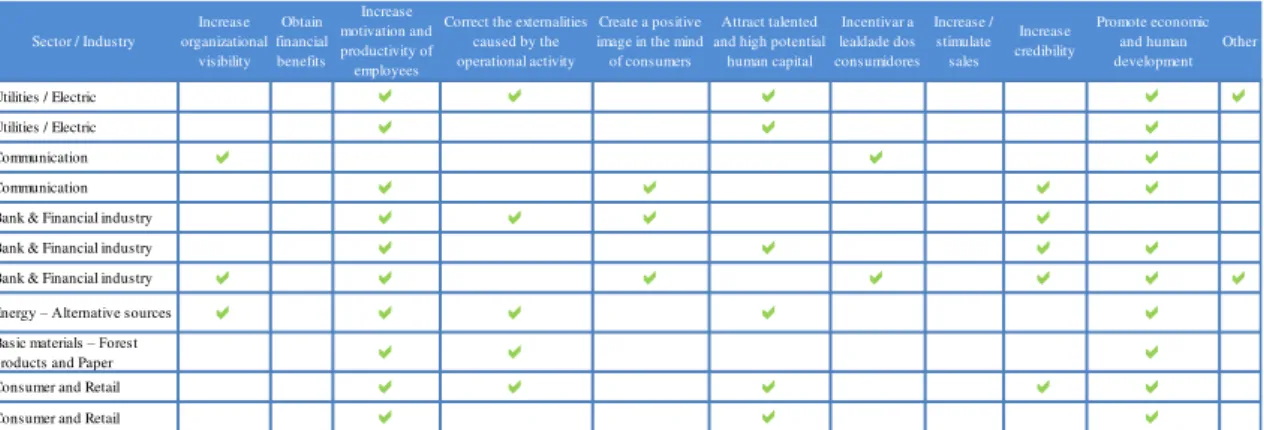
The tendencies on the motivations to perform NPIs revealed that increase motivation and productivity of employees, correct the externalities caused by the operational activity and promote economic and human development were considered across the basic materials – forest and paper; increase the motivation and productivity of employees, increase credibility, and also promote economic and human development and create a positive image in the mind of consumers were identified inside the Bank & Financial industry; promote economic and human development was recognised in the communication sector; increase the motivation and productivity of employees, attract talented and high potential human capital, and promote economic and human development were mentioned across the consumer and retail industry and the electric industry; Finally, increase organizational visibility, increase the motivation and productivity of employees, correct the externalities caused by its operational activity, attract talented and high potential human capital and promote economic and human development were mentioned in the energy – alternative sources sector.
14 financial donations were performed in the communication sector; Finally, both financial and non–financial donations were enhanced in the electric, bank & financial, energy – alternative resources and consumer and retail industries and sectors.
In terms of type of non–financial donations adopted, volunteering activities were chosen in the bank & financial industry; volunteering activities, construction and reconstruction activities, collection campaigns and educational campaigns were adopted in the electric industry; collections campaigns and educational campaigns were implemented in the basic materials – forest products and paper sector; collection and educational campaigns were identified in the energy – alternative resources sector; Finally, volunteering activities, activities inside the surrounding community, collection campaigns, and educational campaigns were enhanced in the consumer and retail sector.
Regarding the type of financial donations adopted, financial support/donations/grants were adopted in the bank & financial, electric, energy – alternative resources; both financial support/donations/grants and fund raising were performed in the communication and consumer and retails industries and sectors.
In terms of the geographic location chosen to perform NPIs, communities affected by
the company’s operational activity were selected across the electric industry and
15 Concerning the motivations to choose a geographic location for its CSR activities, support local development was chosen across the consumer and retail and electric industries and sectors; Promote the organization in the surrounding environment and support a specific social group were identified in the communication sector; support local development, internal local promotion and correct social problems were mentioned by the bank & financial industry; Correct externalities and social problems and support local development were identified in the basic materials – forest products and paper industry; Finally, correct externalities and support local development were chosen in the energy – alternative sources industry.
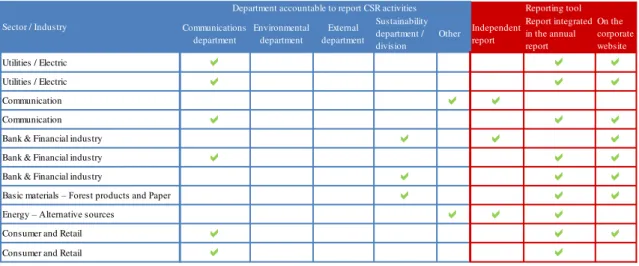
Regarding the department responsible to report NPIs, the communication department was identified across consumer and retail and electric industries and sectors; The sustainability department/division was selected inside the bank & financial industry and basic materials – forest products and paper sector; both communication department and other were chosen in the communication sector; Finally, other department was mentioned by the energy – alternative source sector.
In terms of reporting methods, both corporate website and integrated reporting were adopted within electric, bank & financial, and basic materials – forest products and paper industries and sectors; corporate website, independent reporting and integrated reporting were mentioned in the communication sector; finally, independent and integrated reporting were considered in the energy – alternative sources sector.
Concerning the criteria chosen to select NPIs, response to requests presented by organizations inside the third sector and identification of necessities of local communities were adopted in the basic materials – forest products and paper industry;
strategic planning, selection of initiatives and projects that fit within the company’s
16 bank & financial and electric industries and sectors; strategic planning, requests presented by organizations inside the third sector and identification of necessities of local communities were identified in the consumer and retail sector; selection of initiatives and projects that fit within the company’s objectives and identification of necessities of local communities were adopted in the energy – alternative source sector; finally, selection of initiatives and projects that fit within the company’s objectives and requests presented by organizations inside the third sector were selected in the communication sector.
Finally, regarding the criteria adopted to choose between similar projects, the impact of the project was adopted in the electric, basic materials – forest products and paper, bank & financial consumer and retail and industry and energy – alternative sources industries and sectors; impact and possible visibility of the project, urgent necessity of monetary resources and notability of the cause were identified in the communication sector.
Psi–20 analysis
Areas of action
17 human development require areas but also to support local development, correct social problems and promote the organization in the surrounding environment. The visibility and exposure aimed by companies on its NPIs also could help to explain this fact .
Supporting techniques
Across Psi–20, the core supporting technique is financial support/donations/grants however, recent evidence reveals an increasing tendency to enhance non-financial donations as in volunteering activities and collection campaigns. This trend is linked with the increasing visibility and engagement with local communities as a way to strengthen and stimulate customer loyalty, reputation and employees’ motivation. However, the shift in the motivation behind NPIs could also explain this tendency.
Foundations
The creation of corporate foundations that perform, represent or complement the
company’s NPIs demonstrated a significant increased, between 2007 and 2009. This
tendency could be explained by the motivations and attractiveness factors to perform NPIs, in the sense that, through corporate foundation, companies can more effectively increase its corporate image, branding, reputation, trust, and credibility enabling a more strategic communication with its stakeholders. Also, provide higher involvement and impact in local communities along with higher employee motivation and satisfaction due to the higher magnitude and influence of its actions. Additionally, the increasing necessity for controlled financial resources, time commitment and engagement might also be associated with the increase of corporate foundations.
Investment in NPIs
The trends on investment demonstrated a straight link between the amounts invested
18 investment in NPIs, and the other way around, confirming the existing theories on this matter. Also, it was found a relationship between the size of the company and the number of NPIs performed in the sense that the larger the companies, the higher number of NPIs performed, and the other way around. These relationships could be explained by the higher commitment applied by larger and wealthier companies on this matter aiming to achieve higher corporate image, branding, reputation, trust, and credibility and stimulate a more effective communication with stakeholders and employees satisfaction and motivation.
International activities
The trends on the international NPIs demonstrated that a straight link between the size of the company as larger companies, implied stronger and wider international presence. Also, it was found a relationship between the geographic location of operational activity and international NPIs as the existence of NPIs in all locations where the company performers its operational activity, implying that the type of investments made abroad have an impact on international NPIs. A possible explanation for this fact could be, once again, linked with the necessity to achieve higher corporate image, branding, market position/market share, reputation, trust, credibility, loyalty, employee satisfaction and motivation and a more effective communication with stakeholders. All combined, these facts are crucial to portrait the accountability and trust necessary to conquer international markets.
Reporting methods and standards, accreditation and commitments
19 tendency for external certification can be justified by the increasing necessity to effectively communicate with stakeholders in order to transmit trust, credibility, loyalty, accountability and transparency.
Foundations
The existence of corporate foundations that perform, represent or complement the
company’s social activities, across the index, could be explained by the necessity to
increase visibility, reputation, employee motivation, tax benefits, involvement and impact in local communities along with the need to organize and control the financial resources given.
Conclusion
So far, it was revealed that increase motivation and productivity of employees and promote economic and human development are the main motivations to enhance NPIs across the FP. Society and financial support/donations/grants are considered the core areas of action and supporting techniques. Also, integrated reporting is the most common reporting method. Moreover, it was identified a straight link between amounts
invested and the company’s net result and a later concern for social matters in holdings
contrasting with subsidiaries. Furthermore it was found a straight link between the size of the company and the international presence. However, it was also found that the absence of international NPIs is linked with the high concentration of the operational activity in Portugal. Additionally, it was found a higher importance for this matter in some sectors evidencing higher reporting standards / accreditation and existence of corporate foundations.
20 with this, it would be interesting to extend this analysis to a much broader target, timeframe and structure of analysis. This would enable a more consistent analysis. Based on conclusions obtained, and aiming to measure the attractiveness of investment in NPIs, three main dimensions were considered as crucial factors to support NGOs to attract investment.
Defining the target
As previously mentioned, each industry has its own motivations, core areas of action and core supporting techniques (see figures 1 to 6). Also, when performing NPIs, each industry has its own set of criteria to choose the geographical location of its actions and to choose between and among projects (see figures 8 and 10). In line with this, to attract investment, it is crucial for NGOs to define its target investors. For this reason, NGOs must clearly understand the core areas of action and supporting techniques of each industry and sector, its motivations to invest in NPIs, its geographical area of action, and its criteria to choose between and among projects to successfully attract investment and fulfil its problems of lack of resources.
Marketing & Communication
21 workshops, conferences, briefings, fairs and application to funds are valuable communication tools depending on the target investor and its objectives. With these techniques, NGOs could create and cultivate the non-profit market.
Credibility and transparency
The lack of information regarding social investments that do and do not succeed inhibits the flow of capital into the social sector (Simon, 2011). In line with this, transparent and credible practices are extremely important to attract and retain investors, but also to cultivate reputation. To perceive this, reporting appears as important solution allowing investors to compare projects, within and across sectors, provide support on decision– making and evidence high standards on values and practices such as transparency and
rigor (Simon, 2011; O’Donohoe, 2010; Freireich & Fulton, 2009; So, 2011).
Considering the high costs associated to this type of practices, NGOs should adopt reporting standards or create internal reports on performance using indicators (financial metrics, financial ratios, impact indicators and models or define simple objectives/ key
outline indicators for each project) (Emerson, 2010; O’Donohoe, 2010; Simon, 2011;
22
Appendices
Figure 10 - Analysis of the CSR strategies between 2007 and 2011 in the Bank & Financial industry.
2007 2008 2009 2010 2011 2007 2008 2009 2010 2011 2007 2008 2009 2010 2011 2007 2008 2009 2010 2011
Millennium BCP Millennium BCP Millennium BCP Millennium BCP Millennium
BCP BES BES BES BES BES BPI BPI BPI BPI BPI Banif Banif Banif Banif Banif
Sustainability
report a a a a a a a a a a
Management
report a a a a a a a a a a
GRI a a a a a a a a a a a a a a a
LBG a a a
DJSI a a
FTSE4 a a a a a
Stoxx a a
563M€ 201M€ 225M€ 302M€ -849M€ 607M€ 402M€ 521M€ -109M€ 511M€ 355M€ 150M€ 175M€ 185M€ -285M€ 0.1M€ 0.1M€ 0.1M€ 0.003M€ 4.2M€ 4M€ 2.4M€ 3.8M€ 3.2M€ 4M€ 3M€ 4M€ 3.6M€ 5.4M€ 3.5M€ 1.2M€ 4.3M€ 2.7M€ 2.1M€
None a a a a a
Europe a a a a a
Asia
Africa a a a a a a a a a a a a a a a
USA a a a a a
South America a a a a a
a a a a a
a a a a a a a a a a a a a a a a a a a a
a a a a a a a a a a a a a a a a a a a a
23 37 6 9 8 8 3 8 4 4 44 20 15 16 16 6 5 5 9 12
Partnerships a a a a a a a a a a a a a a a
Sponsorships a a a a a a a a a a a a a a a
Financial support / donations / grants
a a a a a a a a a a a a a a a a a a
3 11 14 18 18 1 2
Financial support / donations / grants
a a a a a a
Material donations a
Raisings a
1 1 1 4 1 17 11 8 14 9
Sponsorships a a a a a
Financial support / donations / grants
a a a a a a a a a a
20 16 3 3 6 8 5 5 6 6 41 54 57 70 42 1 11 4 12 7
Partnerships a a a a a a a a a a a a a a a a a a a
Volunteering
activities a a a a a a
Sponsorships a a a a a
Financial support / donations / grants
a a a a a a a a a a a a a a a a a
Material
donations a a
16 24 2 6 1 3 5 6 4 4 22 32 22 23 51 13 10 4 4 6
Volunteering
activities a a a a a a a a a a
Sponsorships a a
Financial support / donations / grants
a a a a a a a a a a a a a a a a a a a a
Material
donations a a a a a a a a a
Raisings a a a
S o c i e t y Supporting techniques
N. of Activities
N. of Activities
N. of Activities Supporting techniques S p o r t s Supporting techniques E d u c a t i o n Supporting techniques
Bank & Financial industry Bank & Financial industry
H e a l t h Supporting techniques
N. of Activities
N. of Activities Reporting methods
Reporting standards
Certification
Net Profit
Investment in CSR
International CSR
Foundation Environmental CSR Employees CSR C u l t u r e
Bank & Financial industry Bank & Financial industry Sector / Industry
Year
23 Figure 11 - Analysis of the CSR strategies between 2007 and 2011 in the Basic materials - forest products and paper and consumer and retail industries and sectors.
Basic materials – Forest products and Paper Basic materials – Forest products and Paper Basic materials – Forest products and Paper Basic materials – Forest products and Paper Basic materials – Forest products and Paper Basic materials – Forest products and Paper Basic materials – Forest products and Paper Consumer and retail industry Consumer and retail industry Consumer and retail industry Consumer and retail industry Consumer and retail industry Consumer and retail industry Consumer and retail industry Consumer and retail industry Consumer and retail industry Consumer and retail industry
2010 2011 2007 2008 2009 2010 2011 2007 2008 2009 2010 2011 2007 2008 2009 2010 2011
Semapa Semapa Portucel Portucel Portucel Portucel Portucel Sonae Sonae Sonae Sonae Sonae Jerónimo
Martins Jerónimo Martins Jerónimo Martins Jerónimo Martins Jerónimo Martins Sustainability
report a a a a a a a a a a
Management
report a a a a a a a
GRI a a a a a a a a a a
LBG a
DJSI FTSE4 Stoxx
154M€ 131M€ 105M€ 211M€ 196M€ 355M€ 39M€ 74M€ 199M€ 139M€ 151M€ 176M€ 223M€ 300M€ 357M€ 1.2M€ 1.2M€ 1.2M€ 0.77M€ 0.65M€ 10M€ 7.8M€ 9.6M€ 10.4M€ 10.1M€ 4.5M€ 6.8M€
None a a a a a a a a a a a a
Europe a a a a a
Asia Africa USA
South America
a a a a a a a a a a a a a a a a a
a a a a a a a a a a a a a a a a a
1 1 1 1 1 3 2 2 62 21 18 1 1
Partnerships a Volunteering
activities a a a a a
Sponsorships a a a a a a a a a a a a a
Financial support / donations / grants
a a a a a a a a a a a a a
1 2 1 1 1 2 3 10 4 4 3 2 16 5 5
Partnerships a a
Volunteering
activities a
Sponsorships a a a a a a a a a a a a a a
Financial support / donations / grants
a a a a a a a a a a a a a
Material
donations a a a a a a
Raisings a a
1 1 Supporting techniques Financial support / donations / grants a a
1 5 3 5 4 4 2 2 4 5 11
Partnerships a a a a
Raisings a
Sponsorships a a a a a a a a a a a
Financial support / donations / grants
a a a a a a a a a a
Material
donations a a
171 176 6 9 6 3 4 2 5 7 6 15 221 100 163 363 35
Partnerships a a a a a a a a a a a a a a a a a
Volunteering
activities a a a a a a a a a a a a a a a a a
Sponsorships a a a a a a a a a a a a a a
Financial support / donations / grants
a a a a a a
Material
donations a a a a a a a a
S p o r t s
N. of Activities
E d u c a t i o n
N. of Activities
Supporting techniques S o c i e t y
N. of Activities
Supporting techniques C u l t u r e
N. of Activities
Supporting techniques H e a l t h
N. of Activities
Supporting techniques
Net Profit Investment in CSR
International CSR
Foundation Environmental CSR Employees CSR Sector / Industry
24 Figure 12 - Analysis of the CSR strategies between 2007 and 2011 in the Communication sector. Communica-tion sector Communica-tion sector Communica-tion sector Communica-tion sector Communica-tion sector Communica-tion sector Communica-tion sector Communica-tion sector Communica-tion sector Communica-tion sector Communica-tion sector Communica-tion sector Communica-tion sector Communica-tion sector Communica-tion sector
2007 2008 2009 2010 2011 2007 2008 2009 2010 2011 2007 2008 2009 2010 2011
ZON ZON ZON ZON ZON Sonaecom Sonaecom Sonaecom Sonaecom Sonaecom PT PT PT PT PT
Sustainability
report a a a a a a a a a a
Management
report a a a a a
GRI a a a a a a a a a a
LBG a a a
DJSI a a
FTSE4 a a a
Stoxx a a a
49M€ 48M€ 44M€ 35M€ 34M€ 37M€ 5M€ 6M€ 41M€ 63M€ 742M€ 582M€ 684 € 5672M€ 339M€ 4.5M€ 5.2M€ 4.5M€ 4.9M€ 4.4M€
None a a a a a a a a a a a a a a
Europe Asia
Africa a
USA
South America a
a a a a a
a a a a a a a a a a a a a a a
a a a a a a a a a a a a a a a
1 1 3 1 3 3 2 2 3 2
Partnerships a a a a a a
Volunteering
activities a
Sponsorships a a a a a a a a a
Financial support / donations / grants
a a a a a a a a a a
5 6 20 6 11 6 7 4 1 3 3 3 3 7
Partnerships a a a a a a a a
Volunteering
activities a a a a a a a a
Sponsorships a a a a
Financial support / donations / grants
a a a a a a a a a a a a a a
Material
donations a a a a a a a
Raisings a 1 Sponsorships a Financial support / donations / grants a
1 3 1 18 10 11 11 6 3 19 16 7 8 25
Partnerships a a a a a a a a a a a
Volunteering
activities a a a a a a
Sponsorships a a a a a a a a a a a a a a
Financial support / donations / grants
a a a a a a a a a a a a a a
Material
donations a a a a a
6 2 9 4 13 3 18 28 32 52 12 12 16 5 1
Partnerships a a a a a a a a a a a a a a a
Volunteering
activities a a a a a a a a a a a a a a a
Sponsorships a a a a a a a a a a a a a
Financial support / donations / grants
a a a a a a a a
Material
donations a a a a a
E d u c a t i o n Supporting techniques S o c i e t y Supporting techniques
N. of Activities N. of Activities C u l t u r e Supporting techniques H e a l t h Supporting techniques S p o r t s Supporting techniques
N. of Activities N. of Activities
N. of Activities Employees CSR Sector / Industry
Year Company Reporting methods Reporting standards Certification Net Profit Investment in CSR
International CSR
25 Figure 13 - Analysis of the CSR strategies between 2007 and 2011 in the electric and energy - alternative sources industries and sectors.
Electric industry Electric industry Electric industry Electric industry Electric industry Electric industry Electric industry Electric industry Electric industry Electric industry Energy - alternative sources Energy - alternative sources Energy - alternative sources Energy - alternative sources Energy - alternative sources
2007 2008 2009 2010 2011 2007 2008 2009 2010 2011 2007 2008 2009 2010 2011
EDP EDP EDP EDP EDP REN REN REN REN REN EDP
Renováveis EDP Renováveis EDP Renováveis EDP Renováveis EDP Renováveis Sustainability
report a a
Management
report a a a a a a a a a a a
GRI a a a a
LBG a a a a a
DJSI a a a
FTSE4 a
Stoxx
0.9M€ 1M€ 1M€ 1M€ 1M€ 104M€ 114M€ 80M€ 89M€ 16M€ 18M€ 17M€ 18M€ 19M€ 2M€ 5M€ 1761M€
None a a a a a
Europe a a a a a a a a a
Asia Africa
USA a a a a a
South America a a a a a a a a a
a a a a a
a a a a a a a a a a a a a a
a a a a a a a a a a a a a a
10 13 12 9 2 3 11 1 1 1 7
Sponsorships a a a a a a a a a
Financial support / donations / grants
a a a a a a a a a a a
4 5 6 1 1
Partnerships a
Volunteering
activities a a a
Financial support / donations / grants
a a a a a
Material
donations a a a
6 2 4 3 1 2 5 5 2 1 1 5
Volunteering
activities a a a a a a a a a a
Sponsorships a a a a
Financial support / donations / grants
a a a a a a a a a a a a
Material
donations a a a a
3 2 9 7 4 7 11 1 1 1 3
Partnerships a
Volunteering
activities a a a a a
Sponsorships a a a a a a a a
Financial support / donations / grants
a a a a a a a a a a a
Raisings a a a
8 9 13 10 6 4 14 14 1 1 1 3
Partnerships a a a a a a a a a a a a
Volunteering
activities a a a a a a a a
Sponsorships a a a
E d u c a t i o n Supportin g techniques S o c i e t y Supportin g techniques C u l t u r e Supportin g techniques H e a l t h Supportin g techniques S p o r t s Supportin g techniques
N. of Activities
N. of Activities
N. of Activities
N. of Activities
N. of Activities Employees CSR Sector / Industry
Year Company Reporting methods Reporting standards Certification Net Profit Investment in CSR
Internationa l CSR
26 Figure 14 - Analysis of the CSR strategies between 2007 and 2011 in the electric, oil & gas and energy - alternative sources industries and sectors.
Building materials
Building materials
Building
materials Construction Construction Construction Construction Construction Oil & Gas Oil & Gas Oil & Gas Oil & Gas Oil & Gas
2007 2008 2009 2007 2008 2009 2010 2011 2007 2008 2009 2010 2011
Sonae Indústria
Sonae Indústria
Sonae
Indústria Mota-engil Mota-engil Mota-engil Mota-engil Mota-engil Galp Energia Galp Energia Galp Energia Galp Energia Galp Energia
Sustainability
report a a a a a a a a a a a a a
Management report
GRI a a a a a a a a a a
LBG DJSI FTSE4 Stoxx
79M€ 104M€ 114M€ 720M€ 117M€ 347M€ 451M€ 433M€ 0.66M€ 0.58M€ 0.43M€ 6M€ 5M€ 5.9M€ 5.5M€
None
Europe a a a
Asia a a a a a
Africa a a a a a a a a a a
USA a a a
South America a a a a a a a a a a a a
a a a a a a a
a a a a a a a a a a a a a
a a a a a a a a a a a a a
1 1 9 10 23 20 8 15 5
Partnerships Volunteering
activities a a a
Sponsorships 1 1 5 4 5
Financial support / donations / grants
a a a a a a a a a a a
3 3 1 15 16 11 9 a a a
Sponsorships a a a a a
Financial support / donations / grants
a a a
Material
donations a a a a a 1 1 1 1 1
1 1 1 1 1 1 1
Supporting techniques Financial support / donations / grants
a a a a
1 1 1 1 1 10 a a a a a
Partnerships a a a a a a a
Volunteering
activities 6 10 6 9 11
Sponsorships a a
Financial support / donations / grants
a a a a a a a a a a
Material
donations a a
5 6 6 11 13 6 17 a a a a a
Partnerships a a
Volunteering
activities a a a a a
Sponsorships a a a a a a a a a a a a
Financial support / donations / grants
a a a a a a a a a a a a
Material
donations a a a a a
N. of Activities
N. of Activities
N. of Activities C u l t u r e Supporting techniques H e a l t h Supporting techniques S p o r t s
N. of Activities N. of Activities
E d u c a t i o n Supporting techniques S o c i e t y Supporting techniques Employees CSR Sector / Industry
Year Company Reporting methods Reporting standards Certification Net Profit Investment in CSR
International CSR
27 Figure 15 - Motivations to perform CSR activities (Survey results).
Figure 16 - Types of CSR activities performed (Survey results).
Figure 17 - Geographic location and choosing criteria (Survey results).
Sector / Industry
Increase organizational visibility Obtain financial benefits Increase motivation and productivity of employees
Correct the externalities caused by the operational activity
Create a positive image in the mind of consumers
Attract talented and high potential
human capital Incentivar a lealdade dos consumidores Increase / stimulate sales Increase credibility Promote economic and human development Other
Utilities / Electric a a a a a
Utilities / Electric a a a
Communication a a a
Communication a a a a
Bank & Financial industry a a a a
Bank & Financial industry a a a a
Bank & Financial industry a a a a a a a
Energy – Alternative sources a a a a a Basic materials – Forest
products and Paper a a a
Consumer and Retail a a a a a
Consumer and Retail a a a
Fund rainsings Financial support / donations / grants
Volunteering activities
Construction and reconstruction activities
Activities inside the surrounding community
Collection campaigns
Educational campaigns
Utilities / Electric a
Utilities / Electric a a a a
Communication a
Communication a a
Bank & Financial industry a
Bank & Financial industry a a Bank & Financial industry a a a
Basic materials – Forest
products and Paper a a
Energy – Alternative
sources a a a
Consumer and Retail a a a a
Consumer and Retail a a
Financial donations Non-financial donations
Sector / Industry
Surrounding community
Community affected by the operational business activity
Other chosen community Correct externalities Support local development Correct social problems
Promote the organization in the surrounding environment
Support a specific social group
Utilities / Electric a a a
Utilities / Electric a a a a
Communication a a
Communication a a
Bank & Financial industry a a a a
Bank & Financial industry a a a a
Bank & Financial industry a a a a
Basic materials – Forest
products and Paper a a a a a
Energy – Alternative sources a a a
Consumer and Retail a a a a a
Consumer and Retail a a
Sector / Industry
28 Figure 18 - Reporting tool and department accountable to report CSR activities (Survey results).
Figure 19 - Choosing criteria between and among project (Survey results).
Communications department Environmental department External department Sustainability department / division Other Independent report Report integrated in the annual report
On the corporate website
Utilities / Electric a a a
Utilities / Electric a a a
Communication a a
Communication a a a
Bank & Financial industry a a a Bank & Financial industry a a a Bank & Financial industry a a a
Basic materials – Forest products and Paper a a a
Energy – Alternative sources a a a
Consumer and Retail a a a
Consumer and Retail a a
Sector / Industry
Department accountable to report CSR activities Reporting tool
Strategic plan previously approved According to the organization's objectives Requests presented by organizations inside the third
sector
Identification of necessities of local communities
Impact of the project
Possible visibility of the project
Urgent necessity of monetary resources
Notability of the cause
Utilities / Electric a a
Utilities / Electric a a a
Communication a a
Communication a a a a
Bank & Financial industry a a a a a a
Bank & Financial industry a a a
Bank & Financial industry a a a a
Basic materials – Forest products and Paper a a
Energy – Alternative sources a a a
Consumer and Retail a a a a a a
Consumer and Retail a a a a
Sector / Industry
Choosing criteria Criteria to choose between similar projects
a a
a a a
a a
a a a a
a a a a a a
a a a
a a a a
Basic materials – Forest products and Paper a a
Energy – Alternative sources a a a
a a a a a a
29
References
ACEVO. (2010). Understanding Social Investment. ACEVO.
Achleitner, A.–K., Heinecke, A., Noble, A., Schöning, M., & Spiess–Knafl, W. (2011). Social Investment Manual.
Asongu, J. J. (2007). History of CSR. Journal of business and public policy. BCSD. (2006). Relatórios de sustentabilidade: Motivações e impactos. Portugal.
Carroll, A. B. (1991). The Pyramid of Corporate Social Responsibility: Toward the Moral, Management of Organizational Stakeholders. Business Horizons.
CorporateRegister.com. (2012). CR Reporting Awards 2012 – Global winners & reporting trends.
Emerson, J. (2010). Risk, Return and Impact: Understanding Diversification and Performance Within and Impact Investing Portfolio. Impact Assets.
Evenett, R., & Ritcher, K. T. (2011). Making Good in Social Impact Investment – Opportunities in an Emerging Asset Class. The Social Investment Business.
Fernandes, N. M. (2010). A Responsabilidade Social das Empresas – A dimensão interna: uma ferramenta para a criação de Valor. INST. POL. DE LISBOA - ISCAL. Force, S. I. (2010). Social Investment Ten years on. Social Investment Task Force. Franco, R. (2005). Defining the nonprofit: Portugal. The Johns Hopkins Comparative. Franco, R. C., Sokolowski, S. W., Hairel, E. M., & Salamon, L. M. (s.d.). The Portuguese non-profit sector in comparative perspective. Portugal: CNP Project.
30 Hudson, R. (2005). 'Ethical Investing: Ethical Investors and Managers.' Business Ethics Quarterly 15 (4), p. 641–657.
KPMG. (2005). International Survey of Corporate Responsibility. KPMG.
KPMG. (2006). Estudo da KPMG sobre a Publicação de Relatórios de Sustentabilidade em Portugal – Resultados do inquérito às maiores empresas em Portugal. Portugal: KPMG.
Lewis, E. (n.d.). The Cornerstones of Successful Fundraising: Marketing & Communications. Retrieved Feveiro 28, 2013, from Centre for non-profit management. Lim, T. (2010). Measuring the value of corporate philanthropy – Social impact, business benefits, and investor returns. Committee Encouraging Corporate Philanthropy.
Mansley, M. (2000). Socially Responsible Investment: A Guide for Pension Funds and Institutional Investors. Sudbury, UK: Monitor Press.
O’Donohoe, N. (2010). Impact Investments an emerging asset class. JP Morgan.
Oliveira, F. N. (2010). Responsabilidade Social Empresarial – um estudo às práticas das 100 maiores empresas portuguesas. Porto: Universidade Fernando Pessoa.
Pinto, G. R. (2004). Corporate Social responsibility: State of the Art in Portugal 2004. Lisbon: CECOA – Centro de Formação Profissional para o Comércio e Afins.
Porter, M. E., & Kramer, M. R. (2006). Strategy and Society: The Link Between Competitive Advantage and Corporate Social Responsibility. Harvard Business Review. Simon, J. B. (2011). More than Money – Impact Investing for Development. Center for the global development.