High Content Analysis Provides Mechanistic Insights on
the Pathways of Toxicity Induced by Amine-Modified
Polystyrene Nanoparticles
Sergio Anguissola1*, David Garry1, Anna Salvati1, Peter J. O’Brien2, Kenneth A. Dawson1*
1Centre for BioNano Interactions, School of Chemistry and Chemical Biology, University College Dublin, Belfield, Dublin, Ireland,2Pathology Department, School of Veterinary Science, University College Dublin, Belfield, Dublin, Ireland
Abstract
The fast-paced development of nanotechnology needs the support of effective safety testing. We have developed a screening platform measuring simultaneously several cellular parameters for exposure to various concentrations of nanoparticles (NPs). Cell lines representative of different organ cell types, including lung, endothelium, liver, kidney,
macrophages, glia, and neuronal cells were exposed to 50 nm amine-modified polystyrene (PS-NH2) NPs previously
reported to induce apoptosis and to 50 nm sulphonated and carboxyl-modified polystyrene NPs that were reported to be
silent. All cell lines apart from Raw 264.7 executed apoptosis in response to PS-NH2NPs, showing specific sequences of EC50
thresholds; lysosomal acidification was the most sensitive parameter. Loss of mitochondrial membrane potential and plasma membrane integrity measured by High Content Analysis resulted comparably sensitive to the equivalent OECD-recommended assays, allowing increased output. Analysis of the acidic compartments revealed good cerrelation between
size/fluorescence intensity and dose of PS-NH2 NPs applied; moreover steatosis and phospholipidosis were observed,
consistent with the lysosomal alterations revealed by Lysotracker green; similar responses were observed when comparing astrocytoma cells with primary astrocytes. We have established a platform providing mechanistic insights on the response
to exposure to nanoparticles. Such platform holds great potential forin vitroscreening of nanomaterials in highthroughput
format.
Citation:Anguissola S, Garry D, Salvati A, O’Brien PJ, Dawson KA (2014) High Content Analysis Provides Mechanistic Insights on the Pathways of Toxicity Induced by Amine-Modified Polystyrene Nanoparticles. PLoS ONE 9(9): e108025. doi:10.1371/journal.pone.0108025
Editor:Salik Hussain, National Institute of Health (NIH), United States of America
ReceivedMarch 11, 2014;AcceptedJune 4, 2014;PublishedSeptember 19, 2014
Copyright:ß2014 Anguissola et al. This is an open-access article distributed under the terms of the Creative Commons Attribution License, which permits unrestricted use, distribution, and reproduction in any medium, provided the original author and source are credited.
Data Availability:The authors confirm that all data underlying the findings are fully available without restriction. The data have been deposited to Figshare and are available at: http://dx.doi.org/10.6084/m9.figshare.1150356.
Funding:This research has been supported by an EPA STRIVE Fellowship, 2008-EH-MS-5-S3 (M. Brown, M.N.Rand; www.epa.ie), by the EU FP7 Capacities project QualityNano EU 262163 (www.qualitynano.eu), and by the EU FP7 nanoMILE EU 310451 (www.nanomile.eu). The SFI SRC BioNanoInteract, 07 SRC B1155 (www.sfi. ie) also supported part of the research reported here. The funders had no role in study design, data collection and analysis, decision to publish, or preparation of the manuscript.
Competing Interests:The authors have declared that no competing interests exist.
* Email: [email protected] (SA); [email protected] (KAD)
Introduction
The introduction of nanoparticle in numerous industrial [1,2] and biomedical applications [3], as well as consumer products [4,5] has raised concerns in relation to their impact on the environment and human health [6,7]. To promote the safe and responsible application of new and existing materials in the growing nanotechnology era it is required that engineered nanomaterials are assessed for their impact on the environment and human health. A more detailed understanding of how nanoparticles interact with biological systems is required in order to understand how nanoparticle exposure will affect individuals both in an acute and chronic exposure scenarios. The current of understanding is due to the diversity of nanomaterials chemical composition, size distribution, total surface area, surface charge and other physico-chemical characteristics which can lead to multiple and diverse interactions with the surrounding environ-ment and with biological systems [8,9].
When particles reach a size in the nanometre range they develop new properties due to their increased volume to surface
transported to the lysosomes [20–22]. Once in the lysosomes, experimental evidence shows that NPs in manny cases are not exported and accumulate into lysosomes without any evident damage, as cells continue to divide [23]. In other cases some NPs are known to be toxic to cells. For instance cationic PS-NH2NPs
have been described to induce cytotoxicity by caspase mediated apoptotic pathways at relatively low concentrations [24–27]. Once cells undergo apoptosis pro-apoptotic Bcl-2 family proteins assemble on the mitochondrial membrane and open pores that release apoptogenic factors responsible for activation of the caspase cascade. This caspase cascade leads to controlled cell death via apoptosis [28]. The relationship between nanoparticle surface properties and their potential toxicity are largely unknown; moreover little is known about the molecular mechanisms governing nanoparticle cytotoxicity. High Content Analysis (HCA) has already been successfully used in the field of drug discovery [29–32] and toxicology [33–35] for the ability to analyse numerous samples in the same experiment. Recently HCA has also been suggested as a powerful technology to assess potential toxicity of nanomaterials [36–39].
In this work we developed a multi parametricin vitroplatform
to assess potential cyctoxicity induced by nanoparticles using High Content Analysis (HCA). The fluorescent microscopy HCA cytotoxicity platform employs fluorescent dyes with complemen-tary excitation/emission spectra to examine: changes in nuclear morphology, mitochondrial membrane potential, cytosolic calci-um levels, acidificaton of the lysosomes and plasma membrane integrity. This versatile multi-parametric platform enables a user to analyse multiple parameters for a high number of samples, minimizing input while maximizing the experimental output.
In order to assess potential toxicity of nanomaterials to mammalian cells, we decided to use cell lines where nanoparticle uptake was previously documented. As our HCA platform was developed as anin vitroapproach to mimic human exposure to nanoparticles we used cell lines representative of many organs, focussed on inhalation scenarios and clearance. We believe that the development of a High Content multi-parametricin vitrocell toxicity platform will change the efficiency of nanoparticle safety testing by combining the output of several traditional assays and still complying with OECD regulations. The existing HCA platfom could be implemented to become a tool to assess exposure of specific tissues and organ-like structures for a realistic risk assessment of nanomaterials providing insights on the mechanisms of toxicity and establishing the link between molecular pathways of toxicity and nanomaterials surface properties; further, application of HCA would open the way to develop system biology approaches that are predictive of nanomaterial impact on human health.
In order to establish this platform we used PS-NH2 NPs as
candidate positive control for NPs-induced apoptosis. This allowed us to confirm by HCA the same scenario previously proposed [27,40] and provide new insights on the cellular pathways activated.
Materials and Methods
Nanoparticles and nanoparticles dispersions
Commercial Nanoparticles used were 50 nm sigma blu amine-modified polystyrene (PS-NH2) (Sigma Aldrich), 50 nm
sulpho-nated polystyrene (PS-Plain) (PolySciences) and 50 nm Carboxyl-modified polystyrene (PS-COOH) (Polysciences). All the commer-cial NP dispersions were stored at 4uC, and used as provided, without performing any cleaning step or other manipulation, within 1 year of arrival. Additionally 50 nm Silicon Dioxide
(Polysciences), 180 nm Cerium Dioxide (Umicore), 55 nm Tita-nium Dioxide (Vive Science) [41] and 100 nm Zinc Oxide (Vive Science) NPs were used for descriptive purposes. All experiments were performed using the same batch of nanoparticles. Physico-chemical properties of NPs were characterised by Dynamic Light Scattering (DLS) and zeta potential measurements at 25uC once the commercial dispersions were diluted in reference buffers, including 10 mM NaCl (Sigma Aldrich), PBS (Sigma Aldrich); The NP dispersion was also characterised in complete cell culture medium DMEM glutamax (Life Technologies) supplemented with 10% Fetal Bovine Serum (Life Technologies) after incubation for 24 hours and 72 hours at 37uC in order to describe NPs properties in the conditions applied foin vitrotesting. NP dispersions were diluted to the highest exposed dose to the cell cultures (100mg/ml)
and size distribution, poly dispersity index and zeta potential were
recorded. Data are shown as mean +/2 SD of triplicate
measurements from three independent experiments.
Reagents. 1321N1 human astrocytoma, SHSY5Y human
neuroblastoma, HepG2 human hepatocellular carcinoma, HEK 293 Human Embryonic Kidney and A549 human alveolar adenocarcinoma cells were purchased from ATCC; NHA human primary astrocytes were purchased from Lonza; Raw 264.7 Murine macrophage were purchased from ECACC; hMECD immortalised human microvascular endothelial capillary cells were kindly donated by Florence Miller, B.B. Wecksler (Inserm, France).
The fluorescent dyes, Hoechst 33342, TMRM, Fluo-4, Lyso-tracker Green and TOPRO-3, were purchased from Life Technologies.
All chemicals were purchased from Sigma Aldrich.
Cell culture. SHSY5Y, HepG2, Raw 264.7, and HEK 293
cells were cultured in DMEM glutamax (life technologies) supplemented with 10% FBS (Life technologies); 1321n1 cells were cultured in DMEM glutamax (life technologies) supplement-ed with heat-inactivatsupplement-ed 10% FBS (Life technologies). A549 cells were cultured in MEM (Life Technologies) supplemented with 1% glutamine 10% FBS (Life technologies); hCMEC/D3 cells were cultured in EBM-2 medium supplemented with vascular endothe-lial growth factor (VEGF), insulin-like growth factor-1 (IL-1), epidermal growth factor (EGF), basic fibroblast growth factor (bFGF), fetal calf serum (2%), gentamicin sulphate/amphotericin B and hydrocortisone (Lonza Biosciences); NHA cells were cultured in ABM Astrocyte Basal Medium supplemented with Rh EGF, insulin, ascorbic acid, GA-1000, L-glutamine and 10% heat-inactivated FBS according to manufacturer’s instructions (Lonza Clonetics Astrocyte Cell Systems) and 1% Penicillin/
streptomycin; cells were grown at 37uC in a humidified
atmosphere of 5% CO2/95% air. Cells were routinely
sub-cultured three times a week using trypsin (0.25%) (Life Technol-ogies). Serum heat inactivation was performed by incubating the serum at 56cyte Cell Systems).
High Content Analysis. High Content Analysis (HCA), an
automated epifluorescence microscopy approach with proprietary acquisition/analysis software was used to assess cellular cytotox-icity in a multiparameter approach. HCA was performed using a modified version of the approach established by Prof. O’Brien [33].
Briefly, 56103cells were seeded in a clear flat bottom 96 well
plate (Cell Star) in 100ml of cell culture medium containing 10% FBS. After 24 hours nanoparticle dispersions were prepared as 36
the final concentration required in cell culture medium containing 10% FBS, then 50ml of particle suspensions were added to the
cell-containing wells to reach a 16 concentration. Equivalent
applied as vehicle in all experiments. The dispersants from the nanoparticle suspensions was tested at the same volume which did not induce any alteration of the parameters analysed (data not shown). Cells were incubated with nanoparticles at a final concentrations of 0.3mg/ml, 0.7mg/ml, 1.5mg/ml, 3mg/ml, 6mg/ml, 12mg/ml, 25mg/ml, 50mg/ml and 100mg/ml, for 24 or 72 hours.
At the end of the incubation period 50ml of medium was
removed from the wells and replaced with 50ml of a 36
concentrated solution containing the following dyes: Hoechst (400 nM) to identify cell nuclei and assess changes in nuclear morphology, TMRM (20 nM) to assess loss of mitochondrial
membrane potential, Fluo-4 (1mM) to measure increase in
cytosolic calcium, Lysotracker green (200 nM) to assess lysosomal acidification (assessed in a separate experiment), TOPRO-3 (800 nM) to evaluate plasma membrane permeabilization. After 1 hour incubation, cells were analysed by High Content Analysis using the Arrayscan VTI 740 (Thermo Scientific). Images were acquired using a 206objective and fluorescence intensities were
collected using the following combination of excitation/emission filters: Hoechst was excited through a 365+/250 nm band pass filter and fluorescence emission was collected through a 515+/2 20 nm band pass filter; TMRM was excited through a 549+/2 8 nm band pass filter and fluorescence emission was collected through a 600+/225 nm band pass filter; Fluo-4 or Lysotracker green were excited through a 475+/240 nm band pass filter and fluorescence emission was collected through a 515+/220 nm band pass filter; TOPRO-3 was excited through a 655+/230 nm band pass filter and fluorescence emission was collected through a 730+/250 nm band pass filter. Image analysis was performed using the cell health profile bioapplication. Data acquisition was configured to image an average of 300 to 500 cells within 10 acquired images (fields). Analysis parameters were set according to manufacturer’s instructions and fixed thresholds were used for each parameter to separate background noise from fluorescence. Dr. Chandrasekaran at Thermo Scientific USA implemented a custom made algorithm so that the Cell Health Profile bioapplica-tion reported field view details (average intensity per cell using a fixed threshold in each field acquired) for the following param-eters: cell numbers, nuclear size, nuclear intensity, TMRM intensity, Fluo-4 intensity, Lysotracker green intensity and TOPRO-3 intensity.
Data was exported to Prism where the EC50 and IC50 were
calculated by fitting the data with a sigmoid curve. Data are shown as mean +/2 SD of 45 fields acquired from three independent experiments performed in triplicate.
The detailed properties of Lysotracker green positive lysosomes were analysed using the Spot Detection Bioapplication. Lyso-tracker positive objects were identified and separated using a 3 sigma algorithm. Cell details were acquired and they were shown as mean +/2 SD of a representative experiment performed in triplicate.
Cell death assessment by Flow Cytometry. Cell
mem-brane permeability was measured by Propidium Iodide uptake in cells, as sign of cell damage. 16105cells were seeded in a 24-well
plates, and incubated for 24 hours prior to addition of nanopar-ticles. After 24 hours the medium was replaced with medium containing NPs diluted from the commercial dispersion in cell culture medium containing 10% FBS to the concentrations indicated previously (1.5mg/ml, 12mg/ml, 25mg/ml, 50mg/ml
and 100mg/ml). Cells were incubated with NPs at 37uC with 5%
CO2for 24 hours. Samples were washed with PBS and harvested
with 0.25% trypsin. Cells were resuspended in PBS containing
5mg/ml Propidium Iodide. The samples were then incubated on a
thermal mixer shaking at 600 rpm for 15 minutes at 37uC. Samples were acquired on a C6 flow cytometer (BD Accuri) equipped with a 20 mW 488 nm laser. Fluorescence emission of Propidium Iodide was recorded through a 585+/240 nm long pass emission filter. The percentage of PI-positive cells was
reported as mean +/2 SD of three independent experiments
performed in triplicate.
MTS cell viability assay. Cellular viability was determined by the MTS assay, which measures the reduction of 3-(4,5- dimethylthiazol-2-yl)-5-(3-carboxymethoxyphenyl)-2-(4-sulfophe-nyl)-2H-tetrazolium (MTS) to formazan by mitochondria in viable cells. 1.56104cells were seeded in each well of a 96-well plate (Cell
Star) and grown in a humidified incubator at 37uC with 5% CO2
for 24 hours. The nanomaterials to be tested were diluted from the commercial dispersion in cell culture medium containing 10% FBS and added to the wells at the doses indicated previously (1.5mg/ml, 12mg/ml, 25mg/ml, 50mg/ml and 100mg/ml). After the incubation periods the cell culture media was removed from each well. The CellTiter 96 AQueous One Solution Reagent (Promega) was added to each well of the 96 well plate. The plate was incubated with the MTS reagent for 60 minutes at 37uC in a
humidified, 5% CO2 atmosphere. Formazan absorbance was
measured at 490 nm using a microtiter plate reader (Varioskan Flash, Thermo Scientific, MA, USA). Recorded data were processed as follows: the average background level was subtracted from each well. The resulting absorbance from each dosing well was normalized to the absorbance value of untreated cells. After normalization, the values from a single dose in the technical replicates were averaged and standard deviation was determined. Additional control experiments, namely the MTS reagent mixed with nanoparticles only, were performed to assess potential interference of the nanoparticles, and did not reveal any interference of the NPs used with the MTS assay.
Data was reported as mean +/2 SD of three independent
experiments performed in triplicate.
Data was exported to Prism to assess statistical significance.
Assessment of lipid intracellular accumulation
The lipidTOX phospholipidosis and steatosis detection kit for High Content Screening (Life Technologies) was used to assess accumulation of phosphor- and neutral lipids inside cells according to manufacturer’s instructions.
Briefly 56103cells were seeded into each well of a 96 well plate
and exposed to PS-NH2 and PS-COOH NPs for 24 and 48 hours as previously indicated; the LipidTOX Red phospholipidosis detection reagent was applied at the same time of NP exposure.
After exposure cells were fixed with 4% formalin and stained with Hoechst 33342 and the LipidTOX Green neutral lipid stain. Fluorescence intensity was acquired by using HCA as previously described.
Statistical analysis
HCA data were exported to Prism; IC50/EC50 values were calculated by fitting a sigmoid curve (log (inhibitior) v.s. normalised response – variable slope or log (actuator) v.s. normalised response – variable slope respectively) in.
Statistical analysis of flow cytometry data was performed using one way Anova. Samples were considered significantly different from control when the p value was lower than 0.05 (95% confidence).
Results
Establishment of a HCA platform to identify the cellular pathways of toxicity
In order to establish a High Content Analysis in vitro platform to assess the potential impact of nanomaterials for human health and identify the cellular pathways responsible; we selected a panel of cell lines as representative cells from the main routes of exposure, accumulation and clearance of NPs from the body. A549 alveolar adenocarcinoma cells were selected to mimic the inhalation route, hCMEC/D3 endothelial cells and Raw 264.7 macrophages described the interaction of NPs with the immune system and endothelium that forms the blood vessels respectively; HepG2 hepatocellular carcinoma cells were used to study eventual effects to the liver and 1321n1 astrocytoma, and SHSY5Y neuroblastoma cells were chosen to monitor potential neurotoxic
effects. Finally HEK293 embryonic kidney cells were selected to assess the potential impact on the kidneys as the main clearance route (Fig. S1 in File S1).
Polystyrene NPs are well dispersed in the complete cell culture medium over the duration of the exposure to cells
In order to establish the HCA screening platform we initially used nanoparticles that have been previously characterised in our group; amine-modified polystyrene 50 nm (PS-NH2) NPs induced
apoptosis in astrocytoma 1321N1 cells at concentrations between
50–100mg/ml [27,40], while carboxyl-modified (PS-COOH) or
sulphonated polystyrene (PS-Plain) 50 nm NPs did not elicit any biological effect at the same concentrations. A schematic representation of the selected NPs is illustrated in Fig. 1A. We therefore performed dose response experiments at 24 hours and at
-SO
3--COOH
-NH
2PS-PLA IN 53 1 0 .0 2 0 .0 1 -4 4 1 57 1 0 .0 7 0 .3 -1 1
PS-C OOH 6 1 1 0 .0 7 0 .0 2 -3 8 2 6 3 1 0 .0 2 0 .0 2 -1 1
PS-NH2 56 1 0 .0 8 0 .0 1 4 1 1 55 1 0 .0 7 0 .0 1 14 0 .9 SD ( Z
-A ve) PD I SD ( PD I) Z et a Po t
( m V ) SD
1mM N aC l PB S
Z -A ve ( d .nm )
SD ( Z
-A ve) PD I SD ( PD I) Z et a Po t
( m V ) SD Z -A ve
( d .nm )
PS-PLA IN 10 2 7 0 .3 7 0 .0 4 10 1 5 0 .0 5 0 .0 6
PS-C OOH 6 0 1 0 .16 0 .0 1 56 1 0 .16 0 .0 1
PS-NH2 79 1 0 .2 4 0 .0 2 78 2 0 .3 4 0 .0 4 Z -A ve
( d .nm ) SD ( Z
-A ve) PD I SD ( PD I)
2 4 h 10 % F B S 72 h 10 % F B S
PD I SD ( PD I) Z -A ve
( d .nm ) SD ( Z
-A ve)
Figure 1. PS-NH2, PS-COOH and PS-plain NPs preserve the dispersion characteristics when suspended in complete cell culture medium.The NPs employed, PS-NH2, PS-COOH and PS-Plain have a narrow size distribution and similar hydrodynamic size. A. Cartoon shows
schematically the surface modifications of the Polystyrene NPs used. B. DLS data acquired for PS-NH2, PS-Plain and PS-COOH NPs incubated in 1 mM
NaCl and PBS for 24 hours and 72 hours. Hydronamic size (Z-Ave), Polydispersity Index (PDI) and Zeta potential were measured. The NPs showed similar dispersion properties. C. DLS data acquired for PS-NH2, PS-Plain and PS-COOH NPs incubated in complete cell culture medium for 24 hours
and 72 hours. Hydronamic size (Z-Ave) and Polydispersity Index (PDI) were measured. PS-COOH and PS-Plain NPs retained similar dispersion properties to the original dispersion while PS-NH2NPs showed slight aggregation. Data are shown as average+/2SD of 3 experiments repeated in
triplicate.
72 hours to mimic acute and chrnoic response in the cell models selected. Before the nanoparticles were exposed to the selected cell lines we verified the dispersion characteristics of the NPs utilized.
PS-NH2and PS-COOH NPs have been extensively characterised
and have shown to be very stable once dispersed in cell culture medium, showing negligible agglomeration [42–44]. NPs physico-chemical properties were assessed by Dynamic Light Scattering (DLS) after diluting the commercial dispersion in reference buffers (10 mM NaCl and PBS) as well as the complete cell culture medium supplemented with 10% fetal bovine serum (FBS) used to grow the cell cultures, in order to assess whether the effective dose presented to the cells was consistent with the applied dose. The DLS size measurements showed that when dispersed in PBS the average hydrodynamic size of the three NPs was close to the nominal size indicated by the manufacturer; the poly dispersity index (PDI) was in a range comparable with a monodispersed suspension, suggesting that the nanoparticles are adequately dispersed in the reference buffers; zeta potential was negative for PS-Plain (20.2 mV) and PS-COOH (20.3 mV), while the amine-modified PS-NH2had a highly positive charge (+14 mV) (Fig. 1B).
The DLS measurements in the cell culture medium showed very similar average hydrodynamic size and a small increase in PDI compared to the reference buffers, indicating that the
nanopar-ticles used are still reasonably mono-dispersed in the cell culture medium (Fig. 1C). Further analysis showed that while the average size of the dispersion increased once nanoparticles were dispersed in cell culture medium the dispersions remained stable over the duration of exposure to cells with negligible signs of agglomeration (Figure S2 in File S1). The zeta potential of the three nanoparticles isolated after incubation with FBS was previously measured, showing that the protein corona formation on the nanoparticle surface neutralized the surface charge resulting in a zeta potential close to zero [17,27].
HCA resolves apoptotic and necrotic cell death responses in the model cell lines investigated
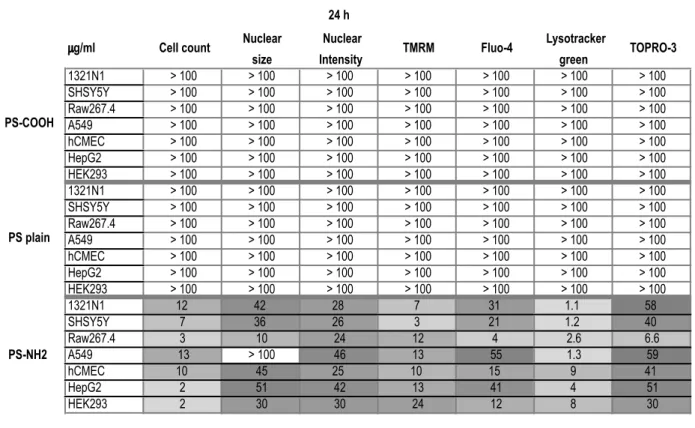
Once assessed that the nanoparticles to be used were reasonably mono-dispersed in the complete cell culture medium we proceed-ed to perform dose response experiments using a multi-parametric approach that measures changes in cell numbers, nuclear size and intensity, mitochondrial membrane potential, cytosolic calcium, acidification of the lysosomes and plasma membrane integrity as indicated in the materials and methods section. The panel of selected cell lines was exposed to increasing concentrations (0.4mg/ml, 0.75mg/ml, 1.5mg/ml, 3mg/ml, 6mg/ml, 12.5mg/
ml, 25mg/ml, 50mg/ml and 100mg/ml) of PS-NH2, PS-Plain Figure 2. Representative images of the cell lines exposed to PS-NH2NPs showed alteration of the cellular parameters investigated associated with cell death.The indicated cell lines were exposed to vehicle (ctrl) or increasing concentrations of PS plain, PS-COOH or PS-NH2NPs
for 24 hours; images were acquired using HCA to assess changes in nuclear morphology (Hoechst), mitochondrial membrane potential (TMRM), cytosolic calcium levels (Fluo-4), lysosomal acidification (Lysotracker green), and plasma membrane integrity (TOPRO-3); representative images of 1321N1 cells exposed to vehicle (ctrl), and 1321n1, SHSY5Y, A549, Raw264.7, hCMEC/D3, HepG2, HEK293 cells exposed to PS-NH2(100mg/ml)
revealed changes in fluorescence intensity of the fluorescent dyes used, indicating that PS-NH2NPs caused alteration in all the parameters analysed.
Scale bar = 20mm.
doi:10.1371/journal.pone.0108025.g002
and PS-COOH NPs for 24 and 72 hours; after 24 hours exposure all the selected cell lines displayed changes in the measured parameters in a dose-dependent fashion; representative images show how, compared to control cells, a reduction in nuclear size, TMRM fluorescence, and increase in nuclear fluorescence, fluo-4, lysotracker green and TOPRO-3 were observed for all cell lines exposed to 50mg/ml of PS-NH2NPs, except for Raw264.7, where
increase in nuclear size was observed instead (Fig. 2). Control images for the full panel of cells investigated are included in the Figure S3 in File S1. This difference in nuclear morphology suggests that a different signalling pathway could be responsible for cell death in Raw 264.7 cells. By performing the image analysis as described in the Methods we generated dose response profiles for all the parameters analysed at 24 hour and 72 hours. An example of the results forPS-NH2and PS-Plain NPs is shown in
Fig. 3 (data for PS-Plain NPs were comparable to PS-COOH NPs). PS-COOH and PS-Plain NPs did not cause any alteration in the cellular markers compared to cells exposed to vehicle, indicating that they did not elicit any cytotoxic response; however,
PS-NH2 NPs showed dose dependent alteration of all the
measured parameters resulting in acute toxicity for all the cell lines investigated (Fig. 3).
Interestingly, for all the cell lines except Raw264.7, the decrease in nuclear size and increase in nuclear intensity, indicative of nuclear condensation, associated with mitochondrial depolarisa-tion (TMRM), increase in lysosomal acidificadepolarisa-tion (Lysotracker green), calcium deregulation (Fluo-4) and plasma membrane permeabilization (TOPRO-3); this suggested that the cells underwent apoptotic cell death, consistently with previous results [26,27,40], and lysosomal damage; the same parameters indicated
nuclear swelling after exposure of PS-NH2 NPs to RAW264.7
cells, strengthening the hypothesis that RAW264.7 cells underwent cell death through a different mechanism, potentially necrosis. Flow cytometric analysis of phosphatydilserine exposure measured by AnnexinV-FITC and Propidium Iodide (PI) uptake revealed a population of early apoptotic cells (AnnexinV positive and PI negative), following exposure of A549 cells, while only necrotic cells (AnnexinV positive and PI positive) could be observed following exposure of RAW264.7 cells, consistent with the previous findings showing that PS-NH2 NPs induced apoptosis
in A549 cells [43,45], and further supporting the hypothesis that RAW264.7 cells underwent necrosis as opposed to apoptosis (Figure S4 in File S1).
Analysis of EC50 and IC50reveals a sequence of
thresholds consistent with the time sequence of apoptosis progression
A very valuable parameter used in toxicology to describe and normalize the response of cultured cells to different agents with variable degree of toxicity is the IC50/EC50 value. This was
calculated from the average field fluorescence values for all the parameters analysed as described in the Methods section. The indicated EC50/IC50values for PS-Plain and PS-COOH were all
above 100mg/ml, indicating that no effects were observed across all the concentrations tested. The most sensitive parameter for PS-NH2 nanoparticles (i.e the parameter with lowest EC50/IC50)
observed for all cell lines except Raw264.7 was Lysotracker Green, followed by, in most of the cell lines investigted, mitochondrial depolarization, nuclear condensation, nuclear intensity increase, cytosolic calcium and then loss of plasma membrane integrity, consistent with apoptotic cell death as previously reported [27,40].
On the contrary, the EC50/IC50 values for the measured
parameters in Raw264.7 cells were very similar (Fig. 4A), suggesting that in this cell line these events happened
simulta-neously, and led to swelling of the nucleus, rather than its condensation, which is consistent with a necrotic type of cell death. The EC50/IC50 values measured after 72 hours of exposure revealed a similar sequence of thresholds, though shifted to lower concentrations (Fig. S5), supporting the cell death pathways identified, i.e. apoptosis v.s. necrosis.
This sequence of EC50confirmed, in agreement with previous
observations [27], that after nanoparticles were actively taken up by cells through the endocytic pathways and accumulated in the lysosomes, they activated an apoptotic process that led to depolarization of the mitochondria with subsequent release of apoptogenic factors, and activation of the caspase cascade, finally resulting in nuclear fragmentation and condensation and subse-quently plasma membrane rupture (Fig. 4B). The sequence of EC50 thresholds shown was derived by the measurements from 1321n1 cells, and applies to the majority of cell lines investigated, which executed apoptosis. We could observe that in few cases some parameters did not follow the sequence strictly (e.g. Fluo4, cell counts and TMRM for HEK293 cells), nevertheless all cell lines undergoing apoptosis followed the recognised steps of the apoptotic cascade: lysosomal damage followed by mitochondrial impairment, nuclear condensation and loss of plasma membrane polarity. This imaging approach is suitable for the analysis of a broad range of nanomterials, examples of which can be found in Figure S6 of File S1. Further it can be easily translated to applications requiring fixed cells; as an example, intensity of cell nuclei stained with Hoechst 33342 measured in live and fixed cells was highly comparable Figure S7 in File S1).
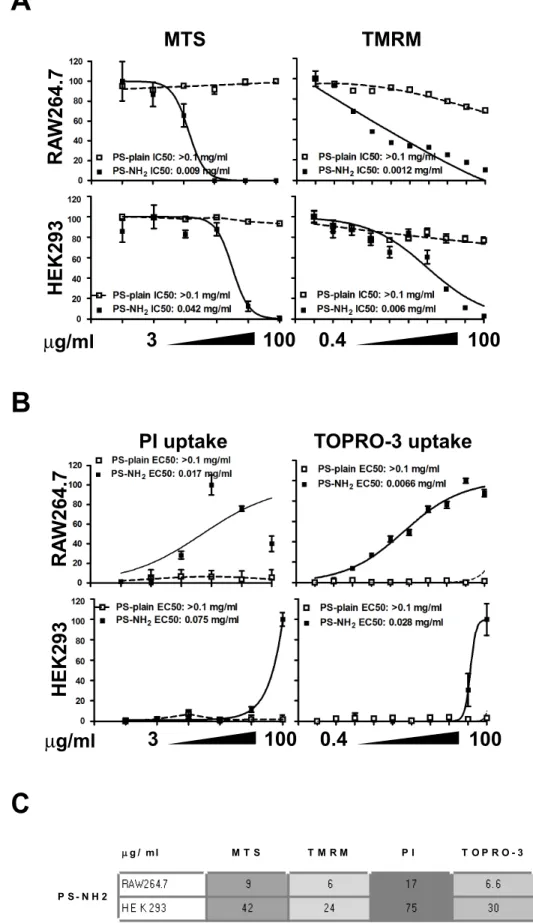
High Content Analysis proved to be as sensitive as traditional toxicology assays
The Organization for Economic Co-operation and Develop-ment (OECD) has compiled a list of recommendedin vitroandin vivoassays to test for toxicity induced by chemicals [46]; these tests are accepted by the scientific and regulatory community for the assessment of industry and consumer products being released on the market; the same are currently tested for their applicability to nanomaterials, and have been adjusted when nanomaterials show interference. With numerous new nanomaterials being introduced in industrial and consumer products these OECD recommended assays might not provide sufficient output; for this reason we decided to compare two parameters assessed by our HCA screening platform with the respective OECD recommended in vitro assays, to assess whether HCA provided similar sensitivity with the advantage to measure multiple parameters and multiple nanomaterials in the same experiment. Mitochondrial activity measured by TMRM was compared with the MTS assay while uptake of TOPRO-3 resulting from loss of plasma membrane integrity was compared to uptake of PI measured by flow cytometry.
Although the MTS cell viability assay and the TMRM fluorophore monitor different aspects of mitochondrial function-ality, i.e the reductase enzymatic activity and the polarization of the mitochondrial membrane respectively, they were compared as both are dependent on healthy, functional mitochondria. RAW 264.7 and HEK 293 cells were exposed to positively charged PS-NH2NPs and to PS-Plain NPs for 24 h and mitochondrial health
was assessed using MTS cell viability assay and fluorescent microscopy HCA TMRM staining (Fig. 5A).
In each cell line, a reduction in mitochondria activity was observed with increasing concentration of PS-NH2 NPs.
Mito-chondria activity was unaffected by PS-Plain. By comparing the dose response to PS-NH2NPs in both assays we observed a similar
that the HCA measurement of TMRM was as sensitive as the MTS assay (Fig. 5C). The flow cytometric PI uptake assay showed that PS-NH2NPs caused cell death in a concentration dependent
manner while the PS-Plain NPs did not cause increase in PI fluorescence at all tested concentrations. Comparable results were observed with our HCA assay (Fig. 5B), and also in this case the HCA assessment of cell death was as sensitive as the flow cytometric PI uptake assessment (Fig. 5C).
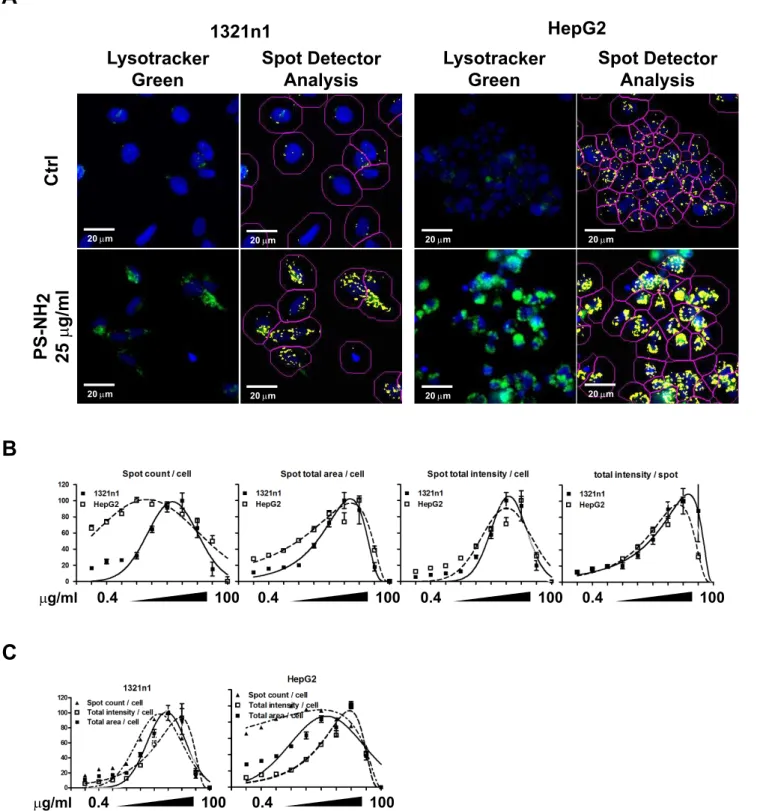
High Content Analysis correlates lysosomal properties with cell death induced by PS-NH2NPs
Previous research from our group showed that PS-NH2 NPs
caused swelling of the lysosomes at concentrations between 25– 100mg/ml as part of the apoptotic process [47]. As our HCA approach showed a dose-dependent increase in the total cellular
fluorescence of the lysosomes after exposure to PS-NH2 for
24 hours we decided to perform a detailed correlation of size and intensity of Lysotracker positive compartments in the images acquired from two representative cell lines, 1321N1 and HepG2 cells. Although this software analysis is performed on wide field
epifluorescence microscopy images, it could distinguish acidified compartments as individual objectswhich might vary in size and intensity within the cell population as consequence of exposure and accumulation of NPs. As illustrated in figure 6A, the Spot Detection Bio-application identified highly acidic compartments positive for the Lysotracker green staining.
The Spot Detector analysis measured the number of identified positive fluorescent objects (spots), their intensity and area for each cell, and the intensity of individual spots. The average values of 30 images from three wells of a representative dose response experiment for 1321N1 and HepG2 cells were plotted in Fig. 6B. HepG2 cells showed a higher degree of vacuolation, but underwent a comparable dose response to 1321n1 cells. By looking at the individual graphs we observed a similar trend in the increase of spot numbers, area and intensity, but a closer observation of the different parameters integrated in the same plot revealed more dynamic inter-relationships. Within the same cell line and the same experiment the spot numbers/cell increased at the lowest concentration followed by an increase in the cellular area and lastly by an increase in the intensity/cell; similarly the
Figure 3. Exposure to PS-NH2NPs for 24 hours caused alteration of all the parameters resulting in cell death while COOH or PS-Plain NPs did not exert any effect.The indicated cell lines exposed to vehicle (ctrl) or increasing concentrations of PS plain or PS-NH2NPs for
24 hours were acquired using HCA to assess changes in nuclear morphology (Hoechst), mitochondrial membrane potential (TMRM), cytosolic calcium levels (Fluo-4), lysosomal acidification (Lysotracker green), and plasma membrane integrity (TOPRO-3); The graphs show for each cell line and each parameter the dose dependent change caused by PS-NH2NPs (continuous line) while PS-COOH NPs did not cause any effect (dashed line). Dose
responses for PS-Plain NPs were not shown as they overlapped with PS-COOH dose responses. Data are shown as average+/2SD of 45 acquired
images from three independent experiments. Curve fitting and EC50/IC50 were calculated as described in the Methods. Fluo-4 and Lysotracker green dose response plots were fitted with a gaussian curve for visual purposes only.
doi:10.1371/journal.pone.0108025.g003
Figure 4. Sequences of EC50 thresholds suggest that all cell lines tested except Raw264.7 execute apoptotic cell death, while Raw264.7 undergo a non-regulated form of cell death.EC50/IC50for each parameter measured for the selected cell lines exposed to vehicle
(ctrl) or increasing doses of PS-Plain, PS-COOH or PS-NH2NPs, for 24 hours or 72 hours were calculated as described in the Methods. EC50/IC50
measured values after exposure for 24 hours (A). C. Schematic representation showing EC50/IC50 threshold sequences as predictive of time sequences. The graphs and sequences of EC50 shown were derived from the measurements obtained for 1321n1 cells. After 24 hours exposure the sequence of thresholds suggests that all cell lines except RAW264.7 underwent apoptosis following initial lysosomal damage; the EC50 thresholds observed for RAW264.7 suggest a sudden/non regulated mechanism of cell death compatible with necrosis. The EC50/IC50 values for all the parameters analysed shifted to lower concentrations after exposure for 72 hours, suggesting that longer exposure can lead to potential toxicity for doses that resulted non toxic after 24 hour exposure.
µ
µg / m l M T S T M R M P I T O P R O - 3
RAW2 6 4.7 9 6 1 7 6 . 6
H E K 2 9 3 4 2 2 4 7 5 3 0
P S - N H 2
Figure 5. High Content Analysis shows comparable sensitivity to established cell viability assays.HEK293 and RAW264.7 cells were exposed to vehicle (ctrl) or increasing concentrations of PS-COOH or PS-NH2for 24 hours; Cellular response was evaluated by HCA, MTS or PI uptake.
spot numbers started decreasing at concentrations higher than 12.5mg/ml, followed by a decrease in the area and intensity of the spots (Fig. 6C). These identified sequences correlate very well with the previous observations on the swelling and rupturing of lysosomes caused by PS-NH2NPs.
PS-NH2NPs cause loss of lysosomal functionality through
accumulation of neutral- and phospholipids
We have identified that increase in acidity associated with swelling of the lysosomal compartments is a common feature observed in all the cell lines investigated exposed to PS-NH2NPs,
and together with our previous finding it exposes a scenario where lysosomal damage is the triggering event that starts the apoptotic cascade [40]; we decided therefore to investigate the mechanisms associated with PS-NH2 NPs-induced lysosomal damage. It was
observed already many years ago that amphyphylic cationic drugs caused lysosomal damage through accumulation of lipids inside the lysosomes of cells, a phenomenon called lipidosis [48], and later it was suggested that a specific class of cationic drugs, aminoglycosides, were able to bind polar lipids and accumulate them in the lysosomes, causing the formation of phospholipid-containing myeloid bodies, that would cause the lysosomal membrane to stretch and eventually rupture. More recently it was suggested also that cloride channels expressed on the lysosomal membrane are central in the regulation of the proton balance inside the lysosomes [49]. As these observations were very similar to the swelling and rupturing of lysosomes observed by us previously [27] and in this study, we applied the LipidTOX phospholipidosis and steatosis detection kit for High Content Screening (Life Technologies) to assess accumulation of neutral-and phospholipids in 1321N1 neutral-and HepG2 cells exposed to increasing doses of PS-NH2NPs (as in previous experiments) for
24 hours and 48 hours. Representative images of cells exposed to 25mg/ml PS-NH2NPs following HCA showed that indeed there
was a substantial accumulation of both neutral and phospholipids in both cell lines; moreover although the images were acquired through an epifluorescence microscope it was observed that the fluorescence of the neutral lipid stain and that of the phospholipid stain were separate, suggesting that lipids of different nature were accumulated in different compartments. Exposure to PS-COOH NPs on the contrary did not cause lipid accumulation (Fig. 7A). The analysis of the fluorescence intensity over the different doses confirmed a dose-dependent increase in accumulated neutral and phospholipids in both 1321N1 and HepG2 cells after 24 or 48 hour exposure, which correlated well with the induction of cell toxicity, as shown by the dose-dependent reduction in cell numbers per field of view (Fig. 7B). The dose-dependent increase in phospholipid and neutral lipid staining potentially reflects different engagement of the lysosomal pathway with different lipidic vescicles; the observed reduction in fluorescence staining observed after 24 or 48 hours exposure could be correlated with the dismantling of membrane structures during the apoptotic process. It is worth noting that the phospholipid staining was applied at the start of the experiment, according to manufacturer’s instructions, while the neutral lipid staining was applied at the end of the experiment. The different application time of the two stainings could account for the different reduction occurring in the staining intensity, which was observed at doses higher than 25mg/
ml (phospholipid staining) or at doses higher than 50mg/ml
(neutral lipid staining). The dose response graphs also confirmed that PS-COOH NPs did not cause accumulation of lipids in the cells and did not cause lysosomal damage. Interestingly, when comparing the dose response curve of the lysotracker green and the phospholipid stain after 24 hour exposure to PS-NH2 NPs
from independent experiments we observed a very good overlap, particularly for the HepG2 cells, suggesting that there is a tight correlation between the accumulation of intracellular phospholip-ids and the acidification of lysosomal compartments; this correlation could suggest that the lysosomal damage caused by
PS-NH2NPs could be caused by phospholipids trapped on the
surface of the NPs that accumulate inside the lysosomes and generate myeloid bodies, which similarly to aminoglycosides caused swelling and rupture of the lysosomal membrane. Furthermore this observation also suggests that lysotracker green could be used as a predictive marker for accumulation of phospholipids inside lysosomes caused by cationic NPs.
Human primary astrocytes show a very similar response to 1321N1 astrocytoma cells after exposure to PS-NH2
NPs
Cancer-derived cell lines are widely used asin vitropredictive models of human toxicity; these cell lines though might carry genetic mutations in survival/apoptosis cellular pathways that may alter the response to toxic agents, including potentially NPs [50– 54]; in order to assess this possibility we compared human 1321N1 astrocytoma cells with human NHA primary astrocytes exposed
for 24 hours to the same doses of PS-COOH and PS-NH2NPs;
since the culturing conditions for primary astrocytes are different than the cell lines previously investigated, i.e. cells are grown in medium supplemented with 3% FBS, we performed DLS measurements to assess size distribution of COOH and
PS-NH2NPs in medium supplemented with 3% FBS and exposed
both cell lines to these NPs for 24 hours in medium supplemented with 3% FBS. To allow us to compare the results with our previous observations we also exposed both cell lines to NPs in medium supplemented with 10% FBS. DLS size distribution measurements showed that both NPs are increasingly agglomer-ated once dispersed in cell culture medium supplemented with 3% FBS (Fig. 8A, Figure S8 in File S1), suggesting that the ratio between proteins and NPs is not sufficient to fully stabilise the surface of NPs; HCA performed on both cell types showed that exposure in medium supplemented with 3% FBS generated dose-response curves at lower concentrations compared to exposure in medium supplemented with 10% FBS, and in both experimental conditions NHA astrocytes were slightly more sensitive than 1321N1 astrocytoma cells (Fig. 8B). Analysis of the EC50/IC50 highlighted that in both experimental conditions Lysotracker green gave the lowest EC50 for both cell lines and the same sequence of EC50/IC50 thresholds was identified as previously observed. Moreover NHA cells displayed EC50/IC50 values that were lower than what observed in 1321N1 cells, although still in the same fold range (Fig. 8C). These data suggest that once established that 1321N1 astrocytoma cells are slightly more resistant than their primary counterpart, however both cell lines
TOPRO-3. C. EC50/IC50 thresholds and grey scale conditional formatting to highlight low and high thresholds. Cell imaging using TMRM and TOPRO-3 resulted as sensitive as MTS or flow cytometric analysis of PI uptake. HCA Data are shown as average+/2SD of 45 acquired images from three
independent experiments. MTS and PI uptake data are shown as average+/2SD of thee independent experiments performed in triplicate. Curve
Figure 6. PS-NH2NPs cause dose-dependent changes in lysosomal properties.I321N1 and HepG2 cells were exposed to vehicle (ctrl) or
increasing concentrations of PS-COOH or PS-NH2NPs for 24 hours and analysed by HCA. The Spot Detection Bioapplication was used to analyse the
Lysotracker green positive vesicles inside the exposed cells. A. Representative images of cells exposed to vehicle or 25mg/ml PS-NH2NPs showing the
increased Lysotracker green fluorescence and the analysis performed using the Spot Detector Bioapplication. Scale bar = 20mm. B. Dose-dependent
changes parameters associated with Lysotracker green positive vesicles: counts, area and intensity of Lysotracker green positive vescicles for each cell were calculated; dose dependent changes in individual spots were also recorded. C. Comparison among spot counts, spot total area and spot total intensity/cell within each cell line. The results suggest that increasing concentrations of PS-NH2NPs cause swelling of lysosomes, as indicated by
increased Lysotracker green intensity, followed by a reduction in spot counts and reduciton in the spot area/cell and their intensity, indicative of lysosomal rupture. Data are shown as average+/2SD of object numbers, fluorescence intensity, area per cell, or average fluorescence intensity per
identified object respectively from a representative experiment. Data were fitted with a gaussian curve for visual purposes only. doi:10.1371/journal.pone.0108025.g006
could be used as a reliable cell model to predict the response of glial cells to NPs’ exposure.
Discussion
Amine modified polystyrene (PS-NH2) NPs are well
charac-terised NPs both in terms of their physico-chemical characteristics in biological fluids and their induction of apoptosis in cultured cells; they are therefore a good candidate as positive control nanoparticle for apoptosis and for the implementation and validation ofin vitrotesting platforms.
This is the first comprehensive study where several cell lines representative of different organs in the body were compared for their response to PS-NH2 NPs, using a High Content Analysis
appraoch that measures several parameters of cellular toxicity simultaneously.
The comparison of different cell lines exposed to the same amine-modified polystyrene NPs in the same experimental conditions showed that with the exception of Raw 264.7 all the other cell lines investigated had the same sequence of EC50/IC50 thresholds, starting with lysosomal acidification, followed by mitochondrial depolarisation, and simultaneous nuclear conden-sation, cytosolic calcium increase and plasma membrane permea-bilization. The identified sequence is consistent with apoptotic cell death and confirms previous observations that amine-modified polystyrene NPs induce apoptosis in 1321N1 cells [40]. On the contrary for Raw264.7 cells we observed that the EC50/IC50 thresholds were very close, moreover the nuclear morphological changes observed differ from the other cell lines investigated. While nuclear condensation was observed generally in all the cell lines investigated, Raw264.7 cells exposed to increasing concen-trations of PS-NH2NPs showed dose-dependent nuclear swelling,
which is indicative of a different mechanism of cell death, i.e. necrosis. It was indeed demonstrated recently by a very comprehensive study that human macrophages exposed to PS-NH2NPs underwent necrotic cell death [55].
The similar thresholds observed for cytosolic calcium increase and plasma membrane permeabilization suggests that the observed increased cytosolic calcium was a late event in the apoptotic cascade and was potentially caused by influx of extracellular calcium through the depolarised/permeabilized plasma membrane. Further investigation is required to analyse specific intracellular calcium signalling connected to the cell death pathway.
The different cell death outcomes observed in Raw264.7 and the other cell lines investigated are indeed intriguing and raise the question on the biological variables that control them; we believe that such differences could be explained by diverse cell uptake rates of the amine-modified NPs. The Raw264.7 macrophages are by definition scavenger cells programmed to segregate foreign bodies therefore activating the primary immune response; moreover in a previous publication [56], our group showed that
Raw264.7 cells display higher uptake rates of carboxyl- modified polystyrene NPs.
The parameter identified with lower EC50 was Lysotracker green, an acidotrophic fluorophore which accumulates in acidic compartments. This suggests that alteration of the lysosomes could be the factor that triggers the apoptotic/necrotic response, which is consistent with our previous findings that NPs accumulate in the lysosomes as their final destination in the cells [21,27] and with a time resolved study showing that indeed acidification of the lysosomes is the first event triggered in the apoptotic pathway activated by PS-NH2NPs [47]. These finding show how the series
of EC50 thresholds could be predictive of temporal sequences of events in the apoptotic cascade; by comparing the Lysotracker green EC50 thresholds of Raw264.7 and the other cell lines exposed to PS-NH2NPs we could also observe that the EC50 is
significantly lower for Raw267.4 cells, supporting further the hypothesis that these cells may have higher uptake rates compared to the other cell lines investigated and therefore suggesting a thresholding effect where a higher uptake rate can cause a switch between apoptotic to necrotic cell death. This phenomenon has been well characterised for chemically-induced cell death where molecular mediators such as ATP or nitric oxide have been identified as responsible for the switch [57]; also glutamate excitotoxicity has been reported to activate apoptosis or necrosis in primary neurons using differential activation of calcium-mediated pathways [58,59].
The cellular and molecular pathways associated with acidifica-tion of lysosomes following exposure to PSNH2NPs have not been
clarified yet and many theories have been formulated. It was shown already in the 1970’s that cationic drugs caused accumu-lation of polar lipids in the lysosomes [48,60]; in the case of aminoglycosides, for example, their accumulation in the lysosomes and their interaction with phospholipids would lead to accumu-lation of phospholipid-containing myeloid bodies that cause the lysosomal membranes to stretch and eventually rupture [61]. By measuring accumulation of neutral and phospholipids in cells
exposed to PSNH2 NPs we demonstrated that indeed the
accumulation of PS-NH2 NPs in lysosomes not only activated
apoptotic or necrotic cell death but it also caused impaired lysosomal functionality. Potentially similarly to aminoglycosides
PS-NH2NPs could cause, among other phenomenons,
accumu-lation of myeloid bodies that ultimately would be responsible for the rupture of the lysosomal membranes and release of lysosomal contents.
A current theory to explain the effect of cationic NPs on lysosomal physiology suggests that once cationic NPs accumulate in the lysososmes they cause an influx of H+, which could be followed by accumulation of water by osmosis, therefore also resulting in swelling and eventual rupture of the lysosomal membrane due to hosmotic shock; the mechanisms proposed to explain this phenomenon include the proton sponge effect, i.e. the buffering potential of the surface of NPs could lead to excessive
Figure 7. PS-NH2NPs cause dose-dependent accumulation of phospholipids and neutral lipids in 1321N1 and HepG2 cells.1321n1
and HepG2 cells were exposed to vehicle (ctrl) or increasing concentrations of PS-COOH or PS-NH2NPs for 24 or 48 hours and stained with the
LipidTOX phospholipidosis and steatosis detection kit (Life Technologies). A. Representative images of 1321N1 and HepG2 cells exposed to vehicle or 25mg/ml PS-NH2and PS-COOH NPs for 24 hours. PS-NH2NPs caused intracellular accumulation of phospho- and neutral lipids. Scale bar = 20mm. B.
Graphs showing dose-dependent reduction in cell numbers and associated intracellular accumulation of phospho- and neutral lipids after exposure to NPs for 24 or 48 hours. Dose-dependent accumulation was observed in both cell lines after exposure to PS-NH2NPs; PS-COOH NPs did not cause
lipid accumulation nor altered the nmbers of cells acquired. C. Comparison of Lysotracker Green and phospholipid accumulation after exposure to increasing concentrations of PS-NH2NPs for 24 hours. Significant overlap can be observed suggesting that lysosomal swelling is closely correlated
with lipid accumulation caused by PS-NH2NPs. Data are shown as average+/2SD of 45 acquired images from three independent experiments. Data
were fitted with a gaussian curve for visual purposes only. doi:10.1371/journal.pone.0108025.g007
influx of protons in the lysosomes, although the current literature suggests that this mechanism could be cell type dependent [26].
Interestingly it was recently reported that the cloride channel ClC-7 on the lysosomal membrane is a Cl2
/H+
exchanger [49]; this ion transporter exchanges Cl2
ions with H+
as a buffering mechanism for the pH of the lysosomal environment. In light of this we could hypotesize that inbalances in the receptor activity
generated by the positive surfaces of accumulated NPs may cause excessive influx of H+in the lysosomes; such theory also provides a good correlation with the experimental evidence shown in this manuscript and previous publications from our group and supports impairement in functionality of lysosomes in cells exposed to lethal concentrations of PS-NH2 NPs, which may results in
impaired recycling of endosomal vescicles and subsequent µ
µg / m l C e l l c o u n t N u c l e a r s i z e
N u c l e a r
I n t e n s i t y T M R M
L y s o t r a c k
e r g r e e n T O P R O - 3
1 321 N 1 > 1 00 > 1 00 > 1 00 > 1 00 > 1 00 > 1 00
N H A > 1 00 > 1 00 > 1 00 > 1 00 > 1 00 > 1 00
1 321 N 1 20 60 50 1 4 1 2 70
N H A N A 2 30 3 3 80
1 321 N 1 > 1 00 > 1 00 > 1 00 > 1 00 > 1 00 > 1 00
N H A > 1 00 > 1 00 > 1 00 > 1 00 > 1 00 > 1 00
1 321 N 1 5 43 1 4 1 2 3. 5 55
N H A 9 1 2 20 3 1 62
1 0 % F B S
P S-C O O H
P S-N H 2
3 % F B S
P S-C O O H
P S-N H 2
PS-NH2 2 74 2 .5 0 .54 0 .0 3
PS-C OOH 113 .1 1.7 0 .2 6 0 .0 0 3
3 % F B S 2 4 ho ur s
Z -A ve ( d .nm)
SD ( Z
-A ve ) PD I SD ( PD I)
Figure 8. Primary human astrocytes respond to PS-NH2and PS-COOH comparably to 1321N1 astrocytoma cells.1321N1 and NHA cells
were exposed to vehicle (ctrl) or increasing concentrations of PS-COOH or PS-NH2NPs for 24 hours and analysed using HCA. Comparison of results
obtained between the two cell lines in DMEM supplemented with 10% FBS (A) or with 3% FBS (B). In the graphs 1321n1 cells are represented by the continuous line (&) while HNA cells are represented by the dashed line (%) C. EC50/IC50 measurements for both cell lines exposed to NPs in presence of 10% or 3% FBS. NHA primary astrocytes showed slightly higher sensitivity than 1321N1 astrocytoma cells, with EC50/IC50 values in the same order of magnitude. Data are shown as average+/2SD of 30 acquired images from a representative experiment. Curve fitting and EC50/IC50
were obtained as described in the Methods. Fluo-4 and Lysotracker green dose response plots were fitted with a gaussian curve for visual purposes only.’’
accumulation of lipidic structures resulting from the fusion of endosomes and lysosomes.
This novel finding, together with the good overlap observed between the Lysotracker green and the phospholipid accumulation dose response curves suggests a good correlation between acidification of the lysosomes measured using lysotracker green and impaired lysosomal functionality caused by accumulation of neutral and phospholipids.
Our HCA platform demonstrated the power to resolve different cell death pathways according to differences in nuclear morphol-ogy and different threshold sequences of EC50/IC50 of the analysed parameters, adding to the screening approach a mechanistic interpretation of the cellular pathways involved; the nuclear swelling observed in Raw264.7 cells opposed to apoptotic nuclear condensation observed in the other cell lines, together with the absence of EC50 threshold sequences for the parameters analysed suggests a sudden non-regulated cell death, consistent with necrosis, as recently observed by Lunov O. [55]. The different cell death pathways activated following exposure to amine-modified polystyrene NPs are currently being investigated. Cancer-derived cell lines are known to carry genetic mutations that may affect their response to cytotoxic stimuli, mainly associated with defects in the apoptotic pathways, or over-activation of survival pathways [50–54]. In light of this we were interested to compare the cell lines tested with the equivalent primary cell model. We compared the 1321n1 astrocytoma cells with NHA primary human astrocytes exposed to PS-NH2and
PS-COOH NPs; since 1321n1 and NHA cells are grown in different culturing conditions we tested both cell lines in both culturing conditions. Interestingly we observed that the two cell lines showed
very comparable dose response curves to PS-NH2 NPs in both
culturing conditions, suggesting that 1321n1 cells show an apoptotic response that is comparable to primary human astrocytes in the specific culturing conditions tested and for the parameters investigated, and they could be considered as a reliable model for investigation of toxicity induced by NPs.
Overall the HCA platform showed comparable sensitivity to OECD tests such as the MTS or PI uptake, with the advantage of measuring several parameters simultaneously while requiring little manipulation of the samples; HCA could therefore be a very powerful tool to accelerate safety testing and keep the pace with the many engineered nanomaterials generated, in compliance with OECD guidelines. Another advantage of the HCA platform is that it is independent from any particular cell type and it could
therefore be implemented using advancedin vitromodels such as cell monolayers representing biological barriers, co-cultures or even three-dimensional models representing organ-like structures; such advanced models, paired with the appropriate biological fluid could exploit the full analytical and screening potential of HCA for a realistic safe assessment performedin vitro, reducing greatly the need for animal testing.
Conclusions
Understanding the cellular pathways activated by nanomaterials once they get in contact with biological systems and implemen-tation of high throughputin vitromethods for safety assessment of
nanomaterials are key factors to accelerate development of nanotechnology, both from the scientific point of view of determining the fate of nanoparticles in biological organisms, and further build accurate predictive models to simulate such processes, but also for the aspect of promoting safer use of nanotechnology in commercial products.
With this study we have implemented and validated anin vitro
High Content Analysis platform that lays the foundations to achieve such goals. Mechanistic data collected using HCA in a rapid and reproducible format has the potential to feed into system biology predictive models and accelerate access of nanomaterials to the market.
Supporting Information
File S1 Supporting figures.
(DOCX)
Acknowledgments
The authors would like to thank Dr. Jeffrey Haskins and Dr. Chandrasekaran at Thermo Scientific USA for their support with the data analysis. Dr. Sonia Ramirez Garcia is also acknowledged for her technical support with preparation of nanoparticle dispersions. Use of the UCD Flow Cytometry Core facility is also acknowledged.
Author Contributions
Conceived and designed the experiments: SA AS PJO KAD. Performed the experiments: SA DG. Analyzed the data: SA DG. Contributed reagents/materials/analysis tools: KAD. Contributed to the writing of the manuscript: SA AS DG KAD.
References
1. Xiao F, Song J, Gao H, Zan X, Xu R, et al. (2012) Coating graphene paper with 2D-assembly of electrocatalytic nanoparticles: a modular approach toward high-performance flexible electrodes. ACS Nano 6: 100–110.
2. Wu W, Bai S, Yuan M, Qin Y, Wang ZL, et al. (2012) Lead zirconate titanate nanowire textile nanogenerator for wearable energy-harvesting and self-powered devices. ACS Nano 6: 6231–6235.
3. Meng H, Mai WX, Zhang H, Xue M, Xia T, et al. (2013) Codelivery of an Optimal Drug/siRNA Combination Using Mesoporous Silica Nanoparticles To Overcome Drug Resistance in Breast Cancer in Vitro and in Vivo. ACS Nano 7(2): 994–1005.
4. Sonkaria S, Ahn SH, Khare V (2012) Nanotechnology and its impact on food and nutrition: a review. Recent Pat Food Nutr Agric 4: 8–18.
5. Nohynek GJ, Dufour EK (2012) Nano-sized cosmetic formulations or solid nanoparticles in sunscreens: a risk to human health? Arch Toxicol 86: 1063– 1075.
6. Boraschi D, Costantino L, Italiani P (2012) Interaction of nanoparticles with immunocompetent cells: nanosafety considerations. Nanomedicine (Lond) 7: 121–131.
7. Boczkowski J, Hoet P (2010) What’s new in nanotoxicology? Implications for public health from a brief review of the 2008 literature. Nanotoxicology 4: 1–14. 8. Kim BY, Rutka JT, Chan WC (2010) Nanomedicine. N Engl J Med 363: 2434–
2443.
9. Nowack B, Ranville JF, Diamond S, Gallego-Urrea JA, Metcalfe C, et al. (2012) Potential scenarios for nanomaterial release and subsequent alteration in the environment. Environ Toxicol Chem 31(1): 50–59.
10. Alessandrelli M, Polci ML (2011) CLP application to nanomaterials: a specific aspect. Ann Ist Super Sanita 47: 146–152.
11. Hoet PH, Bruske-Hohlfeld I, Salata OV (2004) Nanoparticles - known and unknown health risks. J Nanobiotechnology 2: 12.
12. De Jong WH, Hagens WI, Krystek P, Burger MC, Sips AJ, et al. (2008) Particle size-dependent organ distribution of gold nanoparticles after intravenous administration. Biomaterials 29: 1912–1919.
13. van der Zande M, Vandebriel RJ, Van Doren E, Kramer E, Herrera Rivera Z, et al. (2012) Distribution, elimination, and toxicity of silver nanoparticles and silver ions in rats after 28-day oral exposure. ACS Nano 6: 7427–7442. 14. Sousa F, Mandal S, Garrovo C, Astolfo A, Bonifacio A, et al. (2010)
Functionalized gold nanoparticles: a detailed in vivo multimodal microscopic brain distribution study. Nanoscale 2: 2826–2834.
15. Pietroiusti A, Campagnolo L, Fadeel B (2012) Interactions of Engineered Nanoparticles with Organs Protected by Internal Biological Barriers. Small 9(9– 10): 1557–1572.
16. Cedervall T, Lynch I, Lindman S, Berggard T, Thulin E, et al. (2007) Understanding the nanoparticle-protein corona using methods to quantify exchange rates and affinities of proteins for nanoparticles. Proc Natl Acad Sci U S A 104: 2050–2055.
17. Walczyk D, Bombelli FB, Monopoli MP, Lynch I, Dawson KA (2010) What the cell ‘‘sees’’ in bionanoscience. J Am Chem Soc 132: 5761–5768.
18. Monopoli MP, Walczyk D, Campbell A, Elia G, Lynch I, et al. (2011) Physical-chemical aspects of protein corona: relevance to in vitro and in vivo biological impacts of nanoparticles. J Am Chem Soc 133: 2525–2534.
19. Monopoli MP, Aberg C, Salvati A, Dawson KA (2012) Biomolecular coronas provide the biological identity of nanosized materials. Nat Nanotechnol 7: 779– 786.
20. Jiang X, Rocker C, Hafner M, Brandholt S, Dorlich RM, et al. (2010) Endo-and exocytosis of zwitterionic quantum dot nanoparticles by live HeLa cells. ACS Nano 4: 6787–6797.
21. Shapero K, Fenaroli F, Lynch I, Cottell DC, Salvati A, et al. (2011) Time and space resolved uptake study of silica nanoparticles by human cells. Mol Biosyst 7: 371–378.
22. Arvizo RR, Bhattacharyya S, Kudgus RA, Giri K, Bhattacharya R, et al. (2012) Intrinsic therapeutic applications of noble metal nanoparticles: past, present and future. Chem Soc Rev 41: 2943–2970.
23. Kim JA, Aberg C, Salvati A, Dawson KA (2011) Role of cell cycle on the cellular uptake and dilution of nanoparticles in a cell population. Nat Nanotechnol 7: 62–68.
24. Bexiga MG, Varela JA, Wang F, Fenaroli F, Salvati A, et al. (2011) Cationic nanoparticles induce caspase 3-, 7- and 9-mediated cytotoxicity in a human astrocytoma cell line. Nanotoxicology 5: 557–567.
25. Ruenraroengsak P, Novak P, Berhanu D, Thorley AJ, Valsami-Jones E, et al. (2011) Respiratory epithelial cytotoxicity and membrane damage (holes) caused by amine-modified nanoparticles. Nanotoxicology 6(1): 94–108.
26. Xia T, Kovochich M, Liong M, Zink JI, Nel AE (2008) Cationic polystyrene nanosphere toxicity depends on cell-specific endocytic and mitochondrial injury pathways. ACS Nano 2: 85–96.
27. Wang F, Yu L, Salvati A, Dawson KA (2013) The biomolecular corona is retained during nanoparticle uptake and protects the cells from the damage induced by cationic nanoparticles until degraded in the lysosomes. Nanomedi-cine 9(8): 1159–1168.
28. Llambi F, Green DR (2011) Apoptosis and oncogenesis: give and take in the BCL-2 family. Curr Opin Genet Dev 21: 12–20.
29. MacDonald ML, Lamerdin J, Owens S, Keon BH, Bilter GK, et al. (2006) Identifying off-target effects and hidden phenotypes of drugs in human cells. Nat Chem Biol 2: 329–337.
30. Lang P, Yeow K, Nichols A, Scheer A (2006) Cellular imaging in drug discovery. Nat Rev Drug Discov 5: 343–356.
31. Bullen A (2008) Microscopic imaging techniques for drug discovery. Nat Rev Drug Discov 7: 54–67.
32. Young DW, Bender A, Hoyt J, McWhinnie E, Chirn GW, et al. (2008) Integrating high-content screening and ligand-target prediction to identify mechanism of action. Nat Chem Biol 4: 59–68.
33. O’Brien PJ, Irwin W, Diaz D, Howard-Cofield E, Krejsa CM, et al. (2006) High concordance of drug-induced human hepatotoxicity with in vitro cytotoxicity measured in a novel cell-based model using high content screening. Arch Toxicol 80: 580–604.
34. Walsh EG, Maher S, Devocelle M, O’Brien PJ, Baird AW, et al. (2011) High content analysis to determine cytotoxicity of the antimicrobial peptide, melittin and selected structural analogs. Peptides 32: 1764–1773.
35. Ramery E, O’Brien PJ (2014) Evaluation of the cytotoxicity of organic dust components on THP1 monocytes-derived macrophages using high content analysis. Environ Toxicol 29(3): 310–319.
36. Zhang H, Ji Z, Xia T, Meng H, Low-Kam C, et al. (2012) Use of metal oxide nanoparticle band gap to develop a predictive paradigm for oxidative stress and acute pulmonary inflammation. ACS Nano 6: 4349–4368.
37. Lin S, Zhao Y, Xia T, Meng H, Ji Z, et al. (2011) High content screening in zebrafish speeds up hazard ranking of transition metal oxide nanoparticles. ACS Nano 5: 7284–7295.
38. Jan E, Byrne SJ, Cuddihy M, Davies AM, Volkov Y, et al. (2008) High-content screening as a universal tool for fingerprinting of cytotoxicity of nanoparticles. ACS Nano 2: 928–938.
39. George S, Xia T, Rallo R, Zhao Y, Ji Z, et al. (2011) Use of a high-throughput screening approach coupled with in vivo zebrafish embryo screening to develop hazard ranking for engineered nanomaterials. ACS Nano 5: 1805–1817. 40. Bexiga MG, Varela JA, Wang F, Fenaroli F, Salvati A, et al. (2011) Cationic
nanoparticles induce caspase 3-, 7- and 9-mediated cytotoxicity in a human astrocytoma cell line. Nanotoxicology 5(4): 557–567.
41. Ramirez-Garcia S, Chen L, Morris MA, Dawson KA (2011) A new methodology for studying nanoparticle interactions in biological systems: dispersing titania in biocompatible media using chemical stabilisers. Nanoscale 3: 4617–4624.
42. Kim JA, Aberg C, de Carcer G, Malumbres M, Salvati A, et al. (2013) Low dose of amino-modified nanoparticles induces cell cycle arrest. ACS Nano 7: 7483– 7494.
43. Bexiga MG, Kelly C, Dawson KA, Simpson JC (2013) RNAi-mediated inhibition of apoptosis fails to prevent cationic nanoparticle-induced cell death in cultured cells. Nanomedicine (Lond). doi:10.2217/nnm.13.151.
44. Wang F, Yu L, Monopoli MP, Sandin P, Mahon E, et al. (2013) The biomolecular corona is retained during nanoparticle uptake and protects the cells from the damage induced by cationic nanoparticles until degraded in the lysosomes. Nanomedicine 9: 1159–1168.
45. Wang F, Bexiga MG, Anguissola S, Boya P, Simpson JC, et al. (2013) Time resolved study of cell death mechanisms induced by amine-modified polystyrene nanoparticles. Nanoscale 5: 10868–10876.
46. OECD (2013) OECD Guidelines for the Testing of Chemicals. Available: http://www.oecd.org/chemicalsafety/testing/oecdguidelinesforthetestingofchemi cals.htm. Accessed 2014 Aug 31.
47. Wang F, Bexiga MG, Anguissola S, Salvati A, Dawson KA (2014) Time resolved study of cell death mechanism induced by amine-modified polystyrene nanoparticles. In press.
48. Lullmann H, Lullmann-Rauch R, Wassermann O (1978) Lipidosis induced by amphiphilic cationic drugs. Biochem Pharmacol 27: 1103–1108.
49. Weinert S, Jabs S, Supanchart C, Schweizer M, Gimber N, et al. (2010) Lysosomal pathology and osteopetrosis upon loss of H+-driven lysosomal Cl-accumulation. Science 328: 1401–1403.
50. Martin SJ, Green DR (1995) Apoptosis and cancer: the failure of controls on cell death and cell survival. Crit Rev Oncol Hematol 18: 137–153.
51. Yang E, Korsmeyer SJ (1996) Molecular thanatopsis: a discourse on the BCL2 family and cell death. Blood 88: 386–401.
52. Reed JC (1995) Regulation of apoptosis by bcl-2 family proteins and its role in cancer and chemoresistance. Curr Opin Oncol 7: 541–546.
53. Chiarugi V, Magnelli L, Cinelli M, Turchetti A, Ruggiero M (1995) Dominant oncogenes, tumor suppressors, and radiosensitivity. Cell Mol Biol Res 41: 161– 166.
54. Olopade OI, Adeyanju MO, Safa AR, Hagos F, Mick R, et al. (1997) Overexpression of BCL-x protein in primary breast cancer is associated with high tumor grade and nodal metastases. Cancer J Sci Am 3: 230–237. 55. Lunov O, Syrovets T, Loos C, Nienhaus GU, Mailander V, et al. (2011)
Amino-functionalized polystyrene nanoparticles activate the NLRP3 inflammasome in human macrophages. ACS Nano 5: 9648–9657.
56. dos Santos T, Varela J, Lynch I, Salvati A, Dawson KA (2011) Quantitative assessment of the comparative nanoparticle-uptake efficiency of a range of cell lines. Small 7: 3341–3349.
57. Nicotera P, Melino G (2004) Regulation of the apoptosis-necrosis switch. Oncogene 23: 2757–2765.
58. Ientile R, Macaione V, Teletta M, Pedale S, Torre V, et al. (2001) Apoptosis and necrosis occurring in excitotoxic cell death in isolated chick embryo retina. J Neurochem 79: 71–78.
59. D’Orsi B, Bonner H, Tuffy LP, Dussmann H, Woods I, et al. (2012) Calpains are downstream effectors of bax-dependent excitotoxic apoptosis. J Neurosci 32: 1847–1858.
60. Buchheim W, Drenckhahn D, Lullmann-Rauch R (1979) Freeze-fracture studies of cytoplasmic inclusions occurring in experimental lipidosis as induced by amphiphilic cationic drugs. Biochim Biophys Acta 575: 71–80.