CPD
7, 2609–2654, 2011Spring-summer temperatures reconstructed
O. Wetter and C. Pfister
Title Page
Abstract Introduction
Conclusions References
Tables Figures
◭ ◮
◭ ◮
Back Close
Full Screen / Esc
Printer-friendly Version
Interactive Discussion
Discussion
P
a
per
|
Dis
cussion
P
a
per
|
Discussion
P
a
per
|
Discussio
n
P
a
per
Clim. Past Discuss., 7, 2609–2654, 2011 www.clim-past-discuss.net/7/2609/2011/ doi:10.5194/cpd-7-2609-2011
© Author(s) 2011. CC Attribution 3.0 License.
Climate of the Past Discussions
This discussion paper is/has been under review for the journal Climate of the Past (CP). Please refer to the corresponding final paper in CP if available.
Spring-summer temperatures
reconstructed for northern Switzerland
and south-western Germany from winter
rye harvest dates, 1454–1970
O. Wetter1,2and C. Pfister1,2
1
Oeschger Centre for Climate Change Research, University of Bern, Bern, Switzerland
2
Institute of History, Section of Economic-, Social- and Environmental History (WSU), University of Bern, Bern, Switzerland
Received: 28 April 2011 – Accepted: 7 June 2011 – Published: 4 August 2011 Correspondence to: O. Wetter ([email protected])
CPD
7, 2609–2654, 2011Spring-summer temperatures reconstructed
O. Wetter and C. Pfister
Title Page
Abstract Introduction
Conclusions References
Tables Figures
◭ ◮
◭ ◮
Back Close
Full Screen / Esc
Printer-friendly Version
Interactive Discussion
Discussion
P
a
per
|
Dis
cussion
P
a
per
|
Discussion
P
a
per
|
Discussio
n
P
a
per
|
Abstract
This paper presents a unique 517 yr long documentary data – based reconstruction of spring-summer (MAMJJ) temperatures for northern Switzerland and south western Germany from 1454 to 1970. It is composed of 25 partial series of winter grain (secale cereale) harvest starting dates (WGHD) that are in one part based on harvest related
5
bookkeeping of institutions (hospitals, municipalities), in the other part to (early) phe-nological observations. The resulting main Basel WGHD series was homogenised with regard to dating style, data type and altitude. The calibration and verification approach was applied using the homogenous HISTALP temperature series from 1774–1824 for calibration (r=0,78) and from 1920–1970 for verification (r=0.75). The latter result
10
even suffer from the weak data basis available for 1870–1950. Temperature reconstruc-tions based on WGHD are more influenced by spring temperatures than those based on grape harvest dates (GHD), because rye in contrast to vines already begins to grow as soon as sunlight brings the plant to above freezing. The earliest and latest har-vest dates were checked for consistency with narrative documentary weather reports.
15
Comparisons with other European documentary-based GHD and WGHD temperature reconstructions generally reveal significant correlations decreasing with the distance from Switzerland. The new Basel WGHD series shows better skills in representing highly climate change sensitive variations of Swiss Alpine glaciers than available GHD series.
20
1 Introduction
Cereals are the most widely grown crops in Europe since the Neolithic Revolution. Bread was the basic food in most European societies, and before the advent of the railway grain prices were known to be the key indicator of economic activity (Persson, 1999), comparable to the oil-price today (Pfister, 2010). Not surprisingly, European
25
CPD
7, 2609–2654, 2011Spring-summer temperatures reconstructed
O. Wetter and C. Pfister
Title Page
Abstract Introduction
Conclusions References
Tables Figures
◭ ◮
◭ ◮
Back Close
Full Screen / Esc
Printer-friendly Version
Interactive Discussion
Discussion
P
a
per
|
Dis
cussion
P
a
per
|
Discussion
P
a
per
|
Discussio
n
P
a
per
unlike grape harvest dates, hardly yet investigated for climate reconstruction. This pa-per presents a 517 yr long reconstruction of spring-summer (MAMJJ) tempa-peratures from documentary-based winter rye (secale cereale) harvest starting dates covering the period from 1454 to 1970. Documentary sources contain two different kinds of evi-dence, namely a) narrative accounts on (unusual) weather spells and weather-induced
5
disasters and b) (bio) physical proxy indicators such as advances or delays of vegeta-tion in the summer half year (AMJJAS) and the presence or absence of frost, ice and snow-cover in the winter half year (ONDJFM) (Pfister, 1992; Brazdil et al., 2005, Leijon-huvhud et al., 2010). Chroniclers occasionally referred to (bio) physical evidence from the twelfth century as a means to provide data on pronounced temperature anomalies
10
that could be compared over time (Wegmann, 2005; Pfister et al., 2009). However, such narratives are singular and relatively short, ending at the utmost with the death of the observer (Pfister et al., 2009). Long-term biophysical evidence was generated by institutions such as chapters and municipalities in the context of bookkeeping. If entries allow precisely dating the time of weather dependant agricultural or commercial
15
activities, such information can be used as a climate proxy. In general, accounting pro-cedures were not changed in the longer-term yielding century-long series of annual, quantitative and relatively homogeneous proxy data. Grape harvest starting dates (GHD) are the best known example of this kind of data (e.g. Le Roy Ladurie, 1967; Le Roy Ladurie and Baulant, 1980; Burkhardt and Hense, 1985; Lauer and
Franken-20
berg, 1986; Pfister, 1988; Souriau and Yiou, 2001; Chuine et al., 2004; Menzel, 2005; Meier et al., 2007; Rutishauser et al., 2007; Br `azdil et al., 2008; Mariani et al., 2009; Maurer et al., 2009). More recently, Leijonhufvud et al. (2008, 2010) showed that the start of the sailing season each year, as deduced from custom ledgers and other doc-uments related to harbour activities in Stockholm from the early sixteenth century, can
25
CPD
7, 2609–2654, 2011Spring-summer temperatures reconstructed
O. Wetter and C. Pfister
Title Page
Abstract Introduction
Conclusions References
Tables Figures
◭ ◮
◭ ◮
Back Close
Full Screen / Esc
Printer-friendly Version
Interactive Discussion
Discussion
P
a
per
|
Dis
cussion
P
a
per
|
Discussion
P
a
per
|
Discussio
n
P
a
per
|
between the proxy series and the (early) instrumental period, the approach of calibra-tion and verificacalibra-tion (Cook et al., 1994) could be used for these reconstruccalibra-tions.
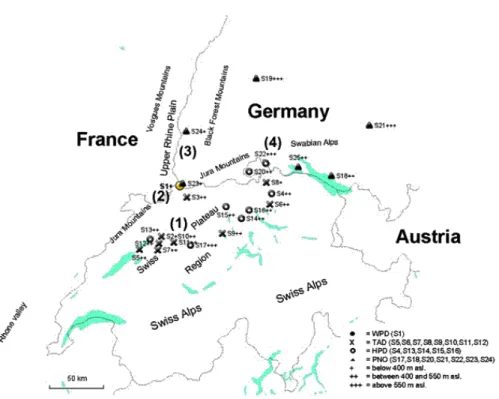
This paper draws on a similar evidence for the start of the cereal harvest from 1454 to 1970 in north-west Switzerland and south-west Germany. The geographical setting of the 25 locations is shown in Fig. 3. Switzerland is located in central Europe and
5
divided up in three major geographic regions, namely the Alps, the Jura Mountains and its foothills and the intermediate region, called the Swiss Plateau, where most of its 7.8 Million inhabitants live (BFS, 2010). The investigation area is situated in a zone of transitional climate influenced by both maritime and continental air masses. Pre-dominant winds come from the west. Other typical winds are the “bise”, a cold wind
10
from northeast being channelled by the Plateau narrowing in southwest, and the north-ern alpine “foehn” (downslope wind from the south), causing remarkable temperature risings. At same altitude temperature is decreasing from west to east due to more continental influenced climate. The climate in the Jura Mountains, located north of the Alps in France, Switzerland and Germany, is colder than that of the Swiss Plateau.
An-15
nual average rainfall varies between 800 mm (in lee of Jura Mountains) and more than 2500 mm in the high Alps, with a summer maximum. The climate in the Jura Moun-tains, located north of the Alps in France, Switzerland and Germany, is colder than that of the Swiss Plateau (Sch ¨uepp et al., 1978; Encyclopaedia Britannica). Disregarding the Swiss Plateau (1) the region of interest concerns the northern foothills of the Jura
20
mountains (2), the Upper Rhine Valley (3) and the Swabian Alps (4) in south western Germany (Fig. 3). The Basel area – situated at the upper end of the Upper Rhine Plain – enjoys an exceptionally mild climate, influenced at times by Mediterranean air currents flowing up the Rhone valley. The Upper Rhine Plain, framed by the French Vosges Mountain range in the west and the German Black Forest Mountain range in
25
CPD
7, 2609–2654, 2011Spring-summer temperatures reconstructed
O. Wetter and C. Pfister
Title Page
Abstract Introduction
Conclusions References
Tables Figures
◭ ◮
◭ ◮
Back Close
Full Screen / Esc
Printer-friendly Version
Interactive Discussion
Discussion
P
a
per
|
Dis
cussion
P
a
per
|
Discussion
P
a
per
|
Discussio
n
P
a
per
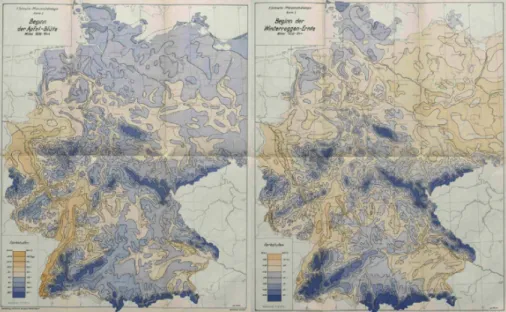
plant phenology, as the example from Germany demonstrates (Fig. 1)
The value of WGHD as a proxy indicator for March to July temperatures was discov-ered by Pfister (1979, 1992). WGHD were mainly investigated in the Northern countries where GHD are not available (Tarand and Kuiv, 1994, Tarand and Nordli, 2001; Nordli et al., 2003). Nordli (2001) used proxy data from five farmers’ diaries in central Norway
5
(from 1805) to assess temperatures in Trondheim before the beginning of systematic instrumental measurements in 1858. The same author provided a summary of the rele-vant work on farmer’s diaries in Norway (Nordli, 2007). Likewise, WGHDs were used in the Czech Republic as a substitute for GHDs (Br ´azdil and Kotyza, 2000; Mozny et al., 2010). Recently, Pribyl et al. (2011) submitted a paper reconstructing April-July mean
10
temperatures from 1256 to 1431 in Norfolk (England) based on grain harvest starting dates from administrative records.
This paper is structured as follows: The first section presents the evidence and ad-dresses its reliability from a historical and scientific point of view. The steps to merge partial series of different proxies into main WGHD series considering proxy-type, dating
15
style and altitude are outlined in the second section. The third section concerns the statistical reconstruction of spring-summer (MAMJJ) temperatures using the calibration and verification approach. In the fourth section, the results of the reconstruction are presented, discussed and compared with other documentary based temperature re-constructions as well as glacier fluctuations in the central Alps. Conclusions are drawn
20
in the fifth section.
2 The evidence
The onset of grain harvesting not only depends from the occurrence of the degree of full ripeness, which is difficult to determine, but also from human decision-making. The onset of rainy spells may postpone the start of the harvest. On the other hand, if the
25
CPD
7, 2609–2654, 2011Spring-summer temperatures reconstructed
O. Wetter and C. Pfister
Title Page
Abstract Introduction
Conclusions References
Tables Figures
◭ ◮
◭ ◮
Back Close
Full Screen / Esc
Printer-friendly Version
Interactive Discussion
Discussion
P
a
per
|
Dis
cussion
P
a
per
|
Discussion
P
a
per
|
Discussio
n
P
a
per
|
of harvest. For these reasons the onset of grain harvest is subsumed by phenologists under the “aprocryphal” (i.e. questionable) phases (DWD, 1991). This premise matters for discussing the evidence used to create the 517 yr long series of WGHD’s. Four kinds of evidence are distinguished:
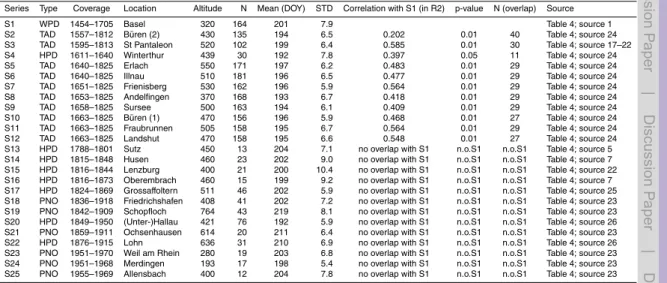
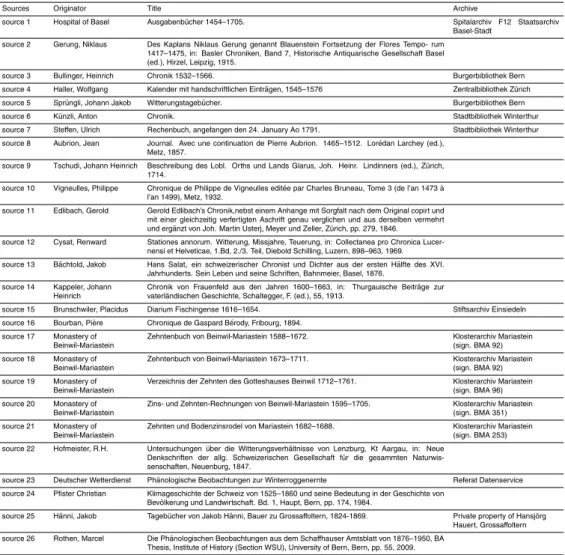
2.1 Wage payment dates (WPD) (Fig. 4; S1)
5
Exploring the account books of the Czech town of Louny Br ´azdil and Kotyza (2000) discovered that the date of wage payments to day labourers paid on Saturdays could be used as a proxy indicator for temperature. The document lists the weekly wages paid on Saturdays specifying the type of work performed, such as hay and grain harvest, work in the vineyards, cutting of ice on the river, carrying out water from flooded cellars
10
etc. The discovery of the two authors matters for Historical Climatology. Account books are among the most frequently available continuous archival documents and hence it suggested itself to look for similar data elsewhere. The authors of the present article looking through the books of daily expenditures kept by the hospital in Basel (Switzerland) were tapping into a climate-historical gold-mine. It is to say that this
15
source contains a wealth of evidence about the beginning of a multitude of different kinds of agricultural field and vineyard work from 1454 to 1705 for the same location (Fig. 4; S1, Table 4; source 1).
The Basel hospital, founded somewhat before 1265, was in the early fourteenth century a municipal institution managed by a fraternity. Wardens and nurses elected by
20
the municipality replaced the friars around 1400. Though the hospital was not funded by the town, both, the clerics as well as the secular administration, were accountable to the town council. A hospital was a profit orientated enterprise in these days rather than a philanthropic institution. For the well-offthe hospital acted as old-age pension and disability insurance in case of corresponding donations. The hospital cared for
25
CPD
7, 2609–2654, 2011Spring-summer temperatures reconstructed
O. Wetter and C. Pfister
Title Page
Abstract Introduction
Conclusions References
Tables Figures
◭ ◮
◭ ◮
Back Close
Full Screen / Esc
Printer-friendly Version
Interactive Discussion
Discussion
P
a
per
|
Dis
cussion
P
a
per
|
Discussion
P
a
per
|
Discussio
n
P
a
per
Under these conditions, the hospital acquired manifold possessions such as tene-ments, commercial buildings, estates, tithes and “bonds”. The town council granted the hospital exemption from tithe and consumption taxes in 1339. In 1436 the hospital already drew earnings from estates in 85 villages situated in today’s Greater Basel Re-gion including neighbouring France, Germany and Switzerland. An appropriate
book-5
keeping was established in the mid 15th century. More than 240 books of expenditures from 1454 to 1705 have survived. Potential climate historical evidence only comes from estates that were directly farmed by the hospital on the basis of hired labour. Un-like the weekly payments customary in the Town of Louny (Br ´azdil and Kotyza, 2000), labourers in Basel were paid at the end of every single working day. The first
appropri-10
ate entry thus represents the actual beginning of the corresponding agricultural activity (see Fig. 2).
The books of daily expenditures did not survive after 1705, though they were most probably continued. In any case, they were not any more archived, contrary to the an-nual accounting books. At least, we are left with more than 240 volumes of manuscript
15
accounts for the period from 1454 to 1705, often hardly legible, to be looked through for the 60 days from mid June to mid August. Few books are missing altogether. Be-tween 1631 and 1673, the accounts concerning grain harvest are not dated and the date of first wage payment for the grain harvest is not given in some other books. The missing date of the earliest harvest in the outstanding warm anomaly of 1473 was
20
complemented from coherent observations by regional chroniclers (Table 4; source 2). Moreover, rye (grain?) harvest dates from the chronicle of the Swiss reformer Heinrich Bullinger (1504–1575) (Table 4; source 3) and the diaries of the theologian Wolfgang Haller (1525–1601) (Table 4; source 4) were used to fill gaps in 1540 and 1555.
2.2 Tithe auction data (TAD) (Fig. 4; S3/S5–S12)
25
CPD
7, 2609–2654, 2011Spring-summer temperatures reconstructed
O. Wetter and C. Pfister
Title Page
Abstract Introduction
Conclusions References
Tables Figures
◭ ◮
◭ ◮
Back Close
Full Screen / Esc
Printer-friendly Version
Interactive Discussion
Discussion
P
a
per
|
Dis
cussion
P
a
per
|
Discussion
P
a
per
|
Discussio
n
P
a
per
|
was the prevalent agricultural system in most of Europe (Titow, 1965; Blum, 1978). Tithe owners were short of staffto monitor the correct payment of the due. Selling the collection of the grain tithe by auction to the highest bidder, usually to a member of the village elite, was a convenient solution. The tithe collector could keep the straw as a compensation for this work. An expert assessed the minimum value of the crop in every
5
tithe district by order of the owner, as soon as the grain was approaching maturity. If the minimum value was not offered in the auction, the owner let the tithe collect by his staff at the expense of the village. A representative of the owner presided the auction that ended in a popular festivity. The acceptance of the offer was laid down as a proof in a protocol. Tithe protocols, in case they are dated, serve as a climate-historical source.
10
Where the rulers of the emerging states adopted the reformation, like in a number of Swiss cantons, they took over the church property and thus also became owner of the tithes. The supply of tithes ended, when dues in kind were generally substituted by taxes in money in the early nineteenth century. In Switzerland, this was the case in the 1820s (Pfister, 1979, 1992).
15
In the following we have to review the uncertainties involved in the use of TAD as a proxy for the starting date of grain harvest. Two major sources of uncertainty are discussed, namely first, the delay between the auction-date and the start of the harvest and, second, the mean altitude of the fields in every tithe district, which is needed for the homogenisation of the series. Sources are silent with regard to the time needed
20
for the procedure of selling tithe by auction in relationship to the start of the harvest, because for the agents this fact was irrelevant. We have reason to assume that time lags were considerable given the fact that a few representatives of the owners had to be present in many auctions in a little while. The actual start of the harvest, decided by the village community after the auction, depended on several factors such as the
25
CPD
7, 2609–2654, 2011Spring-summer temperatures reconstructed
O. Wetter and C. Pfister
Title Page
Abstract Introduction
Conclusions References
Tables Figures
◭ ◮
◭ ◮
Back Close
Full Screen / Esc
Printer-friendly Version
Interactive Discussion
Discussion
P
a
per
|
Dis
cussion
P
a
per
|
Discussion
P
a
per
|
Discussio
n
P
a
per
grown in the “winter field”, where different varieties of winter crops were grown not distinguishing between rye and spelt, which were the main winter crops grown in the area of investigation (Miedaner, 1997). The second uncertainty concerns the mean altitude of the fields within every tithe district, which had to be roughly assumed. The altitude of the main village is often a poor approximation, as villages were usually
5
situated near brooks in the valley floor, whereas the fields around the villages were situated at somewhat higher altitudes.
2.3 “Historic phenological data” (HPD) (Fig. 4; S4/S13–S17/S19 and S21)
Data within modern phenological networks are gathered by observers instructed ac-cording to standardised guidelines. Prior to the establishment of networks, historical
10
plant and animal phenological data (HPD) were laid down by amateurs in their sole discretion (e.g. Rutishauser et al., 2007). In this context, we need distinguishing on the one hand between scientifically motivated early phenologists gathering observa-tions on wild and domestic plants and economically motivated farmers just laying down observations about the time of their agricultural work on the other hand. Historical
15
observations are not necessarily of lower quality. Schnelle (1955) concluded from his vast experience that the most accurate observations were gathered by motivated am-ateurs. However, most early observers were not aware of the importance to lay down the metadata (e.g. altitude, inclination, soil, plant varieties) of their plant observation. The lack of metadata is a major source of uncertainty while working with HPD’s. Most
20
first class historical phenological observations in Switzerland were made before the 1830’s. Subsequent series are rather short, scattered and hardly overlapping, so as to make the building up of a main series difficult and error-prone. Likewise, all TAD series end in the early nineteenth century. The early nineteenth-century discontinuation of all-embracing climate observations in favour of exclusive measurement and
quantifica-25
CPD
7, 2609–2654, 2011Spring-summer temperatures reconstructed
O. Wetter and C. Pfister
Title Page
Abstract Introduction
Conclusions References
Tables Figures
◭ ◮
◭ ◮
Back Close
Full Screen / Esc
Printer-friendly Version
Interactive Discussion
Discussion
P
a
per
|
Dis
cussion
P
a
per
|
Discussion
P
a
per
|
Discussio
n
P
a
per
|
drawn for the years 1824 to 1869 from a recently discovered privately owned first class diary, in which the farmer and deputy Jakob H ¨anni from the village of Grossaffoltern (Canton Bern) on the Swiss Plateau laid down a detailed account of the weather and his activities on the farm (Fig. 4, S17; Table 4; source 25). The evidence on the sub-sequent decade is rather short, scattered and hardly overlapping, so as to make the
5
building up of a main series difficult and error-prone. An isolated initiative to system-atically observe a set of phenological observations alongside meteorological network measurements was taken in Canton Schaffhausen from 1876 (Table 4; source 26). The evidence was published as an addendum to the official register of the Canton. About two dozen wild and cultivated plants and some wild animals, mostly birds, were
10
observed until 1950, albeit with gaps. Moreover, two out of the three original stations stopped their observations from the early twentieth century (Rothen, 2009). The origi-nal observations are lost which makes critical review of the data impossible. The grain harvest dates are not perfect, but of good quality. The parson Johann Jakob Spr ¨ungli (1717–1803) (Table 4; source 5) was the most outstanding historical phenologist in
15
Switzerland. Spr ¨ungli monitored the flowering of a hundred species of wild and do-mestic plants, of nine different fruit trees and the timing of different works in fields and meadows. Every spring he reported on the appearance of 28 different kinds of ani-mals. Alongside he kept an instrumental weather diary in which he also noted down the formation and melting of snow-covers in detail, also for the mountains he could
20
observe from his study. Unfortunately, he had to move to another parish in his lifetime twice, i.e. from Zweisimmen (Bernese Oberland) to Gurzelen near Thun in 1766 and then to the village of Sutz near Biel in 1784, from where his series of rye harvest start-ing dates (S13) originates (Pfister, 1984; Burri and Zenh ¨ausern, 2009). The earliest series of HPD is provided by Anton K ¨unzli (Table 4; source 6) who regularly listed the
25
CPD
7, 2609–2654, 2011Spring-summer temperatures reconstructed
O. Wetter and C. Pfister
Title Page
Abstract Introduction
Conclusions References
Tables Figures
◭ ◮
◭ ◮
Back Close
Full Screen / Esc
Printer-friendly Version
Interactive Discussion
Discussion
P
a
per
|
Dis
cussion
P
a
per
|
Discussion
P
a
per
|
Discussio
n
P
a
per
2.4 Phenological network observations (PNO) (S17–S18/S20/S22–S24)
The data situation in Switzerland between 1825, when TAD’s are not available any more and 1951, when the Swiss phenological observations network was founded, is exceedingly weak. Germany, in contrast, has a long tradition of Phenological network observations. The Historic Phenological Database (HPDB) of the German
Meteorolog-5
ical Service (DWD) contains about 375 000 plant phenological observations, originating from 1460 places in about 80 different regions. HPDB archives more than 500 species of plant observations between 1530 and 1950, whereas by far most of them originate from 1880 until 1941. Gathering phenological observations became mandatory for the observers of the German Meteorological Service in 1936 and such efforts continued to
10
be made, disregarding interruptions during World War II and its aftermath, in both parts of the divided country beyond reunification (DWD, 1991). The observation programme is divided into three main groups, wild plants (1), crops (2), fruit-trees and vines (3). Observations are implemented after standardised manuals including strict instructions (like e.g. the observed place of growth from single plants shall be as representative
15
as possible for the whole area of observance, or observed plants shall not differ more than 50 m of the mean elevation of the designated area of observance, or observations must always be done on the same plant or field during the whole vegetation period and once chosen observation objects shall be observed for as many years as possible etc.) (DWD, 1991). Crop observations, in particular concerning winter rye (secale cereale),
20
are a matter of special interest for this study. The manual defines 9 different observa-tion categories for winter rye. The last – “harvest” – is undeniably easy to be observed whereas observations about physiological stages, like e.g. maturity are difficult to be clearly identified (DWD, 1991; Allen and Lueck, 2002). The introduction of the com-bined harvester thresher radically changed grain harvesting. A combine requires grain
25
CPD
7, 2609–2654, 2011Spring-summer temperatures reconstructed
O. Wetter and C. Pfister
Title Page
Abstract Introduction
Conclusions References
Tables Figures
◭ ◮
◭ ◮
Back Close
Full Screen / Esc
Printer-friendly Version
Interactive Discussion
Discussion
P
a
per
|
Dis
cussion
P
a
per
|
Discussion
P
a
per
|
Discussio
n
P
a
per
|
Statistical tests clearly demonstrated that correlations between temperature and date of harvest significantly weaken if observations after the 1970s are included. This may be explained with the difference of harvesting methods (manual- or harvest by binders vs. harvest by combines) (Dickel, 1972):, the introduction of hybrid sorts and the fact that since the 1970s a multitude of completely new breeds exist that were specially bred
5
for a wide range of different requirements (e.g. earlier achieving the stage of ripeness to avoid heat and drought stress of late summer etc.).
Figure 3 displays the spatial location of the series and their approximate altitude. The WPD series (1) and the TAD (10) and HPD series (8) are located in Switzerland, whereas the PNO series (6) originate from south-western Germany.
10
The WPD Basel series and the majority of the PNO from southwest Germany origi-nate from places situated below 400 m a.s.l. Most of the TAD and HPD series from the Swiss Plateau region were obtained from places situated at altitudes between 400 and 550 m a.s.l. 3 series are situated above 550 m a.s.l.
3 Generation of a homogenised basel WGHD series
15
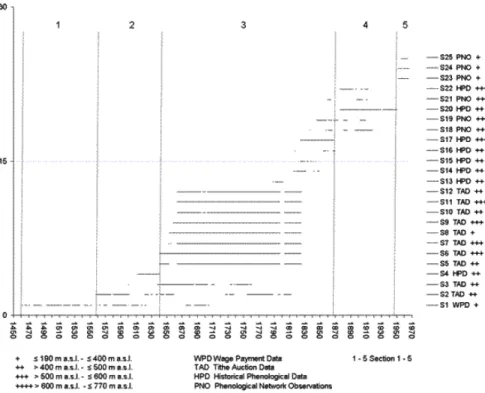
In the previous section it was shown that the WGHD evidence consists of a number of partial series involving four different types of data. This section addresses the issue of merging these partial series into a 517 yr long main series, which is named Basel WGHD series after its longest and most ancient part. The task involved correcting the evidence for dating style, data type and altitude. Figure 4 presents the composition of
20
the Basel WGHD series distinguishing between five sections of different data quality and coverage separated with vertical lines. Metadata of the partial series are contained in table (Table 1). Correlations were calculated from partial original series, most of which do have a sufficient overlap of >10 values and significantly correlate between R2=0.4 and 0.8 (others are marked in red) Table 5; see Supplement.
CPD
7, 2609–2654, 2011Spring-summer temperatures reconstructed
O. Wetter and C. Pfister
Title Page
Abstract Introduction
Conclusions References
Tables Figures
◭ ◮
◭ ◮
Back Close
Full Screen / Esc
Printer-friendly Version
Interactive Discussion
Discussion
P
a
per
|
Dis
cussion
P
a
per
|
Discussion
P
a
per
|
Discussio
n
P
a
per
With regard to the composition of the Basel WGHD series, 5 periods are distin-guished
– The first 103 yr (1454–1556) of the series are exclusively covered by the Basel WPD complementing missing data with sporadic HPD’s.
– The second period (1457–1662) includes the long gap in the Basel WPD series
5
which was complemented to a large extent with 2 TAD and 1 HPD series.
– For the third period (1663–1869) 10 series of TAD’s, overlapping with the WPD series until 1705, and 3 series of HPD’s are available. The gap of TAD’s between 1798 and 1801, related to the abolishment of feudal dues during the short-lived Helvetic Republic installed by the French Revolutionary armies (Hughes, 1975),
10
was filled by the first class HPD observations made by the parson Johann Jakob Spr ¨ungli (Table 5; source 5) (Fig. 4, S13).
– In the fourth period (1870–1950) the main series hinges in some part on isolated partial series of HPD’s carried out by amateurs who often did not provide the metadata needed for assessing data quality, in the other part on high quality early
15
PNO’s from the German Historic Phenological Database (HPDB).
– Section 5: (1951–1970) is completely covered by PNO’s, gathered by standard-ised methods.
In general, the Basel WGHD series is well documented for the pre-instrumental pe-riod, whereas it is of somewhat lower quality from 1870 to 1950, i.e. during a
consider-20
able part of the instrumental period. This shortcoming affects the results of temperature estimates using the approach of calibration and verification (see Fig. 7a and b).
The following paragraph describes the adaptations required to put the partial series on an equal level. This task concerns dating style, altitude and, in the case of TAD’s, estimating the start of the harvest after the auction date.
CPD
7, 2609–2654, 2011Spring-summer temperatures reconstructed
O. Wetter and C. Pfister
Title Page
Abstract Introduction
Conclusions References
Tables Figures
◭ ◮
◭ ◮
Back Close
Full Screen / Esc
Printer-friendly Version
Interactive Discussion
Discussion
P
a
per
|
Dis
cussion
P
a
per
|
Discussion
P
a
per
|
Discussio
n
P
a
per
|
3.1 Homogenisation of dating style
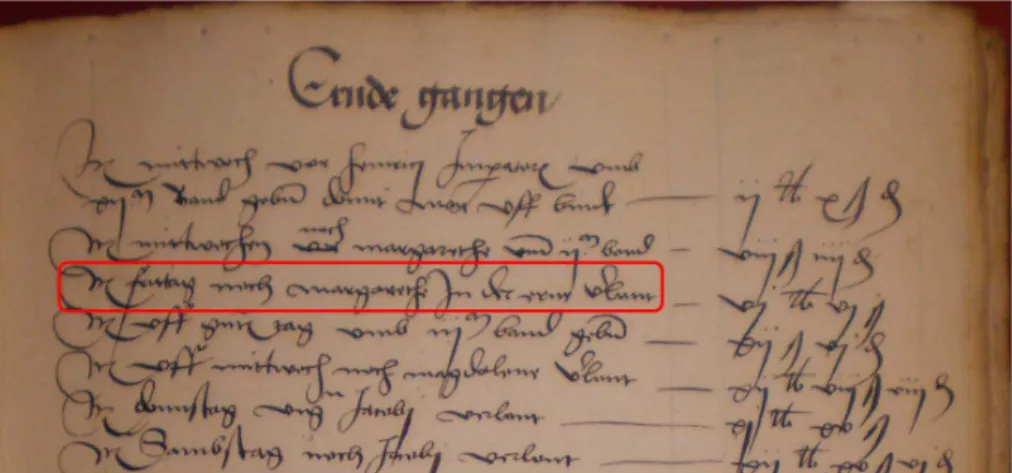
Prior to 1559 dating in the Basel WPD series is given with reference to the ruling Saint of the particular day. The procedure is explained from the example of 1522 (Fig. 2). The reference “Friday after Margaret Day” is decoded by consulting the chronology handbook by Hermann Grotefend (Grotefend, 2007). The first step is to look up the
5
date of the Saints Day. In Basel “Margaret Day” (Margarete) was celebrated on 15 July. In the second step, the Easter date of the year of interest, in 1522 it was 20 April, is determined using the algorithmic Gaussian Easter Formula (Gauss, 1800). The Saints Day in question is looked up in the Easter table for the corresponding year. In 1522 Margaret Day was on a Tuesday. The subsequent Friday, on which the grain harvest
10
started in Basel, was thus 18 July (DOY 199). From 1559 the current system of months and days was used. Dates before 1700 originating from protestant territories (Fig. 4; S1, S2, S4, S5, S6, S7, S8, S10, S11, S12, S13) need to be redated from the Julian to the Gregorian calendar style by adding ten days, whereas series from catholic St Pantaleon (Fig. 4; S3) and Sursee (Fig. 4; S9) are altogether dated in Gregorian style.
15
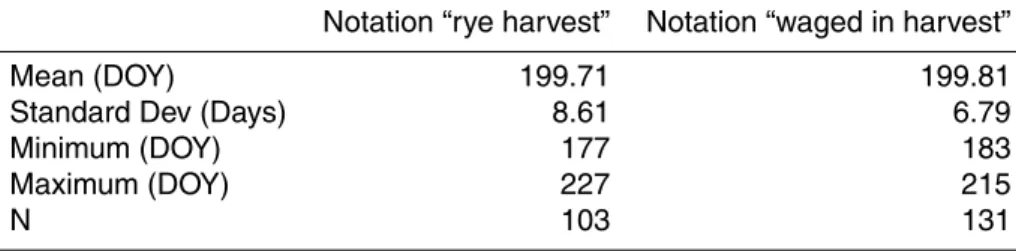
3.2 Type of grain
103 entries in the Basel hospital accounts explicitly refer to rye being first harvested, while in 131 cases the source just mentions “remunerated for harvesting work”. As there is no difference between the statistics obtained for the two denotations (Table 2) it can be assumed that both are equivalent.
20
PNO series clearly have to be rated as the most reliable series. The closeness of the statistical properties of the compiled Basel WPD series to the just neighbouring PNO Weil am Rhein observations as well as to all other PNO series (especially considering mean harvest dates and standard deviations) furthermore supports the supposition of equivalence of both notations and approves the reliability of WPD’s.
CPD
7, 2609–2654, 2011Spring-summer temperatures reconstructed
O. Wetter and C. Pfister
Title Page
Abstract Introduction
Conclusions References
Tables Figures
◭ ◮
◭ ◮
Back Close
Full Screen / Esc
Printer-friendly Version
Interactive Discussion
Discussion
P
a
per
|
Dis
cussion
P
a
per
|
Discussion
P
a
per
|
Discussio
n
P
a
per
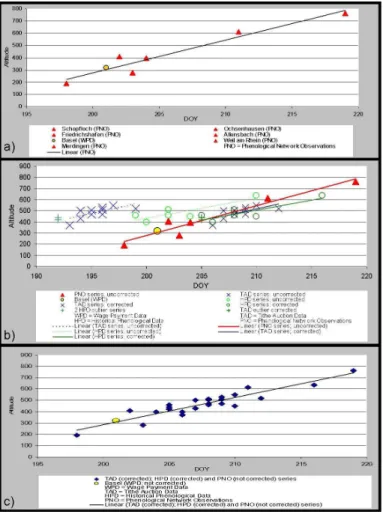
3.3 Homogenisation of data type
Figure 5a demonstrates that Basel WPD series nicely fits into the distribution of altitude depending mean harvest dates of the high quality PNO observations.
Uncertainties concerning TAD- and HPD series, however, need a somewhat more accurate consideration, as the means of these series do not exactly match those of
5
the reliable PNO/WPD series. Figure 5b shows that differences between HPD and PNO/WPD series are not big (light green circles), differences between TAD (blue crosses) and PNO/WPD series by contrast are somewhat more important.
To homogenise TAD- and HPD series to the reliable PNO/WPD series it was nec-essary to add+13 days to TAD and +6 days to HPD series (Fig. 5b). According to
10
Volker Michel, as well as Elisabeth Zechner – both being renowned experts – such differences of ripeness are still observed today and may be explained by a multitude of mutual cumulative reasons, like soil type, differences in slope, grain variety, sowing time, manuring, insulation etc (e-mail communication 18–20 January 2011). The diff er-ence of 6 days between HPD and PNO/WPD series thus should not be overestimated.
15
The difference of 13 days between TAD and PNO/WPD series may be partly explained by the fact that TAD’s represent another kind of proxy. Tithe auctions needed to be held before the harvest took place. It is not known how much time between the auc-tion and the actual harvest usually passed, as tithe aucauc-tion protocols remain silent in this regard. Assuming an average delay between tithe auction and the actual harvest
20
begin of about 7 days, the same difference as between HPD and PNO/WPD turns out (6 days). In doing so, uncertainties about the actual harvest begin after the auction should not be overestimated, given the strong relationship between a sample of 41 local TAD series from 1611 to 1825 and Basel spring-summer (MAMJJ) temperatures ofr=0.86 (Pfister, 1979). By homogenising the HPD and TAD series with the above
25
CPD
7, 2609–2654, 2011Spring-summer temperatures reconstructed
O. Wetter and C. Pfister
Title Page
Abstract Introduction
Conclusions References
Tables Figures
◭ ◮
◭ ◮
Back Close
Full Screen / Esc
Printer-friendly Version
Interactive Discussion
Discussion
P
a
per
|
Dis
cussion
P
a
per
|
Discussion
P
a
per
|
Discussio
n
P
a
per
|
3.4 Homogenisation of altitude
In a last homogenisation step the difference of altitudes needed to be “adapted” to the main Basel WPD series. Regarding the fact of such a strong correlation between altitude and time of harvest (Fig. 5c) this final homogenisation step could easily be done by linear regression. Last but not least all available figures needed to be annually
5
averaged. After having taken these homogenisation steps we may speak from the Basel Winter Grain Harvest Date series (Basel WGHD).
3.5 Calibration – verification
The final Basel WGHD series was compared for the period 1774 to 1970 with the ho-mogeneous HISTALP temperature series (Auer et al., 2007; B ¨ohm et al., 2009), which
10
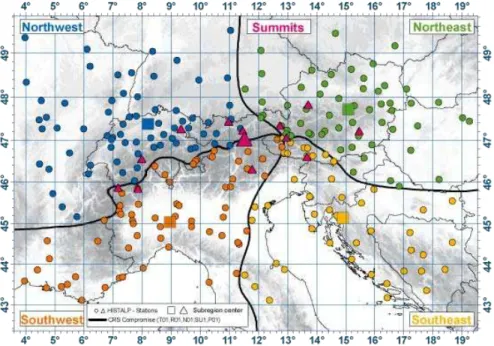
yields monthly anomalies from the 1901 to 2000 average. The area of investigation is situated in the sub-region “Northwest” (see Fig. 6; blue dots). Stepwise linear re-gression revealed that July temperatures were the most important factor, followed by June-, May- and March temperatures, which confirms the result of Pfister (1979). The substantial weight of March temperature agrees with the fact that winter rye (secale
ce-15
reale) actually grows during any warmer days of the winter, when sunlight temporarily brings the plant to above freezing (Wikipedia; http://en.wikipedia.org/wiki/Rye).
Calibration was done during 1774–1824, the first 50 yr of HISTALP temperature anomalies available, when anthropogenic influence on climate is assumed to be marginal (Fig. 7a). The result ofr 0.78 includes a pronounced outlier in March, 1785,
20
when average temperatures were 6.9◦C below the twentieth century mean (Auer et al., 2007).
Verification was done from 1920–1970 (Fig. 7b).
The calibration and verification procedure applied for the two sub periods 1774– 1824 and 1825–1970 confirmed the high reconstruction skill of WGHD, which explains
25
CPD
7, 2609–2654, 2011Spring-summer temperatures reconstructed
O. Wetter and C. Pfister
Title Page
Abstract Introduction
Conclusions References
Tables Figures
◭ ◮
◭ ◮
Back Close
Full Screen / Esc
Printer-friendly Version
Interactive Discussion
Discussion
P
a
per
|
Dis
cussion
P
a
per
|
Discussion
P
a
per
|
Discussio
n
P
a
per
temperature anomalies needed to be further adjusted for a difference in means of +0.3◦C between the calibration periods of HISTALP (1901–2000) and ours (1774–
1824). The bias was corrected by subtracting this difference from the reconstructed series of spring-summer temperatures. It follows from the reconstruction that a diff er-ence of nine days of the Basel WGHD series corresponds to a change of approximately
5
1◦C in March–July temperature anomalies.
4 Result
The result is a reconstruction of 517 yr mean March-July temperature anomalies, based on 25 homogenised grain harvest date series from north-western Switzerland and south-western Germany (1454–1970) (Fig. 8).
10
Figure 8 shows an 11 year high pass filter of reconstructed temperature anomalies. Confidence bounds are drawn on a ±2×Sigma threshold. The “hockey stick”, often seen in temperature reconstructions does not appear here, as the youngest warming trend after the 1970s is not included in the WGHD temperature anomalies reconstruc-tion.
15
For validation reasons we should cross check extremes in time series of proxy data, be it out of natural or societal archives, with narrative data. It has been shown that chroniclers frequently referred to phenological observations to support their descrip-tions of extreme temperature anomalies in the summer half-year (AMJJAS). The sub-sequent paragraph presents such descriptive evidence for the positive and negative
20
extremes.
4.1 Warm extremes
The earliest harvests in the instrumental period (from 1774) are documented in as-cending order for (DOY 186:1822/DOY 187:1868/DOY 188:1846/DOY 189:1842/DOY 190:1862/DOY 191:1811, 1835, 1934). The very early harvests of 1811, 1822 and
CPD
7, 2609–2654, 2011Spring-summer temperatures reconstructed
O. Wetter and C. Pfister
Title Page
Abstract Introduction
Conclusions References
Tables Figures
◭ ◮
◭ ◮
Back Close
Full Screen / Esc
Printer-friendly Version
Interactive Discussion
Discussion
P
a
per
|
Dis
cussion
P
a
per
|
Discussion
P
a
per
|
Discussio
n
P
a
per
|
1846 were all connected to spring-summer intervals in which every single month from March to July was above the twentieth century mean resulting in cumulative warm anomalies of 12.0◦C in 1822, 11.4◦C in 1811 and 7.8◦C in 1846 for the entire interval. In 1868 a cool spring was overcompensated with an extremely warm interval in May and June resulting in a cumulative warm anomaly of 3.7◦C. However, the early harvest
5
in 1842 documented from two places is not supported with corresponding instrumental evidence (Auer et al., 2007). In 1862 and 1934, all months except June were warm re-sulting in a cumulative warm anomaly of 5.4◦C and 4.6◦C. In 1835 the slightly too cold
March and April are overcompensated with warm May, June and July temperatures of 2.4◦C. The rye harvest date for 1947, the warmest summer in the twentieth century, is
10
missing for both post-war Germany and Switzerland.
The earliest data in the pre-instrumental period are documented in ascending order for 1473: DOY 184; 1616: DOY 185; 1540: DOY 186; 1483: DOY 188; 1686: DOY 189;1611, 1645, 1718: DOY 190:1603; 1631: DOY 191.
All of them are connected to narrative documentary evidence on warm springs and
15
summers. The grain harvest in 1473 was the earliest of the 517 yr long investiga-tion period. Chroniclers report full blossoming of [cherry] trees “in February” [Julian Style], i.e. around 9th March in Gregorian style (Table 4; source 2), which points to extremely high late winter temperatures. An outstanding vegetation advance of three to four weeks was maintained until late summer, concluding from the beginning of grain
20
harvest, the maturity of [early burgundy?] grapes in early July (Table 4; source 8) and the general onset of vintage in early September. The year was extremely dry con-cluding from reports of water shortages and forest fires (Table 4; source 9). June and July 1616 were extremely hot and almost without rain, after a warm spring, throughout central Europe (Pfister, 1999; Glaser, 2008). Weather in 1540 was outstandingly hot
25
CPD
7, 2609–2654, 2011Spring-summer temperatures reconstructed
O. Wetter and C. Pfister
Title Page
Abstract Introduction
Conclusions References
Tables Figures
◭ ◮
◭ ◮
Back Close
Full Screen / Esc
Printer-friendly Version
Interactive Discussion
Discussion
P
a
per
|
Dis
cussion
P
a
per
|
Discussion
P
a
per
|
Discussio
n
P
a
per
harvest in Basel began four days later than in 1473. Ripe [early burgundy?] grapes were sold in Z ¨urich on 20th July (Table 4, source 11).
The spring-summer interval in 1603, according to the Luzern scientist Renward Cysat , was extremely warm and dry with frequent southerly winds leading to water shortages, even in the Alps (Table 4; source 12). Likewise, in 1631 and in 1718, the
5
entire interval from March to July was warm and dry, also, disregarding a cold phase in March, in 1645. The early harvests in 1611 and 1686 are primarily connected to a warm and dry spring (data in Pfister, 1999).
4.2 Cold extremes
The latest harvests in the instrumental period (from 1774) are documented in
descend-10
ing order for 1816: DOY 222; 1799: DOY 218; 1939: DOY 216; 1843, 1824: DOY 215; 1860, 1855: DOY 214; 1956: DOY 213.
The harvest in 1816, the famous year without a summer, was the latest in the past 657 yr. Temperatures in that year were substantially below the 20th century mean in every single month from March to July resulting in a cumulative negative anomaly of
15
7.1◦C for the entire interval. The very late harvests in 1799, 1824, 1843, 1855, 1860, 1939 and 1956 are connected to 3–5 cold months during the March to July interval without compensation of a warm month, disregarding the warm April in 1939. The resulting cumulative cold anomalies are, in descending order, 6.3◦C (1843), 5.8◦C (1860), 4.8◦C (1956), 4.1◦C (1855), 3.7◦C (1824), 3.6◦C (1799) and 3.0◦C (1939).
20
The latest harvests in the pre-instrumental period are documented in descending order as follows: 1555 DOY 220; 1542: DOY 219; 1614: DOY 218; 1621: DOY 216; 1716: DOY 215; 1511, 1608: DOY 214. The date for 1555 is drawn from the diary of the reformer Heinrich Bullinger (Table 5; source 3). April, June and particularly July were cold and very wet in that year. The spring of 1542, in particular April and May,
25
CPD
7, 2609–2654, 2011Spring-summer temperatures reconstructed
O. Wetter and C. Pfister
Title Page
Abstract Introduction
Conclusions References
Tables Figures
◭ ◮
◭ ◮
Back Close
Full Screen / Esc
Printer-friendly Version
Interactive Discussion
Discussion
P
a
per
|
Dis
cussion
P
a
per
|
Discussion
P
a
per
|
Discussio
n
P
a
per
|
also very cold in Germany (Dobrovolny et al., 2009). In 1614 snow cover in the Swiss Plateau, after an extremely long and cold winter, did not melt before early April (Table 4; source 14). This observation agrees with the report of another chronicler repeatedly mentioning drift ice in small rivers during March (Table 4; source 6), which points to extremely low temperatures, possibly as low as in March 1785 (Auer et al., 2007).
5
Unlike in 1785, May and June were cold in Switzerland (Dobrovolny et al. (2009), which accounts for the extreme delay of the rye harvest). After a cool and rainy period in May and June, 1621, July became a full winter month on the alpine meadows, concluding from two weeks of continuous snow cover (Table 4; source 15; Table 4; source 16). Conditions in spring, 1511, are not known, but June and July were cold and wet (Pfister,
10
1999). In 1608 snow-melt in the Alps at altitudes between 1000 and 2000 m was 3 to 4 weeks delayed according to the Luzern scientist Renward Cysat, which points to very low spring-summer temperatures (Table 4; source 12). In 1716, all months from March to July were very cold (Pfister, 1999). In conclusion, cross-checking the extremes with reports from narrative sources, disregarding the case of 1842, yielded conclusive
15
results.
5 Discussion
11-year moving average curves of Basel WGHD and Burgundy GHD (Chuine et al., 2004) show quite similar courses (Fig. 9a). Discrepancies emerge in the second half of the nineteenth century.
20
These discrepancies in the “modern period” disappear if moving 11-year averages of Basel WGHD- and Swiss Plateau GHD series (Meier et al., 2007) are being com-pared (Fig. 9b). On the other hand, this GHD series remains on a “warm” level during the well known period of long term cooling after 1550 involving far reaching glacier advances (Fig. 9b). This inconsistency sheds strong doubt on the reliability of the
25
CPD
7, 2609–2654, 2011Spring-summer temperatures reconstructed
O. Wetter and C. Pfister
Title Page
Abstract Introduction
Conclusions References
Tables Figures
◭ ◮
◭ ◮
Back Close
Full Screen / Esc
Printer-friendly Version
Interactive Discussion
Discussion
P
a
per
|
Dis
cussion
P
a
per
|
Discussion
P
a
per
|
Discussio
n
P
a
per
tough discrepancies in the “modern period” reappear (Fig. 9c). Weakest congruities of 11-year moving averages exist between Basel and Czech Republic WGHD based tem-perature series (Mozny et al., 2010) (Fig. 9d). This may be explained by distance and more continental influenced climate in Czech Republic. The discrepancies in 17th cen-tury are caused by the Thirty Years War and its aftermath (Mozny et al., 2010).
5
As all four comparisons more or less obviously show a cooler 19th century we have to assume the Basel WGHD reconstruction to be weak in the concerning period, which clearly correlates to the weak data availability during that period. 31-year moving corre-lations between Basel WGHD temperature anomalies and temperature reconstructions from Czech Republic (Mozny et al., 2010), Hungary (Kiss et al., 2010), Germany
(Do-10
brovolny et al., 2009), Austria (Maurer et al., 2009), France (Chuine et al., 2004) and Switzerland (Meier et al., 2007) show quite good results as well (Fig. 10).
Nevertheless the 31-year moving correlations also reveal some weaknesses of the Basel WGHD series. There is a clear drop in moving correlations for the period be-tween 1479 and 1522. As three series overlapping with the Basel WGHD series (GHD
15
Basel hospital; GHD Burgundy and WGHD Czech Republic) do show this drop in the corresponding period we have to assume the problem being caused by our series, even tough moving correlations to the temperature index of Germany is quite well in that time. The drop of moving correlations of the Austrian temperature reconstruction between 1541 and 1580 seems to be caused by the Austrian series as all other
temper-20
ature reconstructions show good correlations during this period and the authors of the Austrian temperature reconstruction also stated that there were significant changes of practices in viniculture which influenced their data during that time (Maurer et al., 2009). The drastic drop of correlations between the Czech- and our temperature reconstruc-tion in the 17th century is associated to the effect of the Thirty Years War (1618–1648)
25
CPD
7, 2609–2654, 2011Spring-summer temperatures reconstructed
O. Wetter and C. Pfister
Title Page
Abstract Introduction
Conclusions References
Tables Figures
◭ ◮
◭ ◮
Back Close
Full Screen / Esc
Printer-friendly Version
Interactive Discussion
Discussion
P
a
per
|
Dis
cussion
P
a
per
|
Discussion
P
a
per
|
Discussio
n
P
a
per
|
temperature reconstructions and the steady improvements between 1761 and 1809 has to be let unanswered as Swiss Plateau Region and Burgundy, on the other hand, correlate best during this same period (1740–1809). The slow drop of correlations be-tween 1870 and 1910 of all temperature reconstructions (except the French Burgundy temperature series) is clearly caused by our temperature reconstruction due to the
5
weak data availability for the period after 1869 in Switzerland. The improvements of moving correlations of all temperature reconstructions in the 1880s on the other hand clearly correlates with the better quality of phenological data in south western Ger-many. Best overall correlations are achieved with geographically neighbouring temper-ature reconstructions and correlations furthermore clearly decrease corresponding to
10
increasing distances (Table 3) (except of the german series).
To further illuminate the characteristics of the new Basel WGHD reconstruction, the series is compared with fluctuations of Alpine glaciers. Glaciers in mountain areas are highly sensitive to climate changes and thus provide one of nature’s clearest signals of warming or cooling and/or dry and wet climate periods including both conditions in
15
the summer and winter half-year. Their fluctuations are primarily influenced by air tem-perature, while precipitation is the second most important climatic factor (Oerlemans, 2001). A comparison with glacier fluctuations may thus be well suited to further inves-tigate the characteristics and validity of the WGHD series. At the same time, it may shed light on seasonal temperature trends being connected with glacier fluctuations.
20
The Lower Grindelwald glacier in the Bernese Alps, which has a length of>9 km and a surface area of<18 km2(Paul, 2003) is appropriate for such a comparison, because it is close to the area of investigation, and, considering the second half of the last mil-lennium, is at the same time the most in detail researched “historic” glacier worldwide. The positions of its tongue up to the late nineteenth century were assessed from more
25
CPD
7, 2609–2654, 2011Spring-summer temperatures reconstructed
O. Wetter and C. Pfister
Title Page
Abstract Introduction
Conclusions References
Tables Figures
◭ ◮
◭ ◮
Back Close
Full Screen / Esc
Printer-friendly Version
Interactive Discussion
Discussion
P
a
per
|
Dis
cussion
P
a
per
|
Discussion
P
a
per
|
Discussio
n
P
a
per
melting back. A long-term growth phase from about 1575 to 1602 resulted in an ad-vance of about 1000 m (Pfister et al., 1994; Holzhauser and Zumb ¨uhl, 1999). From the mid seventeenth to the mid nineteenth century the glacier snout did not melt back be-hind a local typical rock terrace situated about 1250 m below its present position. Over this period the ice advanced at seven times over distances of 400 to 600 m down into
5
the valley floor peaking around 1640, 1669, 1720, 1740, 1779, 1822 and 1856 (see illustrations in Holzhauser and Zumb ¨uhl, 2003). Since the end of the LIA the tongue of the Lower Grindelwald glacier melted back by about 2 km to its present position up in the gorge with smaller intermediate advances in the 1920s and 1970s (see graph in Holzhauser et al., 2005). The variations of the glacier snout are summarized according
10
to five year-periods distinguishing between advance, stationary state and melting back to allow visual comparison with the WGHD-based March to July temperature recon-struction (Fig. 11).
The long Burgundy GHD curve (Chuine et al., 2004) is included for comparison. In interpreting Fig. 11, one has to take into account the lag in the reaction of the glacier
15
to climatic stimuli. There is disagreement between the GHD Burgundy and the WGHD Basel curve in the 1450s and again between 1518 and 1526 that would need to be disentangled with reference to narrative documentary sources. The long term decline of WGHD from 1540 to the lowest trough between 1570 and 1600 suggest a pro-nounced cooling of the March to July interval, which, between 1575 and 1602, was
20
followed by a long term advance of the glacier to its foremost Little Ice Age position. This result agrees better with the model by Steiner et al. (2008) than the GHD series by Chuine et al. (2004) and Meier et al. (2007), perhaps, because the decline of spring temperatures played a significant role in this advance. Likewise, the advance from 1690 to 1720 was primarily triggered by low spring temperature and high spring
pre-25
CPD
7, 2609–2654, 2011Spring-summer temperatures reconstructed
O. Wetter and C. Pfister
Title Page
Abstract Introduction
Conclusions References
Tables Figures
◭ ◮
◭ ◮
Back Close
Full Screen / Esc
Printer-friendly Version
Interactive Discussion
Discussion
P
a
per
|
Dis
cussion
P
a
per
|
Discussion
P
a
per
|
Discussio
n
P
a
per
|
Age around 1860 stands out by a long term shift towards earlier WGHD that has no equivalence in the GHD series. Despite differences in size and location the variations of the Great Aletsch and the Lower Grindelwald glaciers show strong similarities over the last 3500 yr (Holzhauser et al., 2005). From the relocation of water conduits in the glacier forefield, Holzhauser (2009) concluded to a minor advance of the Aletsch
5
glacier culminating around 1505. It seems to be connected to the cold dips of March to July temperatures in the 1460s and again between 1480 and 1491 (see Fig. 11). In general, the Basel WGHD series show better skills in representing variations of Alpine glaciers than both the Burgundy (Chuine et al., 2004) and the Swiss GHD series (Meier et al., 2007).
10
6 Conclusion
This paper presents a unique 517 yr long documentary data - based reconstruction of spring-summer (MAMJJ) temperatures for northern Switzerland and south western Germany from 1454 to 1970 derived from winter grain (mostly rye) harvest starting dates. The first part of the series (up to 1705) is mainly drawn from the books of daily
15
expenditures kept by the Basel hospital in which wages paid to harvest workers are regularly laid down day by day. The second part of the series from 1706 to 1970 is composed of three different kinds of evidence, namely (I) dates on which tithes (taxes) paid in grain was sold by auction (1706 to 1825), (II) information of harvest work drawn from farmer’s diaries (1824 to 1950) and (III) phenological network observations (1950
20
to 1970).
The evidence for the period 1870 to 1949, somewhat meagre and fragmentary, is only available in the form of published data without any reference to metadata, so that its quality can hardly be assessed. This shortcoming, related to the abandon-ment of keeping phenological, ice and snow observations alongside with instruabandon-mental
25
CPD
7, 2609–2654, 2011Spring-summer temperatures reconstructed
O. Wetter and C. Pfister
Title Page
Abstract Introduction
Conclusions References
Tables Figures
◭ ◮
◭ ◮
Back Close
Full Screen / Esc
Printer-friendly Version
Interactive Discussion
Discussion
P
a
per
|
Dis
cussion
P
a
per
|
Discussion
P
a
per
|
Discussio
n
P
a
per
twentieth century proxy evidence needed for the calibration/verification procedure, if it is altogether available, often suffers from qualitative shortcomings. These shortcom-ings of recent evidence are reflected in the different level of correlations between the period 1774–1869 (r 0.69) and 1870–1949 (r 0.54). In comparison with grape harvest dates, WGHD data have 3 advantages: (I). They also include information on March
5
temperatures. (II) They are also available for regions where grapes are not grown. (III) They have a higher skill in the temperature reconstruction of the pre-instrumental period concluding from the comparison of both WGHD and GHD series with known Alpine glacier fluctuations since the late fifteenth century. Probably, accounts on wages paid to agricultural workers by local authorities (municipalities , hospitals etc.) may be
10
readily available in other archives in Europe and elsewhere. Accordingly, more temper-ature reconstructions based on WGHD might become available in the future, to improve and complete our picture of spring-summer temperatures in other regions of Europe.
Supplementary material related to this article is available online at:
http://www.clim-past-discuss.net/7/2609/2011/cpd-7-2609-2011-supplement.
15
pdf.
Acknowledgements. Acknowledgements are due to Alexandra Vlachos for style corrections
and to the Swiss National Science Foundation (Grant 100011-120157) and the Oeschger Cen-tre for Climatic Change Research (OCCR) at the University of Bern for funding support.
References
20
Allen, D. W. and Lueck, D.: The nature of the farm: contracts, risk, and organization in agricul-ture, VIII, MIT Press, Cambridge, Mass., 258 pp., 2002.
Auer, I.; B ¨ohm, R., Jurkovic, A., Lipa, W., Orlik, A., Potzmann, R., Sch ¨oner, W., Ungersb ¨ock, M., Matulla, C., Briffa, K., Jones, P. D., Efthymiadis, D., Brunetti, M., Nanni, T., Maugeri, M., Mercalli, L., Mestre, O., Moisselin, J.-M., Begert, M., M ¨uller-Westermeier, G., Kveton,
25
CPD
7, 2609–2654, 2011Spring-summer temperatures reconstructed
O. Wetter and C. Pfister
Title Page
Abstract Introduction
Conclusions References
Tables Figures
◭ ◮
◭ ◮
Back Close
Full Screen / Esc
Printer-friendly Version
Interactive Discussion
Discussion
P
a
per
|
Dis
cussion
P
a
per
|
Discussion
P
a
per
|
Discussio
n
P
a
per
|
Gajic-Capka, M., Zaninonvic K., Majstorovic, Z., and Nieplova, E.: HISTALP – historical instrumental climatological surface time series of the Greater Alpine Region 1760–2003, Int. J. Climatol., 27, 17–46, 2007.
BFS (Bundesamt f ¨ur Statistik): Die Bev ¨olkerung der Schweiz 2009, Neuch ˆatel, 16 pp., 2010. Blum, J.: The End of the Old Order in Rural Europe, Princeton, New Jersey, Priceton, University
5
Press, 1978.
B ¨ohm, R., Jones, P. D., Hiebl, J., Brunetti, M., Frank, D., and Maugeri, M.: The early instrumen-tal warm-bias: A solution for long central European temperatures series 1760–2007, Clim. Change, Climatic Change, (2010) 101, 41–67, 2009.
Br ´azdil, R., Zahradn´ı`eek, P., Dobrovoln´y, P., Kotyza, O., and Val ´aˇsek, H.: Historical and
re-10
cent viticulture as a source of climatological knowledge in the Czech Republic, Geografie – Sborn´ık `Eesk ´e geografick ´e spole `enosti, 113, 351–371, 2008.
Br ´azdil, R., Pfister, C., Wanner, H., von Storch, H., and Luterbacher, J.: Historical Climatology in Europe – The State of the Art, Climatic Change, 70, 363–430, 2005.
Br ´azdil, R. and Kotyza, O.: History of Weather and Climate in the Czech Lands IV. Utilisation of
15
Economic Sources for the Study of Climate Fluctuation in the Louny Region in the Fifteenth-Seventeenth Centuries, Masaryk University, Brno, 350 pp., 2000.
Burkhardt, T. and Hense, A.: On the reconstruction of temperature records from proxy data in Mid Europe, Archives for Meteorology, Geophysics and Bioclimatology, B 35, 341–359, 1985.
20
Burri, M. and Zenh ¨ausern, G.: “Spr ¨ungli und Inderschmitten.”, Bl ¨atter aus der Walliser Geschichte, 23(1), 34–46, 2009.
Encyclopædia Britannica: Retrieved from http://www.britannica.com/EBchecked/topic/ 1514616/Central-European-climate, 2011.
Chuine, I., Yiou, P., Viovy, N., Seguin, B., Daux, V., and Le Roy Ladurie, E.: Grape ripening as
25
a past climate indicator, Nature, 432(2), 89–290, 2004.
Cook, E. R., Briffa, K. R., and Jones, P. D.: Spatial regression methods in dendroclimatology: A review and comparison of two techniques, Int. J. Climatol., 14, 379–402, 1994.
Dickel, H.: Der Beginn der M ¨ahdruschernte des Roggens als ph ¨anologische Phase, Wetter und Leben, 24, 74–78, 1972.
30
CPD
7, 2609–2654, 2011Spring-summer temperatures reconstructed
O. Wetter and C. Pfister
Title Page
Abstract Introduction
Conclusions References
Tables Figures
◭ ◮
◭ ◮
Back Close
Full Screen / Esc
Printer-friendly Version
Interactive Discussion
Discussion
P
a
per
|
Dis
cussion
P
a
per
|
Discussion
P
a
per
|
Discussio
n
P
a
per
Dobrovoln´y, P., Br ´azdil, R., Val ´aˇsek, H., Kotyza, O., Mackov ´a, J., and Hal´ı`ekov ´a, M.: A stan-dard paleoclimatological approach to temperature reconstruction in historical climatology: an example from the Czech Republic, A.D. 1718–2007, Int. J. Climatol., 29, 1478–1492, 2009. DWD: Anleitung f ¨ur die Beobachter des Deutschen Wetterdienstes (BAPH). Vorschriften und
Betriebsunterlagen Nr. 17 (VuB 17). Dritte Auflage, Offenbach am Main, 189 pp., 1991.
5
Glaser, R.: 1200 Jahre Wetter, Klima, Katastrophen, WBG, Darmstadt, 264 pp., 2008.
Glaser, R., Br ´azdil, R., Pfister, C., Dobrovoln´y, P, Barriendos, M., Bokwa, A., Camuffo, D., Kotyza, O., Liman ´owka, D., R ´acz, L., and Rodrigo, F. S.: Seasonal Temperature and Pre-cipitation Fluctuations in Selected Parts of Europe During the Sixteenth Century, edited by: Pfister, C., Br ´azdil, R. and Glaser, R., Climatic Variability in Sixteenth Century Europe and
10
Its Social Dimension, Climatic Change, Special Volume 43(1), 169–200, 1999.
Gauss, C. F.: Berechnung des Osterfestes, in: Monatliche Correspondenz zur Bef ¨orderung der Erd- und Himmelskunde, 2, edited by: von Zach, F. X., Gotha, 1800.
Grotefend, H.: Taschenbuch der Zeitrechnung des deutschen Mittelalters und der Neuzeit, Dreizehnte Auflage, Hahnsche, Hannover, 224 pp., http://www.manuscriptamediaevalia.de/
15
gaeste/grotefend/grotefend.htm, 2007.
Holzhauser, H.: Die bewegte Vergangenheit des Grossen Aletschgetschers, in: Klim-ageschichte in den Alpen. Methoden – Probleme – Ergebnisse, edited by: Imboden, G. and Pfister, C., 41, Visp, 47–102, 2009.
Holzhauser, H., Magny, M., and Zumb ¨uhl, J.: Glacier and lake-level variations in west-central
20
Europe over the last 3500 years, The Holocene, 15(6), 789–801, 2005.
Holzhauser, H. and Zumb ¨uhl, H. J.: (http://aleph.unibas.ch/exlibris/aleph/u20 1/dsv01/www f ger/icon/f-separator.gif) Jungholoz ¨ane Schwankungen des Unteren Grindelwaldgletschers: fossile B ¨oden und B ¨aume, historische Dokumente in: Geographica Bernensia, III, Bern, 23 pp., 2003.
25
Holzhauser, H. P. and Zumb ¨uhl, H. J.: Glacier Fluctuations in the Western Swiss and French Alps in the 16 Century, in: Climatic Variability in Sixteenth-Century Europe and Its Social Dimension, edited by: Pfister, C., Br `azdil, R., Glaser, R., Kluwer, Dordrecht, 223–235, 1999. Hughes, C.: Switzerland, in: Nations of modern world, III, London,303 pp., 1975.
Jankovic, V.: Reading the skies. A cultural history of English Weather, 1650–1820, Manchester
30
University Press, Manchester, 272 pp., 2000.