hypertrophic cardiomyopathy:
Evaluation by vector velocity imaging
Hala Mahfouz Badran1,2*, Ghada Soltan1, Hesham Hassan1, Ahmed Nazmy1,
Naglaa Faheem1,2, Haythem Saadan1, Magdi H. Yacoub2,3
ABSTRACT
Objectives:Hypertrophic cardiomyopathy (HCM) represents a generalized myopathic process affecting both ventricular and atrial myocardium. We assessed the global and regional left atrial (LA) function and its relation to left ventricular (LV) mechanics and clinical status in patients with HCM using Vector Velocity Imaging (VVI).
Methods:VVI of the LA and LV was acquired from apical four- and two-chamber views of 108 HCM patients (age 40^19years, 56.5% men) and 33 healthy subjects, all had normal LV systolic function. The LA subendocardium was traced to obtain atrial volumes, ejection fraction, velocities, and strain (e)/strain rate (SR) measurements.
Results:Left atrial reservoir (esys,SRsys) and conduit (early diastolic SRe) function were significantly
reduced in HCM compared to controls (P,.0001). Left atrial deformation directly correlated to LVesys,
SRsysand negatively correlated to age, NYHA class, left ventricular outflow tract (LVOT) gradient, left
ventricular mass index (LVMI), LA volume index and severity of mitral regurge (P,0.001). Receiver operating characterist was constructed to explore the cutoff value of LA deformation in differentiation of LA dysfunction;esys,40% was 75% sensitive, 50% specific, SRsys,1.7s21was 70% sensitive, 61%
specific, SRe. 21.8s21was 81% sensitive and 30% specific, SRa. 21.5s21was 73% sensitive and
40% specific. By multivariate analysis global LVesysand LV septal thickness are independent predictors for LAesys, while end systolic diameter is the only independent predictor for SRsys, P,.001.
Conclusion:Left atrial reservoir and conduit function as measured by VVI were significantly impaired while contractile function was preserved among HCM patients. Left atrial deformation was greatly influenced by LV mechanics and correlated to severity of phenotype.
Keywords:left atrial deformation; hypertrophic cardiomyopathy; vector velocity imaging
Cite this article as: Badran HM, Soltan G, Hassan H, Nazmy A, Faheem N, Saadan H, Yacoub MH. Changes in left atrial deformation in hypertrophic cardiomyopathy: Evaluation by vector velocity imaging,Global Cardiology Science & Practice2012:25http://dx.doi.org/10.5339/gcsp.2012.25 http://dx.doi.org/
10.5339/gcsp.2012.25
Submitted: 23 October 2012 Accepted: 11 December 2012 q2012 Badran, Soltan, Hassan, Nazmy, Faheem, Saadan, Yacoub, licensee Bloomsbury Qatar Foundation Journals. This is an open access article distributed under the terms of the Creative Commons Attribution license CC BY 3.0, which permits unrestricted use, distribution and reproduction in any medium, provided the original work is properly cited.
1Cardiology Department, Menoufiya University, Egypt
INTRODUCTION
Hypertrophic cardiomyopathy (HCM) is a familial disease with an autosomal dominant pattern of inheritance caused by mutations in genes encoding for sarcomeric proteins. The condition usually results in a hetrogenous myopathic disease affecting both the ventricular and atrial myocardium[1,2]. It is thought to be a progressive disease that most often begins with left ventricular (LV) diastolic dysfunction and/or structural remodeling of the atria, including chamber enlargement and interstitial fibrosis[3]. Better understanding of atrial structure and function could lead to improvements in identifying early signs of diastolic impairment, heart failure and to enhanced prediction of risk related to the development of atrial fibrillation (AF). Such enhanced knowledge would also allow practitioners to better estimate the response to treatments in patients with this arrhythmia.
Noninvasive assessment of structure and function of the atria has been limited by a lack of suitable methods for making these measurements. Left atrial (LA) dysfunction is mostly diagnosed by mitral and pulmonary vein Doppler echocardiography. A complementary method is tissue Doppler imaging (TDI), which more directly estimates myocardial tissue velocities and thus provides a relatively load-independent measure of function[4]. The addition of maximal LA volume may improve diagnostic accuracy[5].
The atrium has multiple functions, acting as a reservoir and a conduit in addition to its contractile function. Thus, there is a need for a more detailed analysis of its pathophysiological importance, and accordingly, for techniques that may supplement available technology in identifying early signs of mechanical impairment.
Recently, 2-dimensional (2D) strain and strain rate (SR) measurements from grayscale images have been introduced based on speckle tracking (SPT), a method in which ultrasound speckles within the image are tracked and strain is determined from the displacement of speckles in relation to each other. The method provides an angle-independent parameter of myocardial function[6,7]. A new feature-tracking echocardiographic method using vector velocity imaging (VVI) is achieved through the combination of SPT, mitral annulus motion, tissue-blood border detection, and the periodicity of the cardiac cycle using R-R intervals. It can measure myocardial strain, SR, and velocity of the regional endocardium[8]. Because VVI tracks moving tissue the area or volume changes in the investigated heart chamber can be calculated automatically frame by frame. 2D-derived LA strain rate facilitates comprehensive evaluation of LA contractile, reservoir, and conduit function.
The aim of the present study was to explore left atrial myocardial properties using VVI as a method to quantify and detect global and regional LA dysfunction and its relation to LV mechanics and clinical status in patients with HCM.
PATIENTS AND METHODS Study population
HCM group
Between January 2011 and March 2012, we prospectively included 108 HCM patients between the ages of 8 and 70 years, who were referred to our echocardiographic laboratories for risk stratification. They were examined in a single center (Yacoub Research Unite, Menoufiya University, Egypt and as a part of the BA-HCM National Program). Patients were enrolled in the study after their informed consent, and approval of Ethics Committee of Menoufiya University Hospitals was obtained.
The diagnosis of HCM was based on conventional echocardiographic demonstration of a non-dilated, hypertrophic LV ($15 mm) in the absence of other cardiac or systemic diseases capable of producing the magnitude of hypertrophy evident,[2]all patients have sinus rhythm and normal ejection fraction (EF%.55%). Exclusion criteria were diabetes mellitus, arterial hypertension, and evidence of coronary artery disease, atrial fibrillation, lung disease, and inadequate echocardiograms.
Control group
We studied 33 age- and sex-matched healthy subjects without detectable cardiovascular risk factor or receiving any medication. Volunteer controls were all selected from departments of pediatric and adult cardiology among subjects investigated for work eligibility.
Conventional echocardiography
phased-array transducer was utilized[8,9]. Left ventricular end diastolic (EDD), end systolic diameter (ESD), septum(ST), posterior wall thickness (PWT), ejection fraction (EF%) and LA diameter and volume were measured in accordance with the recommendations of the American Society of Echocardiography [2]. Color flow mapping and continuous-wave Doppler were used to define resting left ventricular outflow tract obstruction (LVOTO) and to estimate pulmonary artery pressure (PAP) from tricuspid regurgitation velocity (Bernolli equation). Peak early (E) and late (A) transmitral (E and A) filling velocities were measured from mitral inflow velocities. Peak systolic (Sm), early diastolic (Em) and atrial
diastolic (Am) velocity as well as isovolumetric relaxation time (IRT) were obtained by placing a pulsed
tissue Doppler (TDI) sample volume at the lateral mitral annulus in the apical four-chamber view. From this, the E/Emratio was calculated.
Analysis of LA and LV deformation
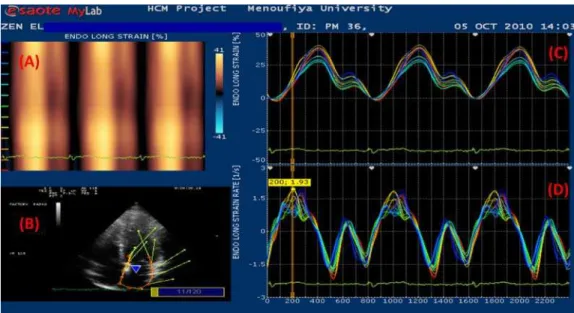
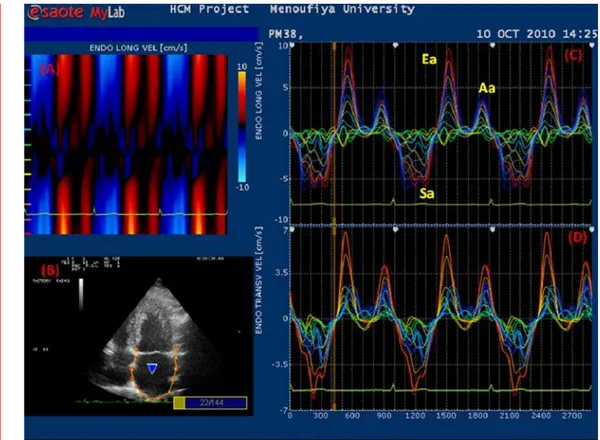
Border tracking of the LA and LV was manually traced from the digitized 2D video clips recorded during breath holding and with good quality ECG signals, which were acquired and stored for off-line analysis using XStrainesoftware with a frame rate between 40– 80 fps. The ‘‘Zoom/RES’’ feature on the
echocardiographic machine was used to improve the accuracy of atrial measurements. A circular region of interest was traced on the endocardial cavity interface of the apical four-chamber view at end diastole (LA minimum cavity area) using a point-and-click approach. Time-volume curves were extracted from LA wall tracking that provided automatically indexed maximum and minimum LA volume and left atrium ejection force (LAEF)[5,6]. We measured longitudinal (LNG) peak velocities achieved by LA walls 1 cm above the mitral annulus in systole (Sam), early (Eam) and late diastole (Aam).
Definition of the LA endocardial border enabled the system to calculate regional longitudinal deformation of the LA walls. Peak systolic strain (esys) and LA systolic SR (SRsys) were measured as a
positive curve at LV systole (representing reservoir function), early diastole (SRe) (representing conduit
function), and atrial diastole (SRa) (representing contractile function). Image processing algorithm
automatically subdivides the atrial wall into 12 segments distributed in septum and lateral and posterior LA wall – “roof”. The graphs for each segment were displayed and averaged to calculate global LA function[10](Figure 1, 2).
For LV deformation, the same parameters were measured for the basal, mid and apical segments of the septal, lateral, anterior and inferior wall, from apical four and two-chamber views. To reduce random noise, each sample was obtained by averaging three consecutive heart cycles.
To estimate mechanical dyssynchrony, the index of myocardial systolic activation was calculated from regional strain curves for each segment, as time from the beginning of a Q wave of ECG to the peak LNGesys (TTP). Left atrial and LV electromechanical delay were measured as the difference between TTP (d-TTP) in 12 LA and 12 LV segments, respectively (difference between the longest and shortest cycle)[10,11]. Intra-atrial and intra-ventricular dyssynchrony were defined as the standard deviation of the averaged time-to-peak strain (TTP-SD)[12,13].
Inter and Intra-observer variability
Two independent observers performed two separate quantitativeesys and SR analyses of LA and LV images blindly in 35 participants. Inter-observer and intra-observer agreement foresys data was: for LVesys, R¼0.87 and 0.92, LAesys, R¼0.89 and 95, TTP, R¼0.89 and 0.95, respectively; and SRsys,inter-observer R¼0.88, intra-observer R¼92. Both inter and intra-observer agreements were
lower for diastolic SR. For SRe: R¼0.84 and 0.87, respectively and for SRa: R¼0.82 and 0.85,
respectively.
Statistical analyses
Data were presented as numbers (%) or as mean and standard deviation values. The distribution of qualitative variables was analyzed by Chi-Square test or Fisher’s exact test. Quantitative variables were correlated by the use of Pearson’s correlation coefficient “r.” All tests were two-tailed, and a P value , 0.05 was considered statistically significant. To identify significant independent predictors of global LA strain and SR, variables that were statistically significant in univariate analysis were introduced in a multivariate regression model; the overall fitness of the model was evaluated with the calculation of the coefficient Rþ SE. Receiver operating characteristic (ROC) curve analysis was performed to select optimal cut-off values of LA deformation measurements. The analysis was performed by the IBM SPSS statistics software package[19].
RESULTS
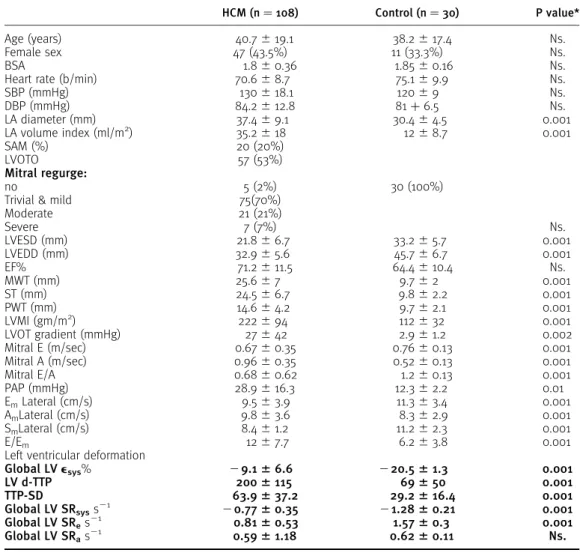
Clinical characteristics of the study population (Table 1)
There were no significant differences between the HCM and control group in terms of average age, gender, BSA, heart rate or blood pressure. (Q1)Of 108 HCM patients, 47 (43.5% females) and 72 (66.7%) were symptomatic;,63% are NYHA class II, 33% class III, 4% class IV, and 8 (7%) had a history of syncope. Forty (37%) were familial type (based on prospective evaluation of relatives), 16 (15%) had a positive family history of premature sudden death. Eighty-four (,78%) had asymmetric septal
hypertrophy, 20 (19%) had concentric LVH, and 3(,3%) had apical HCM. Twenty-three (21%) patients
had extreme LVH (MWT$30 mm), 26 (24%) had LVOTO$ 30 mmHg, 57 (53%) had LA volume index.30 m/m2, 3% had severe tricuspid regurgitation, and 22 (20%) had PAP.30 mmHg (range: 30 – 82 mmHg).
Conventional echocardiographic analysis
There was no significant difference between the two groups in LV EF%, Eminflow velocity. Left atrial
dimension, volume index, ST and PWT, LVMI and LVOT gradiant, Aminflow velocity, were significantly
greater, whereas left ventricular end-systolic diameters (LVESD), left ventricular end diastolic diameter (LVEDD), Em/Amwere significantly reduced in HCM group (P,.001). E/Emwas significantly elevated
when compared to control (P,.001) (Table 1).
LV deformation analysis (Table 1)
In HCM, 2D strain analysis detected lower global and regional peak LAesys, SRsysand SRe(P,.001)
at the level of all analyzed segments in comparison to control. Despite the significant difference of SRaat some segmental levels, LV global atrial diastolic SR did not differ from control. Similarly,
electromechanical delay (d-TTP) and intra-V dyssynchrony was considerably prolonged between LV segments compared with its corresponding segments in healthy individuals (P,.001).
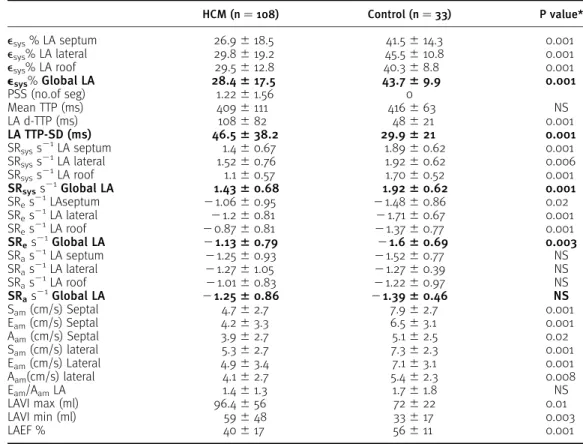
Regional and Global LA function (Table 2)
As compared to healthy subjects, HCM patients had lower LNG peak LA wall velocities Sam, Eamand Aam
P,.001. Similar findings were observed for regional and averaged LA wallesys (P,0.001) and for reservoir and conduit function derived by SR measured during the systolic and early diastolic period (P,.001). Contrarily, LA contractile function, as expressed by SR measured during late diastole, remains conserved and did not differ between the studied groups (P,.0001) (Table 4). Left atrial volumes were significantly increased (P,.01, .003) and left atrial ejection force (LAEF) estimated by time volume curve was significantly reduced in HCM compared with control (P,.001).
For electromechanical delay between LA segments, controls showed homogeneous systolic activation of the atrial walls. Conversely, the HCM group showed significant delay between segments (d-TTP; P,.001) and dispersion of electromachanical activation between LA segments (TTP-SD: 46.5^38.2 vs. 29.9^21, P,.001).
Univariate relations of LA 2Dstrain indexes: (Table 3andFigures 3,4,5,6)
In HCM, the deformation variables estimated by LAesys and SR were concordant with those derived by LNG LA velocities measured by tissue Doppler (P,.0001). LA global strain was directly correlated to LA SRsys(r¼.86, P,.0001), both were directly related to LVesys, SRsysand SRe,EF%, LAEF% (P,.0001),
and inversely related to age, positive family history, LA volume index, MWT, LVMI, MR severity (P,.0001), LVOT gradient (P,.006), LVESD (P,.008), and intra-A dyssynchrony (TTP-SD, P,.001), respectively. We also observed correlations between LA wall deformation parameters and peak mitral annulus velocities measured by pulsed TDI (P,.0001).
To explore the cutoff points that discriminate LA dysfunction, we constructed ROC curves for LAesys, SRsys,SReand SRain HCM (Figure 7). For atrial reservoir function; LAesys, 40% shows 75% sensitivity
and 50% specificity respectively. AUC: 0.733 [CI: 0.649 – .819, P,.0001], SRsys, 1.7 s21shows 70%
sensitivity and 61% specificity with AUC 0.727[CI: 0.643– 0.811, P,.0001]. For conduit function; (SRe),
cutoff value. 21.8 s21shows 81% sensitivity and only 31% specificity (good screening test).
In addition, the atrial contractile function as estimated by LA SRa. 21.5 s21shows 73% sensitivity
Table 1. Clinical and echocardiographic characteristics of study population.
HCM (n¼108) Control (n¼30) P value*
Age (years) 40.7^19.1 38.2^17.4 Ns.
Female sex 47 (43.5%) 11 (33.3%) Ns.
BSA 1.8^0.36 1.85^0.16 Ns.
Heart rate (b/min) 70.6^8.7 75.1^9.9 Ns.
SBP (mmHg) 130^18.1 120^9 Ns.
DBP (mmHg) 84.2^12.8 81þ6.5 Ns.
LA diameter (mm) 37.4^9.1 30.4^4.5 0.001
LA volume index (ml/m2) 35.2^18 12^8.7 0.001
SAM (%) 20 (20%)
LVOTO 57 (53%)
Mitral regurge:
no 5 (2%) 30 (100%)
Trivial & mild 75(70%)
Moderate 21 (21%)
Severe 7 (7%) Ns.
LVESD (mm) 21.8^6.7 33.2^5.7 0.001
LVEDD (mm) 32.9^5.6 45.7^6.7 0.001
EF% 71.2^11.5 64.4^10.4 Ns.
MWT (mm) 25.6^7 9.7^2 0.001
ST (mm) 24.5^6.7 9.8^2.2 0.001
PWT (mm) 14.6^4.2 9.7^2.1 0.001
LVMI (gm/m2) 222
^94 112^32 0.001
LVOT gradient (mmHg) 27^42 2.9^1.2 0.002
Mitral E (m/sec) 0.67^0.35 0.76^0.13 0.001 Mitral A (m/sec) 0.96^0.35 0.52^0.13 0.001
Mitral E/A 0.68^0.62 1.2^0.13 0.001
PAP (mmHg) 28.9^16.3 12.3^2.2 0.01
EmLateral (cm/s) 9.5^3.9 11.3^3.4 0.001
AmLateral (cm/s) 9.8^3.6 8.3^2.9 0.001
SmLateral (cm/s) 8.4^1.2 11.2^2.3 0.001
E/Em 12^7.7 6.2^3.8 0.001
Left ventricular deformation
Global LVesys% 29.166.6 220.561.3 0.001
LV d-TTP 2006115 69650 0.001
TTP-SD 63.9637.2 29.2616.4 0.001
Global LV SRsyss21 20.7760.35 21.2860.21 0.001
Global LV SRes21 0.8160.53 1.5760.3 0.001
Global LV SRas21 0.5961.18 0.6260.11 Ns.
*Chi-Square test/student’s test Ns.¼non-significant BSA: body surface area SBP: systolic blood pressure DBP: diastolic blood pressure LVH: left ventricular hypertrophy SAM: systolic anterior motion
LVOTO left ventricular outflow tract obstruction LVESD: left ventricular end-systolic diameter LVEDD: left ventricular end-diastolic diameter EF: ejection fraction
MWT: maximal wall thickness PWT: posterior wall thickness ST: septal thickness
LVMI: left ventricular mass index E: early mitral inflow velocity A: atrial mitral inflow velocity DT: deceleration time PAP: pulmonary artery pressure; Em: mitral annulus early diastolic velocity Am: mitral annulus atrial diastolic velocity Sm: mitral annulus systolic velocity esys: peak systolic strain LV: left ventricle TTP: time to peak strain d-TTP: delay between TTP
TTP-SD: standard deviation of time to peak strain SRsys: peak systolic strain rate
Multivariate analysis
Stepwise forward, multiple linear regression analyses were performed in the overall population to weigh the independent associations between LAesys/SR and clinical status and LV phenotype. By this model, after adjusting for potential determinants, for reservoir function; global LV SRsys
(bcoefficient¼0.624; CI at 95%: 0.289 – 0.77) and LV septal thickness (bcoefficient 0.773; CI at 95%: 0.355 – 0.78), P,.0001 are independent predictors for global LA strain, and only LV end systolic diameter is an independent predictor for SRsys(bcoefficient 0.033; CI at 95%: 0.015 – 0.083),
P,.03. For atrial conduit function; LA EF (bcoefficient 5.27; CI at 95%: 3.24 – 7.45, P,.001 is independent predictor of SRe.
DISCUSSION
The central finding of our study is a quantitative assessment of LA function in patients with HCM. The LA reservoir and conduit function derived by VVI is significantly compromised while LA contractile function is preserved in HCM with normal ejection fraction. Global LA1sysand SR is strongly related to functional class and severity of phenotypic expression. Moreover, LV SRsysand septal thickness are independent
predictors to LA1sysin patients with HCM.
Atrial function is an integral part of cardiac function that is often neglected. The recognition of the upper limits of atrial size and function in HCM may be of clinical relevance by assisting in distinguishing cardiac remodeling and help with patients’ risk stratification[1,2].
Table 2. Left atrial deformation.
HCM (n¼108) Control (n¼33) P value*
esys% LA septum 26.9^18.5 41.5^14.3 0.001
esys% LA lateral 29.8^19.2 45.5^10.8 0.001
esys% LA roof 29.5^12.8 40.3^8.8 0.001
esys%Global LA 28.4617.5 43.769.9 0.001
PSS (no.of seg) 1.22^1.56 0
Mean TTP (ms) 409^111 416^63 NS
LA d-TTP (ms) 108^82 48^21 0.001
LA TTP-SD (ms) 46.5638.2 29.9621 0.001
SRsyss21LA septum 1.4
^0.67 1.89^0.62 0.001
SRsyss21
LA lateral 1.52^0.76 1.92^0.62 0.006
SRsyss21LA roof 1.1
^0.57 1.70^0.52 0.001
SRsyss21Global LA 1.4360.68 1.9260.62 0.001
SRes21
LAseptum 21.06^0.95 21.48^0.86 0.02
SRes21LA lateral 21.2^0.81 21.71^0.67 0.001 SRes21
LA roof 20.87^0.81 21.37^0.77 0.001
SRes21Global LA 21.1360.79 21.660.69 0.003
SRas21
LA septum 21.25^0.93 21.52^0.77 NS
SRas21LA lateral
21.27^1.05 21.27^0.39 NS SRas21
LA roof 21.01^0.83 21.22^0.97 NS
SRas21Global LA 21.2560.86 21.3960.46 NS
Sam(cm/s) Septal 4.7^2.7 7.9^2.7 0.001
Eam(cm/s) Septal 4.2^3.3 6.5^3.1 0.001
Aam(cm/s) Septal 3.9^2.7 5.1^2.5 0.02
Sam(cm/s) lateral 5.3^2.7 7.3^2.3 0.001
Eam(cm/s) Lateral 4.9^3.4 7.1^3.1 0.001
Aam(cm/s) lateral 4.1^2.7 5.4^2.3 0.008
Eam/AamLA 1.4^1.3 1.7^1.8 NS
LAVI max (ml) 96.4^56 72^22 0.01
LAVI min (ml) 59^48 33^17 0.003
LAEF % 40^17 56^11 0.001
LA: left atrium TTP: time to peak strain d-TTP: delay between TTP
TTP-SD: standard deviation of time to peak strain SRsys: peak systolic strain rate
In the present study we applied VVI,[13,14]that allows for a multidirectional analysis of myocardial motion in an angle-independent fashion, to explore the possibility of improving the diagnosis of early LA dysfunction beyond that accomplished by traditional Doppler echocardiography and TDI. The results of the present study demonstrate the usefulness of VVI in analyzing LA myocardial function in patients with HCM. In this study, besides LA volume measurements, which showed significant increase in HCM, and LA strain analysis, phasic LA SR was used to describe the three components of atrial function that provided incremental information pertaining to LA function[15].
LA function in HCM
The LA operates as a reservoir and conduit compartment for blood flow from the pulmonary veins to LV and as a contracting chamber enhancing LV filling[13]. Left atrial reservoir function is critical for LV
Table 3. Correlation between left atrial deformation, clinical and other echocardiographic parameters.
LAesys Global
LATTP-SD delay
LASRsys Global
LA diaSRe
Global
LA diaSRa
Global
Age r 2.215 .162 2.165 .293 2.021
P .011 .057 .057 .000 .803
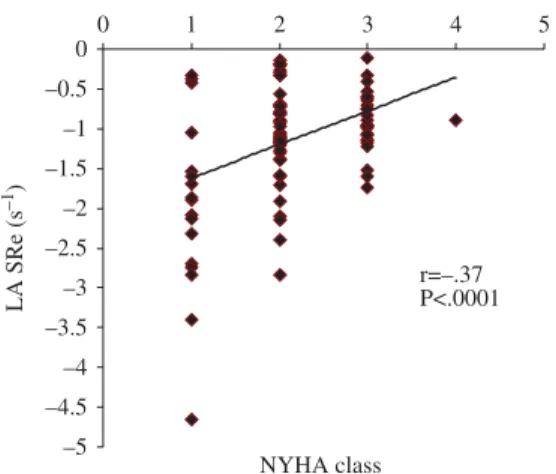
NYHA r .214 .104 2.104 .374 2.025
P .013 .178 .178 .000 .479
LA TPP-SD r .352 .262 .282 2.131 2.156
P .000 .002 .001 .122 .064
LA volume index (ml/m2) r 2.429 .299 2.419 .358 .207*
P .000 .000 .000 .000 .014
EF% r .187 .114 .204 .205 .008
P .026 .179 .016 .015 .928
MWT (mm) r 2.450 .371 2.45 .419 .210*
P .000 .000 .000 .000 .012
LVMI (g/m2) r 2.444 .331 2.438 .387 .284**
P .000 .000 .000 .000 .001
LVOT gradient (mmHg) r 2.233 .046 2.146 .244 .054
P .006 .592 .086 .004 .527
Positive FH r 2.314 .126 2.310 .201 .101
P .000 .141 .000 .017 .236
Global LVesys (%) r .589 .291 .538 .459 .232**
P .000 .000 .000 .000 .006
LV TPP -SD r 2.013 2.084 2.009 .020 .126
P .884 .325 .915 .811 .140
Global LV SRsys r .562 .222 .530 .459 .294**
P .000 .008 .000 .000 .000
Global LV SRe dia r .512 2.239** .442 .459 .185*
P .000 .005 .000 .000 .029
Global LV SRa dia r .080 .007 .115 .022 .240**
P .344 .935 .174 .796 .004
LAEF% r .701 2.142 .648 .510 .505**
P .000 .093 .000 .000 .000
E/Em r 2.278 2.076 2203 2.213 .135**
P .001 .233 .015 .008 .058
MR r 2.282 .087 2.279 .250* .245*
P .004 .382 .004 .011 .013
esys: peak systolic strain LA: left atrium
TTP-SD: standard deviation of time to peak strain LVESD: left ventricular end-systolic diameter LVEDD: left ventricular end-diastolic diameter EF%: ejection fraction
MWT: maximal wall thickness LVMI: left ventricular mass index LVOT: left ventricular outflow tract PAP: pulmonary artery pressure LV: left ventricle
TTP-SD: standard deviation of time to peak strain SRsys: peak systolic strain rate
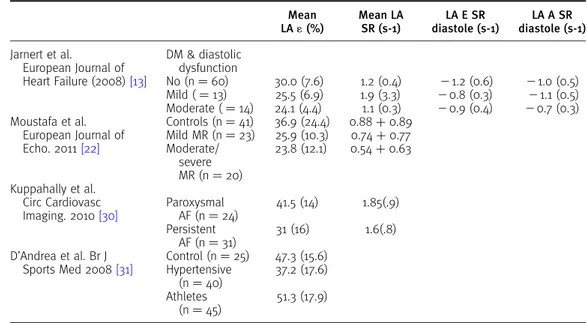
Table 4. Left atrial deformation using VVI in other pathological states.
Mean LA1(%)
Mean LA SR (s-1)
LA E SR diastole (s-1)
LA A SR diastole (s-1)
Jarnert et al.
European Journal of Heart Failure (2008)[13]
DM & diastolic dysfunction
No (n¼60) 30.0 (7.6) 1.2 (0.4) 21.2 (0.6) 21.0 (0.5) Mild (¼13) 25.5 (6.9) 1.9 (3.3) 20.8 (0.3) 21.1 (0.5) Moderate (¼14) 24.1 (4.4) 1.1 (0.3) 20.9 (0.4) 20.7 (0.3) Moustafa et al.
European Journal of Echo. 2011[22]
Controls (n¼41) 36.9 (24.4) 0.88þ0.89 Mild MR (n¼23) 25.9 (10.3) 0.74þ0.77 Moderate/
severe MR (n¼20)
23.8 (12.1) 0.54þ0.63
Kuppahally et al. Circ Cardiovasc Imaging. 2010[30]
Paroxysmal AF (n¼24)
41.5 (14) 1.85(.9)
Persistent AF (n¼31)
31 (16) 1.6(.8)
D’Andrea et al. Br J Sports Med 2008[31]
Control (n¼25) 47.3 (15.6) Hypertensive
(n¼40)
37.2 (17.6)
Athletes (n¼45)
51.3 (17.9)
Mean LA
e: left atrial strain
LA SR: left arterial systolic strain rate
LA E SR diastole: let atrial early diastolic strain rate LA A SR diastole: left atrial strial diastolic strain rate DM: diabetes mellitus
MR: mitral regurgitation AF: atrial fibrillation
0 20 40 60 80 –30 –25 –20 –15 –10 –5 0
LV εsys (%)
LA
ε
sys (%)
r=.59 P<.0001
Figure 3.Global LA systolic strain (esys) and LVesys in HCM group.
r=–.22 P<.008 0 10 20 30 40 50 60 70
10 20 30 40 50 LV end systolic diameter (mm)
LA
ε
sys (%)
filling by conserving energy during ventricular systole, emitted after MV opening[16,17]. This phase is influenced by atrial compliance, atrial contraction, and LV basal systolic descent[17,18].
Duringthe LA reservoir period, maximal positive LA strain occurs at the end of LV systole, representing a measure of the maximal stretching of LA. Left atrial peak lengthening during ventricular systole—represented by positive strain and SR—are important indicators of LA compliance[16 – 19]. Several authors have recently shown that LAesys, could be used as an index of LA reservoir function [20 – 22]. In view of that, our study verified that LAesys was significantly correlated to LA SRsysand gave
similar relationship to LV function and LV phenotype.
In our cohort, quantification of longitudinal myocardial LA deformation during this phase showed significant reduction in HCM, which was strongly related to LA volume index, LV mass index in addition to LV systolic deformation as measured by global LVesys and SR. Meanwhile, LA reservoir was inversely correlated to severity of mitral regurgitation. As previously documented, chronic MR provokes volume overload, LA remodeling and impairment of LA elastic properties and compliance with subsequent elevation of LA pressure and could intensify the deterioration of reservoir function in HCM patients,[22 – 25]as was the case in the current study in which 98% displayed mild to severe mitral regurgitation.
Left atrialesys decreased linearly with the increasing severity of LV diastolic dysfunction, as expressed by Em, Amusing TDI and LV filling pressure estimated by E/Em. Consequently, LAesys
emerged as a promising variable for the expression of the intrinsic LA function when investigating patients with different stages of diastolic dysfunction. In the case of HCM, myocardial hypertrophy, disarray and fibrosis are associated with increased stiffness or noncompliance of the LV, and LA pressure rises to maintain adequate LV filling. The resultant increased atrial wall tension leads to
r=–.42 P<.0001
0 0.5 1 1.5 2 2.5 3 3.5 4
0 20 40 60 80 100 120 140 LA volume (ml)
LA SRsys (s
–1)
Figure 5.LA systolic SR (SRsys) and LA volume in HCM.
r=–.37 P<.0001
–5 –4.5 –4 –3.5 –3 –2.5 –2 –1.5 –1 –0.5 0
0 1 2 3 4 5
NYHA class
LA SRe (s
–1)
chamber dilation and stretch of the atrial myocardium[26,27]. This explains why, early in the course of disease, LA stiffness increases whereas the LA booster pump is augmented causing work mismatch. This is could explain the preserved contractile function (SRa) in our studied HCM population and might
imply incipient LV dysfunction in patients with apparently normal LV ejection fraction.
Left atrial conduit function, which reflects passive LV filling in early diastole, is predominantly governed by the rate of LV relaxation[15,16]. In this study, evidence of impaired conduit function in our HCM patients was manifested by decreased transmitral E wave and mitral annular Emvelocity. Using
VVI indices, passive emptying LA velocity (Eam) and SR during early diastole (SRe) showed significant
reduction compared with the controls. This reduction in conduit function is worse with increased severity of hypertrophy and presence of LVOTO and is associated with pulmonary hypertension. It is firmly related to LV diastolic function as measured by deformation indexes.
Atrial booster pump function, which reflects atrial contraction at end-diastole, and is seen as negative SR, is controlled by preload, afterload, and contractility[28,29]. In our study of HCM patients, indexes of LA booster pump function were preserved and did not differ from control. In addition to LA SRa, LA systolic function has been evaluated utilizing a variety of indicators, such as transmitral
Doppler flow (A), and TDI of the mitral annulus during atrial systole (Am) which showed augmented
values in relation to control. Nonetheless, the main inconvenience in the later parameters was their high sensitivity to autonomic status, loading conditions, and LV systolic function[9,10].
The present study clarified that the deformation in the atria is reciprocally related to the deformation of the ventricles, both reflecting the motion of the atrio-ventricular plane. In systole, the ventricle shortens while the atria expand. This is a function of ventricular contraction. In early diastole, there is elongation of the ventricles and shortening of the atria; the active constituent of this is the ventricular relaxation. While in late diastole, the active component is the atrial contraction. In our HCM cohort, LA
1.0
0.8
0.6
0.4
0.2
0.0
0.0 0.2
Sensitivity
1.0
0.8
0.6
0.4
0.2
0.0
Sensitivity
1 - Specificity
0.4 0.6 0.8 1.0
1.0
0.8
0.6
0.4
0.2
0.0
0.0 0.2
Sensitivity
1.0
0.8
0.6
0.4
0.2
0.0
Sensitivity
1 - Specificity
0.4 0.6 0.8 1.0 0.0 0.2
1 - Specificity
0.4 0.6 0.8 1.0 0.0 0.2
1 - Specificity
0.4 0.6 0.8 1.0 ROC curve
LA Global εsys % A
C
B
D
LA Global SRsys s–1
ROC curve
LA Global SRe s–1 LA Global SRa s–1
ROC curve
ROC curve
reservoir and conduit function deteriorated due to reduction of LV deformation as measured by VVI. At the same time, LA contractile function remained intact in patients without evidence of heart failure.
LA functions in previous studies
Previous reports have already noted that newer applications of echocardiography, such as strain imaging, may be a useful technique to evaluate LA myocardial function in different pathological states (13,22,30,31).
In agreement with our results, Ros¸ca et al[32]investigated 34 HCM with speckle tracking and reported that peak LAeand SR parameters were significantly reduced and related to LV dysfunction. Left atrial booster pump function emerged as an independent correlate of heart failure symptoms.
Paraskevaidis et al[27]quantified LA longitudinal function by TDI and 2D strain in 43 HCM patients—21 patients with non-HCM LVH, and 27 healthy volunteers. Left atrial longitudinal function is reduced in HCM compared to non-HCM LVH and healthy controls. Adding 2D contractile atrial strain to atrial diameter and volume index, inter-ventricular septal thickness, and E/A ratio and E/E0 ratios increased its prognostic value in differentiating HCM from non-HCM LVH (p,.001). The authors concluded that 2D atrial is more reproducible and less time consuming than TDI strain.
Additionaly, Shin et al[33]reported that through using real-time 3D echocardiography the maximal LA volume index was larger, and LA active emptying fraction was lower in 26 HCM patients when compared with control subjects, and the increased LA volume was related to decreased LA contraction in HCM. LA passive emptying was related to LV relaxation whereas LA active contraction was related to LV stiffness.
Myocardial function using VVI
Unlike previous methodology, we explored in this study indices of LV systolic and diastolic function using VVI acquired from the LV myocardium. We believe that this approach represents a new paradigm in evaluating LV function because it is based on measurements obtained directly from the ventricular myocardium and not mitral recordings during early LV filling. Therefore, problems related to annular and valvular pathology can be circumvented. Second, we obtained an index that was derived from all LV segments and is therefore more representative of global LV performance than classic EF%.
In this study we evaluated LA function quantification and assessed the characteristics of LA regional segments especially in presence of remodeling and dilation. Left atrial roof necessitates an angle-independent method; in addition, the very thin LA wall posed challenges to pure SPT techniques while VVI simplified the automated endocardial border tracking and resulted in a LA time-volume curve generated from volume measurements at every frame.
In the present study, analysis of LA deformation raises the question about its relationship with other functional parameters; surprisingly we found obvious relationships with TDI parameters but not with mitral inflow velocities, which may indicate on more load-dependent and “autonomic” LA function.
Clinical implications
This study provides further insight into the influence of HCM on mechanical function. Our figures and cutoff values put forward that LA deformation indices could be considered both diagnostic and prognostic adjuncts that facilitate unmasking of incipient myocardial dysfunction in HCM. We recommend serial measurement of LA strain/SR to detect the onset of LA contractile dysfunction and impaired LA compliance, known to take place in more advanced disease. These indices may prove to be useful in treatment decision making; however, the significance of these findings and their possible application will require further study.
STUDY LIMITATIONS
influence of myectomy in our cohort, with LVOT obstruction, on LA function has not been studied. The reported LV reverse remodeling following this operation,[34]could, in theory, have an effect on atrial function. Finally, the relatively small sample size may preclude strong statistical inference. However, we excluded patients who had recordings that could not be adequately interpreted; accordingly, the results are representative of a population among whom it is possible to use the VVI technique.
CONCLUSION
Left atrial reservoir and conduit function as measured by VVI-derived strain/strain rate is significantly impaired while contractile function is preserved in HCM patients with normal systolic function. Left atrial deformation is greatly influenced by LV mechanics and correlated to severity of phenotype. Vector velocity imaging has a discriminative power as a single measure to detect LA dysfunction in HCM.
Acknowledgements
We greatly appreciate the assistance of: Sarah Moharem Elgamal, M.sc, Assistant specialist (National heart institute), Heba Kassem, MD, PhD, (Assistant professor, Pathology and medical genetics, Alexendria University) and Ahmed El Guindy (Clinical support service AHC) for their patients referral and clinical consultation.
References
[1] Maron BJ. Hypertrophic cardiomyopathy: a systematic review. JAMA 2002;287:1308– 20.
[2] Maron BJ, McKenna WJ, Danielson GK, Kappenberger LJ, Kuhn HJ, Seidman CE, et al. ACC/ESC Clinical Expert Consensus Document on Hypertrophic Cardiomyopathy. A report of the ACC Foundation. Task Force on Clinical Expert Consensus Documents and ESC Committee for Practice Guidelines. Eur Heart J 2003;24:1965– 91.
[3] Losi MA, Nistri S, Galderisi M, Betocchi S, Cecchi F, Olivotto I, Agricola E, Ballo P, Buralli S, D’Andrea A, D’Errico A, Mele D, Sciomer S, Mondillo S. Echocardiography in patients with hypertrophic cardiomyopathy: usefulness of old and new techniques in the diagnosis and pathophysiological assessment. Cardiovasc Ultrasound 2010 Mar 17;8– 7. [4] Ommen SR. Echocardiographic assessment of diastolic function. Curr Opin Cardiol 2001;16:240– 5.
[5] Tsang TS, Barnes ME, Gersh BJ, Bailey KR, Seward JB. Left atrial volume as a morphophysiologic expression of left ventricular diastolic dysfunction and relation to cardiovascular risk burden. Am J Cardiol 2002;90:1284– 9. [6] Perk G, Tunick PA, Kronzon I. Non-Doppler two-dimensional strain imaging by echocardiography —from technical
considerations to clinical applications. J Am Soc Echocardiogr 2007;20:234 – 43.
[7] Sirbu C, Herbots L, D’hooge J, Claus P, Marciniak A, Langeland T, et al. Feasibility of strain and strain rate imaging for the assessment of regional left atrial deformation: a study in normal subjects. Eur J Echocardiogr 2006;7:199 –208. [8] Pirat B, Khoury DS, Hartley CJ, Tiller L, Rao L, Schulz DG, et al. A novel feature-tracking echocardiographic method for the quantitation of regional myocardial function: validation in an animal model of ischemia – reperfusion. J Am Coll Cardiol 2008;51:651 – 9.
[9] Vannan MA, Pedrizzetti G, Li P, Gurudevan S, Houle H, Main J, et al. Effect of cardiac resynchronization therapy on longitudinal and circumferential left ventricular mechanics by velocity vector imaging: description and initial clinical application of a novel method using high-frame rate B-mode echocardiographic images. Echocardiography 2005;22(10):826 –30.
[10] Bussadori C, Moreo A, Di Donato M, De Chiara B, Negura D, Dall’Aglio E, et al. A new 2D-based method for myocardial velocity strain and strain rate quantification in a normal adult and paediatric population: assessment of reference values. Cardiovascular Ultrasound 2009;7:8.
[11] Ishikawa T. Limitations and problems of assessment of mechanical dyssynchrony in determining cardiac resynchronization therapy indication. Is assessment of mechanical dyssynchrony necessary in determining CRT indication? (Con). Circ J 2011 Feb; 75(2): 465– 71. Epub 2011 Jan 8.
[12] Mele D, Pasanisi G, Capasso F, De Simone A, Morales MA, Poggio D, et al. Left intra ventricular myocardial deformation dyssynchrony identifies responders to cardiac resynchronization therapy in patients with heart failure. Eur Heart J 2006;27:1070 – 78.
[13] Jarnert C, Melcher A, Caidahl K, Persson H, Ryde’n L, Eriksson MJ. Left atrial velocity vector imaging for the detection and quantification of left ventricular diastolic function in type 2 diabetes. Eur J Heart Fail 2008;10:1080–87. [14] Burri MV, Nanda NC, Lloyd SG, Hsiung MC, Dod HS, Beto RJ, et al. Assessment of systolic and diastolic left ventricular
and left atrial function using vector velocity imaging in Takotsubo cardiomyopathy. Echocardiography 2008;25:1138– 44.
[15] Okamatsu K, Takeuchi M, Nakai H, Nishikage T, Salgo IS, Husson S, et al. Effects of aging on left atrial function assessed by two-dimensional speckle tracking echocardiography. J Am Soc Echocardiogr 2009;22:70– 5.
[16] Borg AN, Pearce KA, Williams SG, Ray SG. Left atrial function and deformation in chronic primary mitral regurgitation. Eur J Echocardiogr 2009;10:833– 40.
[17] Barbier P, Solomon SB, Schiller NB, Glantz SA. Left atrial relaxation and left ventricular systolic function determine left atrial reservoir function. Circulation 1999;100:427 –36.
[19] Inaba Y, Yuda S, Kobayashi N, Hashimoto A, Uno K, Nakata T, et al. Strain rate imaging for noninvasive functional quantification of the left atrium: comparative studies in controls and patients with atrial fibrillation. J Am Soc Echocardiogr 2005;18:729– 36.
[20] Wang T, Wang M, Fung JW, Yip GW, Zhang Y, Ho PP, et al. Atrial strain rate echocardiography can predict success or failure of cardioversion for atrial fibrillation: a combined transthoracic tissue Doppler and transesophageal imaging study. Int J Cardiol 2007;114:202– 9.
[21] Kokubu N, Yuda S, Tsuchihashi K, Hashimoto A, Nakata T, Miura T, et al. Noninvasive assessment of left atrial function by strain rate imaging in patients with hypertension: a possible beneficial effect of Renin-Angiotensin system inhibition on left atrial function. Hypertens Res 2007;30:13– 21.
[22] Moustafa SE, Alharthi M, Kansal M, Deng Y, Chandrasekaran1 K, Mookadam1 F. Global left atrial dysfunction and regional heterogeneity in primary chronic mitral insufficiency. Eur J Echocardiogr 2011;12(5):384– 93.
[23] Donal E, Raud-Raynier P, Racaud A, Coisne D, Herpin D. Quantitative regional analysis of left atrial function by Doppler tissue imaging derived parameters discriminates patients with posterior and anterior myocardial infarction. J Am Soc Echocardiogr 2005;18:32–8.
[24] Le Tourneau T, Messika-Zeitoun D, Russo A, Detaint D, Topilsky Y, Mahoney DW, et al. Impact of left atrial volume on clinical outcome in organic mitral regurgitation. J Am Coll Cardiol 2010;56:570– 8.
[25] Anne’ W, Willems R, Roskams T, Sergeant P, Herijgers P, Holemans P, et al. Matrix metalloproteinases and atrial remodeling in patients with mitral valve disease and atrial fibrillation. Cardiovasc Res 2005;67:655– 66.
[26] Verheule S, Wilson E, Everett T 4th, Shanbhag S, Golden C, Olgin J. Alterations in atrial electrophysiology and tissue structure in a canine model of chronic atrial dilatation due to mitral regurgitation. Circulation 2003;107:2615 – 22. [27] Paraskevaidis IA, Panou F, Papadopoulos C, Farmakis D, Parissis J, Ikonomidis I, et al. Evaluation of left atrial
longitudinal function in patients with hypertrophic cardiomyopathy: a tissue Doppler imaging and two-dimensional strain study. Heart 2009 Mar;95(6):483– 9. Epub 2008 Sep 2.
[28] Shin MS, Kim BR, Oh KJ, Bong JM, Chung WJ, Kang WC, et al. Echocardiographic assessments of left atrial strain and volume in healthy patients and patients with mitral valvular heart disease by tissue Doppler imaging and 3-dimensional echocardiography. Korean Circ J 2009;39:280 – 7.
[29] Stefanadis C, Dernellis J, Stratos C, Tsiamis E, Vlachopoulos C, Toutouzas K, et al. Effects of balloon mitral valvuloplasty on left atrial function in mitral stenosis as assessed by pressure-area relation. J Am Coll Cardiol 1998;32:159– 68. [30] Kuppahally SS, Akoum N, Burgon NS, Badger TJ, Kholmovski EG, Vijayakumar S, et al. Left atrial strain and strain rate in
patients with paroxysmal and persistent atrial fibrillation: relationship to left atrial structural remodeling detected by delayed-enhancement MRI. Circ Cardiovasc Imaging 2010 May;3(3):231– 9. Epub 2010 Feb 4.
[31] D’Andrea A, De Corato G, Scarafile R, Romano S, Reigler L, Mita C, et al. Left atrial myocardial function in either physiological or pathological left ventricular hypertrophy: a two-dimensional speckle strain study. Br J Sports Med 2008 Aug;42(8):696– 702, Epub 2007 Dec 10.
[32] Ros¸ca M, Popescu BA, Beladan CC, Ca˘lin A, Muraru D, Popa EC, et al. Left atrial dysfunction as a correlate of heart failure symptoms in hypertrophic cardiomyopathy. J Am Soc Echocardiogr 2010 Oct;23(10), 1090– 98, Epub 2010 Aug 23.
[33] Shin MS, Fukuda S, Song JM, Tran H, Oryszak S, Thomas JD, et al. Relationship between left atrial and left ventricular function in hypertrophic cardiomyopathy: a real-time 3-dimensional echocardiographic study. J Am Soc Echocardiogr 2006 Jun;19(6):796 –801.