Mailing Address: José Carlos Estival Tarastchuk Ć 5XD 3DGUH $QFKLHWD ă &XULWLED 35 %UD]LO
(PDLOMHVWLYDO#FDUGLROEU 5HFHLYHGRQĆ$FFHSWHGRQ
Changes in P-Wave After Percutaneous Mitral
Valvuloplasty in Patients With Mitral Stenosis and
Left Atrial Enlargement
José Carlos Estival Tarastchuk, Ênio Eduardo Guérios, Sônia Perreto, Ronaldo da Rocha Loures Bueno, Paulo Maurício Piá de Andrade, Deborah Cristina Nercolini, Álvaro Luiz Aranha Pacheco, Frederico Thomaz Ultramari, Alisson Moço Faidiga
+RVSLWDO8QLYHUVLWiULR(YDQJpOLFRGH&XULWLED&XULWLED35%UD]LO
O
BJECTIVETo investigate potential clinical, echocardiographic and/or hemodynamic predictors of the regression of electrocardiographic (ECG) signs of left atrial enlargement (LAE) after successful percutaneous mitral valvuloplasty (PMV).
M
ETHODSWe studied 24 patients (75% female, mean age =37.1 ± 11.9 years) with moderate to severe mitral stenosis (MS), sinus rhythm (SR) and ECG signs of LAE who underwent successful PMV between 2002 and 2004. At least 6 months after the procedure (388.2 ± 192.9 days), the patients returned for clinical, ECG and echocardiographic follow-up. They were then divided in 2 groups: patients of group 1 (n = 8; 33.3%) still had ECG signs of LAE, and patients of group 2 (n = 16; 66.6%), had normal P wave. A multivariate analysis of clinical, ECG, echocardiographic and hemodynamic variables was performed.
R
ESULTSThe mitral valve area (MVA) increased from 1.12 ± 0.15 cm2 to 1.9 ± 0.35 cm2 immediately after the
procedure (p < 0.0001) and decreased to 1.89 ± 0.41 cm2 at follow-up (p = NS). Left atrium diameter decreased
from 48 ± 2.9mm pre-procedure to 43 ± 4.8mm at follow-up (p = 0.0001). P-wave duration decreased from 0.12 ± 0.01 sec pre-PMV to 0.09 ± 0.02 sec at
IROORZXSS $Q09$FP2 at follow-up
was the only independent predictor of a normal P-wave after PMV (p=0.02).
C
ONCLUSIONECG changes suggestive of LAE regress in the majority of patients with MS and sinus rhythm that undergo a
VXFFHVVIXO309$Q09$FP2 at late follow-up was
found to be an independent predictor of such normalization.
K
EY WORDSPercutaneous mitral valvuloplasty, left atrial enlargement, mitral stenosis.
Electrocardiographic signs of left atrial enlargement are frequently found in patients with mitral stenosis and sinus rhythm which normally regress after a successful mitral valvuloplasty.
The changes in the left atrium can be verified indirectly in a practical and easy manner through the analysis of an electrocardiogram, by analyzing the criteria for diagnosing left atrial enlargement, as mentioned in the paper by Hazen et al., where the authors associate changes in P-wave morphology in the electrocardiogram to a high specificity (90%) for left atrium enlargement1. Another
paper associates changes in P-wave morphology to elevated pressure levels in the pulmonary artery2.
Percutaneous mitral valvuloplasty, first performed by Inoue et al, in 1982, is the procedure of choice for symptomatic cases (Functional Class above II-NYHA),
YDOYH DUHD FP2 and valve morphology that is
favorable to percutaneous intervention, in the absence of thrombus in the left atrium or in the absence of moderate or severe failure3. A low rate of complication
with significant clinical and hemodynamic improvement is expected in the short and long term4. In successful
procedures, the mitral valve area usually doubles, and the transvalvular gradient decreases by 50% to 60% immediately after the procedure3,5. An increase in the
velocity of flow in the left atrial appendage that has a correlation with the decrease and disappearance of the left atrium spontaneous contrast is observed. This finding suggests a beneficial effect of the procedure on blood stasis and on the causes of thromboembolism6,7. Other
authors mention the significant decrease in left atrium pressure after the procedure8.
Although there are numerous predictors of late events following the procedure – age, functional class IV, previous surgical commissurotomy, moderate to severe mitral deficit, echo score > 8, severe mitral deficit following dilatation and increased pressure in the pulmonary artery after dilatation, small valve area after the procedure
FP2), non-sinus rhythm, valve calcification on
fluoroscopy, increased LA pressure, increased transvalvular gradient9-15 ; there are no details in the literature about
changes of P wave in the electrocardiogram performed after the mitral valvuloplasty in patients with mitral stenosis and left atrial enlargement, and there is even less understanding about the meaning of these changes at late follow-up after the percutaneous intervention.
This study was carried out to investigate potential clinical, echocardiographic and hemodynamic predictors of regression of electrocardiographic signs of left atrial enlargement following successful mitral valvuloplasty.
M
ETHODSThis is a retrospective study of 24 patients submitted to successful mitral valvuloplasty between the years 2002 and 2004. The patients presented sinus rhythm and left
atrial enlargement on electrocardiogram pre-procedure.
The patients’ complete history was taken before the intervention and at late follow-up as well, with special emphasis on their functional class based on NYHA criteria. On auscultation, the murmurs in the mitral area were classified according to their intensity (+ to ++++) and to the phase of the cardiac cycle (systolic and diastolic). The patients underwent percutaneous mitral valvuloplasty using the technique described by Inoue et al16.
The electrocardiograms were performed prior to the procedure, immediately after and late after the procedure on a Dixtal device, where the usual 12 leads and long DII were obtained. The cardiac rhythm was observed and one or more of the following criteria of left atrial enlargement were verified: a P wave longer than 0.10 seconds on the bipolar leads, j.deflections separated by more than 0.03 seconds (especially in D1 and D2), deviation of the electric axis of P’s mean vector to the left, predominance of the negative phase in V1 and presence of the Morris Index17. The record was obtained at a velocity of 25
mm/s, analyzed using a ruler; the average bipolar leads was also calculated. Care was taken to ensure that the diagnosis of left atrial enlargement was agreed upon by two experienced independent cardiologists.
An echocardiographic study was carried out prior to the procedure, early after the procedure (48 hours post procedure) and late after the procedure, always by the same experienced practitioner. All the tests were performed on an Apogee 800 plus, manufactured by ATL (Advanced Technologies Laboratories) and on an AU3 Partner, manufactured by Esaote, with multifrequency convex transducers with emission frequency of 2.5-3.5 MHz. The images have been captured in the transverse parasternal view for analysis of the mitral commissure and planimetry of the valve. The morphological aspects of the mitral valve were quantified according to the Wilkins echocardiographic score18. The parameters of flow were
obtained in the apical four chamber view using pulsating, continuous wave and color Doppler.
After a minimum of six months after the percutaneous mitral valvuloplasty the patients were contacted by phone or mail and asked to come back to the Hemodynamics Department for clinical and echocardiographic follow-up. They underwent a second medical history, physical examination, and follow-up electrocardiogram and echocardiogram.
As to the statistical analysis, the between-group comparison was performed using Fisher’s exact test, the binomial test and Mann-Whitney’s non-parametric test. The evolution of the variables was studied pre and post-procedure and late post-post-procedure using the binomial test, Friedman’s non-parametric test and Wilcoxon’s non-parametric test. For multivariate analysis, due to the small number of cases, those variables whose p value
included. For these variables, the cut-off values have been stipulated by adjusting a Logistics Regression Model and obtaining the results here informed.
R
ESULTSThe 24 patients (75% female, mean age 37.13 ± 11.91 years) submitted to percutaneous mitral valvuloplasty, who, in the pre-procedure electrocardiogram, presented sinus rhythm with left atrial enlargement, presented the clinical, echocardiographic and hemodynamic characteristics in the pre and post-procedure period as mentioned in Table 1.
According to the follow-up electrocardiogram, obtained at follow-up at an average of 388.2 ± 192.9 days, patients were divided into two groups: Group 1 (n = 8; 33.3%) still with electrocardiographic signs of left atrial
enlargement at late follow up, and Group 2 (n = 16; 66.6%), with normal P wave. There was no difference between the groups as to the variables studied. The main clinical, electrocardiographic and echocardiographic characteristics of the two groups are on Table 2.
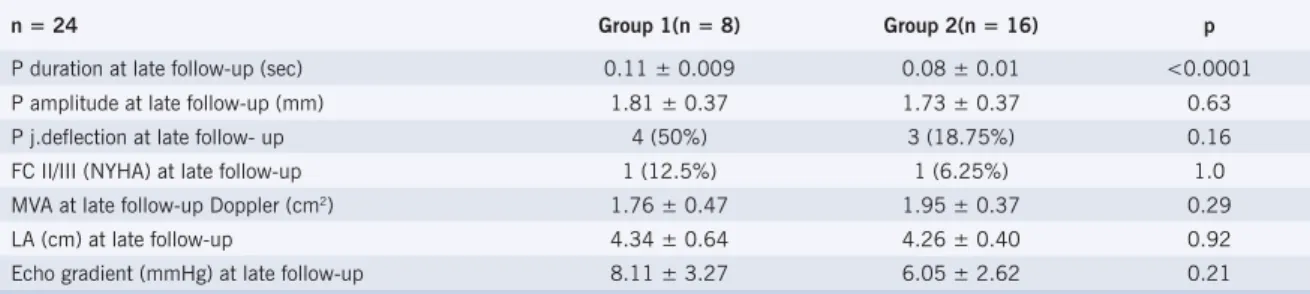
The clinical and electrocardiographic variables of left atrial enlargement obtained at late follow-up in both groups and their statistical differences are listed on Table 3.
In the search for independent predictors of P wave evolutive regression a multivariate analysis was performed including all clinical, echocardiographic and hemodynamic variables studied. The only independent predictor of the regression of electrocardiographic signs that diagnose left atrial enlargement was a mitral valve
DUHDFP2at late follow-up (p = 0.02).
Table 1 – Main clinical, echocardiographic and hemodynamic characteristics of the population studied
Pre-PMV Early Post-PMV Late Post-PMV p FCII/III(NYHA) 23 (95.8%) 2 (8.33%) <0.0001
DM++/+++ 18 (75%) 3 (12.5%) 0.0001
MVA planimetry (cm2) 1.17 ± 0.15 2.03 ± 0.34 1.96 ± 0.44 <0.0001
MVA Doppler (cm2) 1.12 ± 0.15 1.9 ± 0.35 1.89 ± 0.41 <0.0001
Left atrium (cm) 4.8 ± 0.29 4.34 ± 0.49 4.28 ± 0.48 0.0001 Pulmonary trunk pressure (mmHg) 34.71 ± 22.4 28.27 ± 11.69 0.0074 DP2LV (mmHg) 8.57 ± 3.57 10.19 ± 3.28 0.0025 ECHO Gradient (mmHg) 11.09 ± 4.21 6.41 ± 3.09 6.77 ± 2.97 0.0004 P Duration (seg) 0.12 ± 0.01 0.12 ± 0.01 0.09 ± 0.02 0.0001 FC - functional class; DM - diastolic murmur; MVA - mitral valve area ; DP2LV - final diastolic pressure in left ventricle; ECHO - echocardiogram.
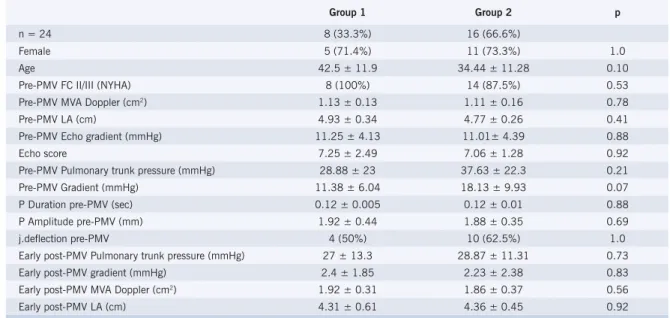
Table 2 – Main clinical, echocardiographic and hemodynamic characteristics of the groups obtained
Group 1 Group 2 p
n = 24 8 (33.3%) 16 (66.6%)
Female 5 (71.4%) 11 (73.3%) 1.0
Age 42.5 ± 11.9 34.44 ± 11.28 0.10 Pre-PMV FC II/III (NYHA) 8 (100%) 14 (87.5%) 0.53 Pre-PMV MVA Doppler (cm2) 1.13 ± 0.13 1.11 ± 0.16 0.78
Pre-PMV LA (cm) 4.93 ± 0.34 4.77 ± 0.26 0.41 Pre-PMV Echo gradient (mmHg) 11.25 ± 4.13 11.01± 4.39 0.88 Echo score 7.25 ± 2.49 7.06 ± 1.28 0.92 Pre-PMV Pulmonary trunk pressure (mmHg) 28.88 ± 23 37.63 ± 22.3 0.21 Pre-PMV Gradient (mmHg) 11.38 ± 6.04 18.13 ± 9.93 0.07 P Duration pre-PMV (sec) 0.12 ± 0.005 0.12 ± 0.01 0.88 P Amplitude pre-PMV (mm) 1.92 ± 0.44 1.88 ± 0.35 0.69 j.deflection pre-PMV 4 (50%) 10 (62.5%) 1.0 Early post-PMV Pulmonary trunk pressure (mmHg) 27 ± 13.3 28.87 ± 11.31 0.73 Early post-PMV gradient (mmHg) 2.4 ± 1.85 2.23 ± 2.38 0.83 Early post-PMV MVA Doppler (cm2) 1.92 ± 0.31 1.86 ± 0.37 0.56
Early post-PMV LA (cm) 4.31 ± 0.61 4.36 ± 0.45 0.92 FC - functional class; MVA - mitral valve area; LA - left atrium; ECHO - echocardiogram.
D
ISCUSSIONWe obser ved a high rate of patients whose electrocardiograms presented regression in the signs of left atrial enlargement at late follow-up – 66.6% of patients did not present this alteration after the mitral valvuloplasty.
There are few studies in the medical literature which make a correlation between percutaneous mitral valvuloplasty and the related electrocardiographic changes. There are even less studies which mention specific changes in the P wave of electrocardiograms or long term improvement of left atrial enlargement after the procedure. Chandrasekar et al.19 demonstrated that acute
hemodynamic changes following mitral valvuloplasty with a balloon produce changes in the electrocardiogram, indicative of an important hemodynamic benefit resulting from the procedure. In this study patients who had changes in the P-wave patterns had a significant decrease in the left atrium average pressure, smaller residual transmitral gradient and a higher percentage in the opening of the mitral valve. However, the assessment was restricted to the first 72 hours post procedure19. Turhan et al20
associated a significant decrease in P-wave dispersion (a new electrocardiographic marker associated with changes in the propagation of the sinus impulse that is the difference between the maximum and the minimum P-wave duration) following mitral valvuloplasty in both the short and the long term.
The findings of this paper in a way support those mentioned before, since they relate the disappearance of the left atrium enlargement on electrocardiography to the presence of larger valve areas at late follow-up.
To conclude, we point out that the changes in the P-wave which suggest left atrial enlargement regress in most patients with mitral stenosis and sinus rhythm submitted to a successful percutaneous mitral valvuloplasty. The
ILQGLQJRIDPLWUDOYDOYHDUHDFP2 at late
follow-up was considered an independent predictor of such normalization.
Potential Conflict of Interest
No potential conflict of interest relevant to this article was reported.
R
EFERENCES1. Hazen MS, Marwick TH, Underwood DA. Diagnostic accuracy of the resting electrocardiogram in detection and estimation of left atrial enlargement: an echocardiographic co-relation in 551 patients. Am Heart J 1991; 122:823-8.
2. Faggiano P, D’Aloia A, Zanelli E, et al. Contribution of left atrial pressure and dimunsion to signal-average in patients with chronic congestive heart failure. Am J Cardiol 1997; 79:219-22.
3. Bonow RO, Carabello B, de Leon AC Jr, et al. ACC/AHA Guidelines for the management of patients with valvular heart disease: a report of the American College of Cardiology/ American Heart Association Task Force on Practice Guidelines (Comittee on Management of Patients With Valvular Heart Disease). J Am Coll Cardiol 1998; 32:1486-588. 4. Guérios EE, Bueno RRL, Nercolini DC, et al. Randomized Comparison
between Inoue balloon and metalic commisurotome in the treatment of rheumatic mitral stenosis: immediate results and 6-months and 3-year follow-up. Cathet Cardiovasc Interv 2005; 64(3):301-11. 5. Carrol JD, Feldman T. Percutaneous mitral balloon valvotomy and the
new demographics of mitral stenosis. JAMA 1993; 270:1731-6. 6. Porte JM, Cormier B, Iung B, et al. Early assesment by transesophageal
echocardiography of left atrial appendage function after percutaneous mitral commissurotomy. Am J Cardiol 1996; 17(1):72-6.
7. Cormier B, Vahanian A, Iung B, et al. Influence of percutaneous mitral commissurotomy on left atrial spontaneous contrast of mitral stenosis. Am J Cardiol 1993; 71(10):842-7.
8. Arora R, Kalra GS, Singh S, et al. Percutaneous transvenous mitral commissurotomy: immediate and long-term follow-up results. Cathet Cardiovasc Interv 2002; 55:451-6.
9. Palacios IF, Sanches PC, Harrel LC, et al. Wich patients benefit from percutaneous mitral balloon valvuloplasty? Prevavuloplasty and postvalvuloplasty variables that predict long-term outcome. Circulation 2002; 105(12):1465-71.
10. Hernandez R, Banelos C, Alfonso F, et al. Long-term clinical and echocardiographic follow-up after percutaneous mitral valvuloplasty with the Inoue balloon. Circulation 1999; 99(12):1580-6. 11. Iung B, Cormier B, Ducimetiere P, et al. Functional results 5 years after
successlful percutaneous mitral commissurotomy in a series of 528 patients and analysis of predictive factors. J Am Coll Cardiol 1996; 27(2):407-14.
12. Iung B, Garbaz E, Michaud P, et al. Late Results of percutaneous mitral commissurotomy in a series of 1024 patients: analysis of late clinical deterioration: frequency, anatomic findings and predictive factors. Circulation 1999; 99(25):3272-8.
Table 3 – Clinical, echocardiographic and electrocardiographic variables obtained at late follow-up
n = 24 Group 1(n = 8) Group 2(n = 16) p P duration at late follow-up (sec) 0.11 ± 0.009 0.08 ± 0.01 <0.0001 P amplitude at late follow-up (mm) 1.81 ± 0.37 1.73 ± 0.37 0.63 P j.deflection at late follow- up 4 (50%) 3 (18.75%) 0.16 FC II/III (NYHA) at late follow-up 1 (12.5%) 1 (6.25%) 1.0 MVA at late follow-up Doppler (cm2) 1.76 ± 0.47 1.95 ± 0.37 0.29
LA (cm) at late follow-up 4.34 ± 0.64 4.26 ± 0.40 0.92 Echo gradient (mmHg) at late follow-up 8.11 ± 3.27 6.05 ± 2.62 0.21 FC - functional class; MVA - mitral valve area; LA - left atrium.
13. Orrange SE, Kawanish DT, Lopez BM, et al. Acturial outcome after catheter balloon commissurotomy in patients with mitral stenosis. Circulation 1997; 95:382-9.
14. Pan M, Medina A, Suarez de lezo J, et al. Factors determining late success after mitral balloon valvulotomy. Am J Cardiol 1993; 71(13);1181-5.
15. Ben Farhat M, Betbout f, Gamrah H, et al. Predictors of long-term event-free survival and of event-freedom from restenosis after percutaneous balloon mitral commissurotomy. Am Heart J 2001; 142(8):1072-9. 16. Inoue K, Owaki T, Nikamura T, et al. Clinical application of transvenous
mitral commissurotomy by a new balloon catheter. J Thorac Cardiovasc Surg 1984; 87:394-402.
17. Enéas FC. Os crescimentos atriais. In Carneiro, EF. O eletrocardiograma 10 anos depois. Rio de Janeiro: Livraria Editora Enéas Ferreira Carneiro, 1992:113-8.
18. Wilkins GT, Weyman AE, Abascal VM, et al. Percutaneous balloon dilatation of the mitral valve: an analysis of echocardiographic variables related to outcome and the mechanism of dilatation. Br Heart J 1988; 60:299-308.
19. Chandrasekar B, Loya Ys, Sharma S, et al. Acute effect of balloon mitral valvotomy on serial electrocardiographic changes and their haemodynamic correlation. Indian Heart J 1998; 50(2):179-82. 20. Turhan H, Yetkin E, Senen K, et al. Effects of percutaneous mitral
balloon valvuloplasty on p- wave dispersion in patients with mitral stenosis. Am J Cardiol 2002; 89(5): 607-9.