SRef-ID: 1432-0576/ag/2004-22-3927 © European Geosciences Union 2004
Annales
Geophysicae
Vertical velocity and turbulence aspects during Mistral events as
observed by UHF wind profilers
J.-L. Caccia1, V. Gu´enard1, B. Benech2, B. Campistron2, and P. Drobinski3
1LSEET, CNRS/Universit´e de Toulon, BP132, 83957 La Garde, France 2CRA/LA, CNRS/Obs. Midi-Pyr´en´ees, 65300 Campistrous, France
3IPSL/SA, CNRS/Universit´e de Paris VI, Jussieu, 75252 Paris Cedex 05, France
Received: 1 December 2003 – Revised: 26 April 2004 – Accepted: 12 May 2004 – Published: 29 November 2004 Part of Special Issue “10th International Workshop on Technical and Scientific Aspects of MST Radar (MST10)”
Abstract. The general purpose of this paper is to exper-imentally study mesoscale dynamical aspects of the Mis-tral in the coastal area located at the exit of the Rhˆone-valley. The Mistral is a northerly low-level flow blowing in southern France along the Rhˆone-valley axis, located be-tween the French Alps and the Massif Central, towards the Mediterranean Sea. The experimental data are obtained by UHF wind profilers deployed during two major field cam-paigns, MAP (Mesoscale Alpine Program) in autumn 1999, and ESCOMPTE (Exp´erience sur Site pour COntraindre les Mod`eles de Pollution atmosph´eriques et de Transports d’Emission) in summer 2001.
Thanks to the use of the time evolution of the vertical pro-file of the horizontal wind vector, recent works have shown that the dynamics of the Mistral is highly dependent on the season because of the occurrence of specific synoptic pat-terns. In addition, during summer, thermal forcing leads to a combination of sea breeze with Mistral and weaker Mistral due to the enhanced friction while, during autumn, absence of convective turbulence leads to substantial acceleration as low-level jets are generated in the stably stratified planetary boundary layer. At the exit of the Rhˆone valley, the gap flow dynamics dominates, whereas at the lee of the Alps, the dy-namics is driven by the relative contribution of “flow around” and “flow over” mechanisms, upstream of the Alps. This pa-per analyses vertical velocity and turbulence, i.e. turbulent dissipation rate, with data obtained by the same UHF wind profilers during the same Mistral events.
In autumn, the motions are found to be globally and signif-icantly subsident, which is coherent for a dry, cold and stable flow approaching the sea, and the turbulence is found to be of pure dynamical origin (wind shears and mountain/lee wave breaking), which is coherent with non-convective situations. In summer, due to the ground heating and to the interac-tions with thermal circulation, the vertical mointerac-tions are less pronounced and no longer have systematic subsident
chara-Correspondence to:J.-L. Caccia ([email protected])
teristics. In addition, those vertical motions are found to be much less developed during the nighttimes because of the stabilization of the nocturnal planetary boundary layer due to a ground cooling. The enhanced turbulent dissipation-rate values found at lower levels during the afternoons of weak Mistral cases are consistent with the installation of the sum-mer convective boundary layer and show that, as expected in weaker Mistral events, the convection is the preponderant factor for the turbulence generation. On the other hand, for stronger cases, such a convective boundary layer installation is perturbed by the Mistral.
Key words. Meteorology and atmospheric dynamics (Mesoscale meteorology, turbulence) – Radio science (Instruments and techniques)
1 Introduction
The Mistral is a northerly low-level, orography-induced, cold-air out-break over the Gulf of Lions, blowing off the shore of the south-eastern region of France at any season. The climate of this area is under the influence of the Mistral which brings clear sky. It is frequently observed to extend as far as a few hundreds of kilometers offshore and is one of the primary causes of storms over the northwestern Mediter-ranean.
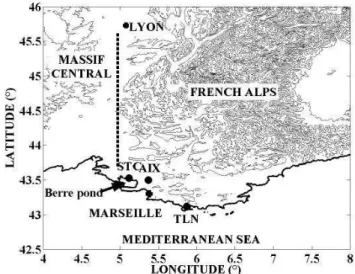
On meeting the Alpine range, a westerly to northerly syn-optic flow is deflected westward by the Coriolis force, as well as the pressure build up on the upstream edge of the range. As the flow experiences channelling in the Rhˆone valley sep-arating the French Alps, to the east, from the Massif Central, to the west, by a gap of 200 km long and 40 km width (see Figs. 1 and 2), it is substantially accelerated, giving birth to the Mistral (Pettr´e, 1982).
in-15
Fig. 1. Map of surface wind and geopotential at 1000 hPa above western Europe in a typical Mistral situation from ECMWF-model analyses. The autumn case (see the text) is presented :(a)6 Novem-ber 1999, 12:00 UTC and(b)7 November 1999, 12:00 UTC. The wind speed is indicated in color code and the direction by arrows. The thick and narrow lines show the shore lines and the topography levels every 500 m, respectively, used by the model.
vestigated. During MAP (Mesoscale Alpine Program, au-tumn 1999, see Bougeault et al., 2001) and ESCOMPTE (Exp´erience sur Site pour COntraindre les Mod`eles de Pol-lution atmosph´eriques et de Transport d’Emissions, summer 2001, see Cros et al., 2004) field experiments, an UHF-wind profiler network has been deployed in the coastal region of south-eastern France to document the spatial and temporal structure of the tropospheric flow and in particular during some Mistral events. Gu´enard et al. (2002) reported prelim-inary results from UHF-profiler data during several Mistral events, and Drobinski et al. (2003) reported combined and complementary observations of the wind field made by air-borne Doppler Lidar (WIND) and UHF-wind profilers in a Mistral situation. The networking approach, combined with the high vertical (75 m) and time (5 min) resolutions of the UHF-wind profilers, enables the study of the mesoscale inho-mogeneity and unsteadiness aspects of the Mistral, as well as
16
Fig. 2.Area in southern France targeted by our Mistral study. The UHF wind profiler sites, St-Chamas (STC), Aix-les-Milles (AIX) and Toulon (TLN), are indicated. The lower contour line, for the mountainous areas, is at 500 m of altitude. The dotted line schemat-ically indicates the Rhˆone-valley axis. The distances between STC and AIX, and between STC and TLN, are 25 km and 90 km, respec-tively.
its interactions with the ABL (Atmospheric Boundary Layer) and thermal circulations mainly due to the proximity of the sea.
In this paper, we have chosen to present and analyse wind and turbulence data obtained by two UHF-wind profilers dur-ing three Mistral cases (a strong autumn case and a moder-ate and a weak summer case) among the seven cases that occurred during MAP (three cases) and ESCOMPTE (four cases). In addition to earlier papers on mesoscale modelling aspects related to the Mistral (e.g. Blondin and Bret, 1986), a recent one (Caccia et al., 2001) has shown, for the first time, direct comparisons between time-height diagrams of wind fields directly obtained by UHF-profilers and simu-lated by the Meso-NH (mesoscale non-hydrostatic) model (Lafore et al., 1998), run over a 10-km resolution domain nested in a 50-km resolution domain. These comparisons have been made during the strong autumn case. The Mis-tral onset phase is correctly reproduced by meso-NH but the temporal variation of the wind vertical structure is not and the event duration is strongly overestimated. These discrep-ancies illustrate the difficulty for mesoscale models to cor-rectly describe the ABL dynamics when the topography is very variable (here valleys, mountains, hills and land-to-sea transition) and plays a very important role. In summer, an encreased difficulty is expected due to the thermal forcings (convection and land/sea-breezes).
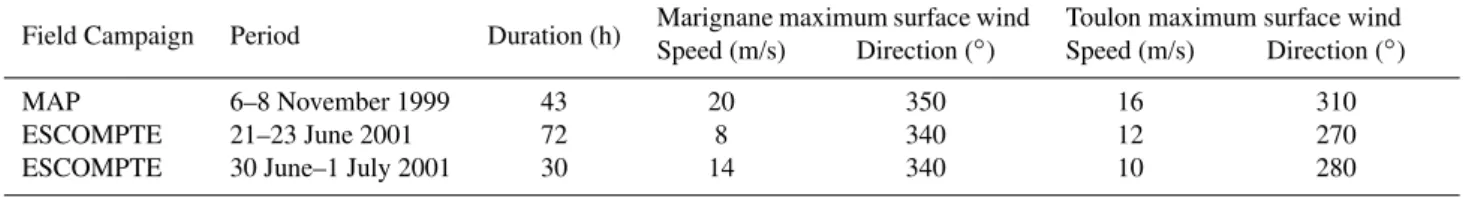
stud-Table 1.Characteristics of the three Mistral events reported in the present study.
Field Campaign Period Duration (h) Marignane maximum surface wind Toulon maximum surface wind Speed (m/s) Direction (◦) Speed (m/s) Direction (◦)
MAP 6–8 November 1999 43 20 350 16 310
ESCOMPTE 21–23 June 2001 72 8 340 12 270
ESCOMPTE 30 June–1 July 2001 30 14 340 10 280
ied Mistral-induced wind and temperature fluctuations us-ing in-situ aircraft measurements made along legs above the Mediterranean Sea, Jiang et al. (2003) interpreted mesoscale model simulations with satellite images and in-situ, airborne Lidar, airborne Radar and dropsonde data obtained from two aircraft, and Corsmeier et al. (2004) studied the influence of the Mistral on pollutant transport using numerical model simulations and measurements from airborne and ground-based platforms. In a previous work (Gu´enard et al., 2004), horizontal wind data were already used to show and inter-pret the sharp time variation of the Mistral vertical structure, to describe the role of the upstream orography, in the autumn case, one radar being installed near the Rhˆone-valley exit and the second one in the lee of the Alps, and to analyse the in-teractions between the Mistral and thermal circulations, such as land/sea breezes, in the summer cases. The purpose of the present paper is to extend those results to the analysis and in-terpretation of the vertical velocity and turbulence data. Such a scientific purpose is motivated by 1) instrumental and 2) mesoscale low-tropospheric physics aspects.
1. Though the capability of UHF radars to make horizon-tal wind measurements is well established (e.g. Ecklund et al., 1988; Gage et al., 1994), the vertical velocity (w) measurement is much more controversial, mainly at lower levels where ground clutter contaminates w esti-mations and where a quasi-systematic bias of the order of −10 cm s−1 exists (Angevine, 1997; Lothon et al.,
2002; Lothon et al., 2003). Also, a turbulent parame-ter, such as the turbulent dissipation rate used here, is indirectly estimated from UHF Doppler spectral width (Jacoby-Koaly et al., 2002; Heo et al., 2003). Those two kinds of data need to be reported and validated in the largest variety of meteorological situations. The use of general knowledge about Mistral meteorological condi-tions and the results already obtained in the three Mis-tral particular cases reported here constitute a good op-portunity to test the vertical velocity and turbulence data provided by UHF-radars.
2. Since the air masses brought by the Mistral are rela-tively cold and dry when reaching the sea, in absence of thermal effects, as in winter and mid-seasons, they are expected to be globally subsident. Such a system-atic behaviour is no longer observed in summer because of ground heating and the land/sea breeze which lead
to thermal circulations. Those aspects are investigated here thanks to a combination of vertical velocity and tur-bulence data. In the summer cases, the development of convective turbulence within the ABL can thus be mon-itored. Turbulent data are also pertinent in the strong autumn case, since turbulence of dynamical origin is expected because of wind shears and possible moun-tain/lee wave breaking (Fritts et al., 1994; Ralph et al., 1997).
2 Brief description of the mistral meteorological aspects
Westerly to northerly upper-level large-scale flow patterns may lead to Mistral events. They must be associated with a Genoa Gulf cyclone in the lee of the Alps (Tafferner and Egger, 1990; Trigo et al., 1999) that results, at ground level, in a north-south negative pressure gradient component allow-ing the air masses to be channeled and accelerated along the Rhˆone valley. The Mistral depth observed near the coast de-pends on the upstream conditions (wind direction, Froude number, inversion layer height) which determine if the flow passes over or is blocked by the mountains along the lateral sides of the valley. In the case of blocked flow, the Mistral comes from the Rhˆone valley exit only.
Surface winds usually range from 10 to 20 m s−1 over land, but situations leading to offshore winds reaching 30– 40 m s−1 are not seldom. Maximum winds are found be-tween 500 and 1500 m AGL and range from 20 to 50 m s−1. All these values clearly show that the Mistral is a low-level jet which can strongly affect the ABL dynamics. The du-ration of the Mistral depends on the synoptic configudu-ration, and ranges from one day to one week or even more in ex-treme cases.
Table 1 reports some characteristics of the three Mistral events studied here. The mentioned maximum surface wind are actually the maximum hourly averaged wind speeds and their corresponding directions recorded during each event at the Marignane airport, near Marseille, and at Toulon (from the M´et´eo-France surface network).
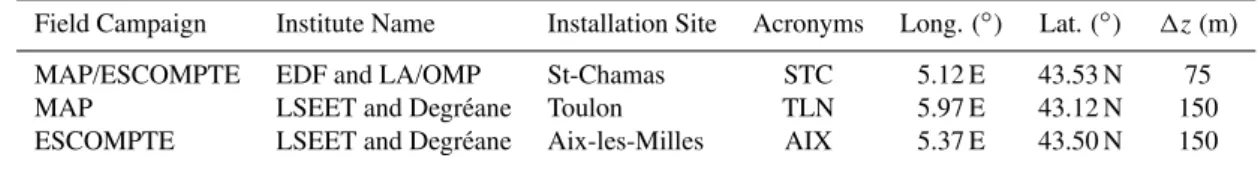
Table 2.Summarized information on the UHF wind profilers used in the present study.
Field Campaign Institute Name Installation Site Acronyms Long. (◦) Lat. (◦) 1z(m)
MAP/ESCOMPTE EDF and LA/OMP St-Chamas STC 5.12 E 43.53 N 75 MAP LSEET and Degr´eane Toulon TLN 5.97 E 43.12 N 150 ESCOMPTE LSEET and Degr´eane Aix-les-Milles AIX 5.37 E 43.50 N 150
weak case for the 21–23 June 2001 period. The surface wind direction values show a classical Mistral characteristics, that is the flow is quasi-southward at Marignane (not far from the Rhˆone-valley exit) and is more eastward at Toulon. Indeed, after the Rhˆone-valley exit, the air masses progressively veer eastward around the Genoa cyclone center.
Figure 1 shows two surface maps of the horizontal wind and of the geopotential height at 1000 hPa from the ECMWF (European Center for Medium-range Weather Forecast) model analyses obtained during the strong Mistral case, i.e. 6 November, 12:00 UTC (beginning of the event, Fig. 1a and 7 November, 12:00 UTC (end of the event, Fig. 1b. The role played by the major mountain ranges (Massif Central and Alps) for this N-NW synoptic flow situation over west-ern Europe is clearly visible both from the wind distribution and from the occurrence of the Genoa Gulf cyclone observed downstream the Alps. The installation sites of the UHF pro-filers used here are indicated on Fig. 1 by the red thick dots near STC, AIX and TLN (see Sect. 3). It is clear that those locations are all under the influence of the Mistral.
3 Experimental setup
The measurements, from Degr´eane UHF-wind profilers (1238 MHz-frequency and 4 kW-peak power), consist of the time evolution of the vertical profiles of the three wind com-ponents thanks to one vertical beam and two, or four (de-pending upon the radar) oblique beams slanted at an off-zenith angle of 17◦, with the half power beamwidth being 8.5◦. Return echoes are due to the air refractive index fluctu-ations advected by the wind. The wind velocity is estimated from the frequency corresponding to the mean Doppler shift obtained in the radar echo. The turbulent variable used here is the dissipation rate of turbulent kinetic energyεdeduced from the Doppler spectral width. The details of this radar
εretrieval technique and its assessment against aircraft data are presented in Jacoby-Koaly et al. (2002).
Data quality control and processing are carried out through a consensus algorithm based on time and height continuity of measured spectra to remove contamination from precipi-tation, birds, radio frequency interference and others sources. The consensus works over a 30-min period, providing a wind profile each 15 min from a height of 375 m up to 2500– 4000 m AGL (mainly depending upon humidity and turbu-lence conditions). The vertical resolution and range gate1z
is 75 m or 150 m (see Table 2).
The Data from two radars are used in our study. Dur-ing MAP, they were installed at St-Chamas (STC), upstream from the Berre pond near Marseille, and at Toulon (TLN), 90 km to the east, and during ESCOMPTE, the STC radar was also used, whereas the other radar moved to Aix-les-Milles (AIX), 25 km to the east (see Fig. 2). Table 2 summa-rizes this information.
As shown in Fig. 2, for the two campaigns, the STC radar was very close to the Rhˆone-valley exit, whereas the other one, AIX or TLN, was installed more in the lee of the French Alps in northerly flow situations.
4 Experimental results and discussions
4.1 Horizontal-wind observations: a recall of previous re-sults
Figure 3 shows STC a) and TLN b) UHF-profiler obser-vations of the horizontal wind vector made during the 6–8 November 1999 (MAP). Maximum wind speeds of 35 m s−1 at 1300 m, on 6 November, 21:00 UTC, and 30 m s−1 at 1100 m, on 6 November, 19:00 UTC, are observed above STC and TLN, respectively. The Mistral wind direction is between NW and N during the whole episode, which is a classical feature.
the Alps to the north of TLN (maximum upstream elevation around 3000 m), whereas STC still observed air masses di-rectly exiting from the Rhˆone valley. This result illustrates the important role played by the upstream orography to de-termine whether or not a given site is under the influence of the Mistral.
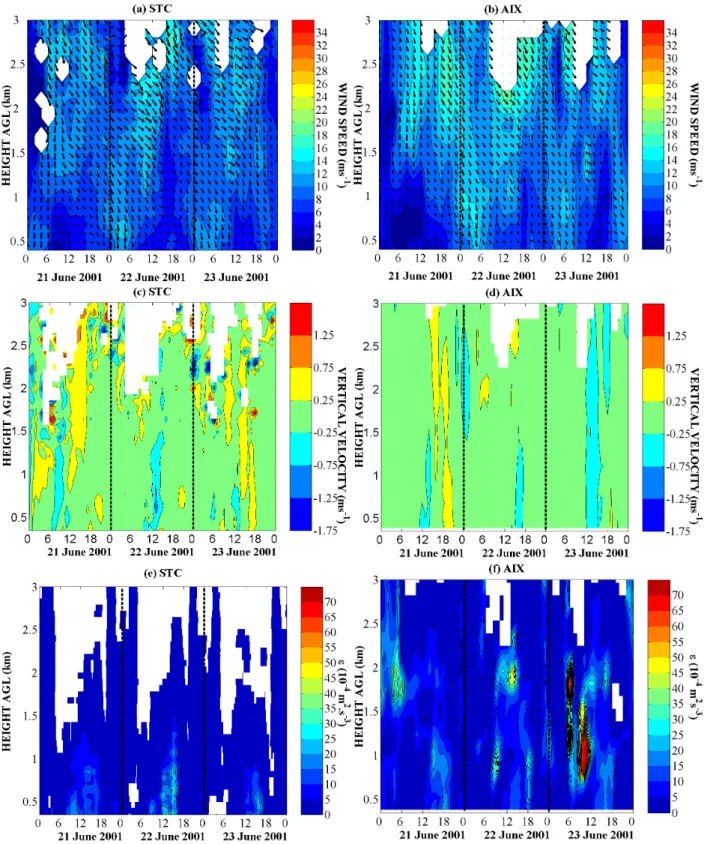
Figure 4 shows STC a) and AIX b) UHF-profiler observa-tions of the horizontal wind vector made during the 21–23 June 2001 period (ESCOMPTE). The maximum wind speed values are between 12 and 15 m s−1below 1500 m.
This case is a Mistral event often observed in summer and featured by WNW synoptic upstream conditions (quasi-stationary during the whole event), weaker wind speeds and interactions with thermal circulations. Figures 4a and b clearly show that the Mistral blows at lower levels during the nights and is “lifted up” during the daytime, especially the afternoons where the ground heating is maximum and where the near-surface wind is weak (maximum of 5 m s−1and the direction is more eastward. Those results are consistent with the presence of sea-breeze circulations.
For the 30 June–1 July 2001 event (see Fig. 5), which is a moderate Mistral case, the wind starts blowing on 30 June in the afternoon, with a maximum wind speed ranging from 15 to 18 m s−1in the 1.5–2.5 km height slice above the two sites. During the onset phase and similarly to the 21–23 June event, weak westerly winds, i.e. between 2 and 10 m s−1, blow up to 1 km height. Although the time-height wind di-rection fields are quite similar above STC (Fig. 5a) and AIX (Fig. 5b), the time-height wind speed fields differ from one site to the other, despite their proximity (here 25 km apart). In particular, on 1 July, at AIX, the Mistral temporarily stops blowing between 00:00 UTC and 06:00 UTC, and the Mistral breakdown occurs at 12:00 UTC while it persists 12 h more at STC. This is possibly due to a slight shift in the upper-level wind direction which may displace the Mistral eastern shear line above AIX while STC remains in the core of the Mistral (similarly to the 28 June 2001 case, see Drobinski et al., 2003). It should also be noticed that the “lift up” and the near-surface weak westerly wind are not observed during the afternoon on 1 July, probably because the Mistral wind is stronger than in the weak Mistral cases usually observed in summer.
The upstream Froude number is found between 0.05 and 0.46, thus smaller than 1, as for the autumn case, during both the summer cases. On the other hand, the wind speed values are significantly weaker and the upstream inversion height is less well marked and/or higher than in the autumn case. These are the main reasons why, in addition to the orographic effects, the thermal forcings can also strongly influence the wind vertical structure variations observed during the sum-mer Mistral events.
In summary, the dynamics of the Mistral is highly depen-dent on the season because of the occurrence of specific syn-optic patterns and because, during summer, thermal forcing leads to a combination of sea breeze with Mistral and weaker winds due to enhanced friction (see Fig. 4) while during au-tumn the absence of thermal turbulence leads to substancial
acceleration as low-level jets are generated in stably strati-fied ABL. Also, the structure of the Mistral evolves rapidly and its dynamics differ from one location to another. At the exit of the Rhˆone valley, the gap flow dynamics dominates (see STC observations, Figs. 3a and 5a), whereas at the lee of the Alps the dynamics is driven by the relative contribu-tion of “flow around” and “flow over” mechanisms upstream of the Alps (see TLN observations, Fig. 3b and AIX observa-tions, Fig. 5b), themselves governed by the upstream Froude number conditions.
4.2 Analysis of the vertical velocity and turbulent dissipation-rate fields
Time-height vertical velocity and turbulent dissipation-rate fields in Mistral situations are presented here for the first time. The vertical velocity values have been temporally smoothed using a 2-h width moving-averaging window in or-der to remove short period waves.
The vertical velocity field observed on 6–8 November 1999 above STC and TLN and shown on Figs. 3c and d, re-spectively, reveals that the air masses are globally subsident during the Mistral activity. This behaviour is consistent with cold and dry air masses arriving from the north and observed above sites located beyond the last descending slopes before the sea. This is particularly true in November, where there is no significant ground heating and when the presence of low-level cold air makes the ABL statically stable. Figures 3c and d clearly show such a behaviour that represents quasi-systematic negative vertical velocities in the height-time re-gion concerned by the Mistral episode, with stronger values varying between−1 and−1.5 m s−1above STC and between −1.5 and−2 m s−1above TLN. These negative w values are
strong and cannot be confused with the negative vertical bias of the order of−10 cm s−1that affects UHF vertical velocity
measurements (Angevine, 1997).
Two patterns of relatively strong positive w values are nev-ertheless observed, first, at STC around 01:00 UTC above 1 km of altitude (see Fig. 3c), and second, at TLN between 08:00 and 11:00 UTC below 1 km of altitude (Fig. 3d). In the first case, the positive w values are obtained in the Mis-tral core (see Fig. 3a) but during a very short period (∼=1 h) and cannot be explained by the pure Mistral dynamics. In the second case, the positive w values are observed during the Mistral erosion phase (Fig. 3b), that is when the wind speed progressively weakens, here from 12 to 4 m s−1while keeping the same north direction. During this phase, a pro-gressive and relative warming may occur which could tem-porarily lead to convective upward motions.
peri-Fig. 4.Same as Fig. 3, at STC(a,c,e)and AIX(b,d,f), during the 21–23 June 2001 Mistral event (from the ESCOMPTE Special Observing Period).
ods. Detailed comparisons between Figs. 3e and a, for the STC case, and between Figs. 3f and b, for the TLN case, show that the enhancedεvalues are obtained in time-height areas corresponding to sharp variations of wind speed with
Fig. 5.Same as Fig. 3, at STC(a,c,e)and AIX(b,d,f), during the 30 June–1 July Mistral event (from the ESCOMPTE Special Observing Period).
high static stability. More explicitly, such a turbulence gen-erated in stably stratified flow is due to dynamic instabilities induced by wind shears. This is observed when and where the vertical shear of the horizontal wind is strong enough to
be-tween 800 and 1600 m and bebe-tween 7 November, 18:00 UTC and 8 November, 01:00 UTC, that is within the period where the lower-level air masses are blocked upstream by the Alps (see previous sub-section). This is probably the signature of the mountain/lee waves breaking, as suggested by Jiang et al. (2003), which mainly occur in the lee of the lateral sides of the Rhˆone valley, here the eastern side. As a possible con-firmation, it should be noticed that those enhancedεvalues are obtained in a quasi-absence of wind (around 3 m s−1 in average, see Fig. 3b), which suggests that the main origin of the turbulence is not simply wind shear, as in the previ-ous case. Turbulence induced by breaking mountain waves has been simulated by Fritts et al. (1994) and observed by Ralph et al. (1997). In those papers the complexity of the relationship beween shear-induced and/or convective origins for the turbulence production during a mountain wave break-ing episode is underlined.
The vertical velocity fields obtained during summer Mis-tral events are presented in Figs. 4c and 5c, for STC, and Figs. 4d and 5d, for AIX. As expected, clear signatures of global subsidence during Mistral episodes are no longer visible in those cases where ground heating and thermal circulations perturb the ABL dynamics. It is nevertheless noticeable that the vertical velocity scale below 1500 m is
−0.75 to 0.75 m s−1 during daytimes, i.e. from 06:00 to
21:00 UTC, whereas they are between−0.25 and 0.25 m s−1
during night-times, i.e. from 21:00 to 06:00 UTC. These ob-servations are consistent with a less convective, or more sta-bilized ABL, during nighttimes, due to the night ground cool-ing, which tends to prevent vertical motions. During day-times, convective vertical motions are possible which explain stronger vertical velocity values.
Time-height diagrams ofε obtained during the summer weak Mistral event are shown in Fig. 4e, for STC, and Fig. 4f, for AIX. These figures show enhancedεvalues for the same periods where the Mistral is “lifted up” (see previous sub-section and Figs. 4a and b, that is during daytimes and es-pecially during the afternoons where the ground heating is maximum. This is consistent with the installation of diur-nal convective boundary layers characterized by the develop-ment of convective turbulence (Heo et al., 2003). The same behaviour is observed in the afternoon of 30 June 2001 (see the left part of Figs. 5e and f where the Mistral is still weak. On the other hand, on 1 July 2001, at STC, the time-height re-gion of enhancedεvalues is only visible around 12:00 UTC (see the right part of Fig. 5e, that is precisely in the period during which the Mistral wind temporarily weakens (see the right part of Fig. 5a, while the “lift up” and the eastward near-surface direction shift are not observed. This suggests that, in summer, a relatively strong Mistral case (a moderate case if compared to mid-season and winter cases) can perturbed the installation of both convective turbulence and sea-breeze circulation.
For the two summer cases, significantly higher εvalues are observed above AIX (Figs. 4f and 5f) than above STC (Figs. 4e and 5e). This could be explained by the proximity of the sea (the Berre pond, see Fig. 1), in the STC case, which
makes the surface temperature cooler than in the AIX case where the radar is installed 20 km inland.
It should be noticed that ε maximum values around 30 10−4m2s−3and 70 10−4m2s−3are found for the summer cases at STC (Figs. 4e and 5e) and AIX (Figs. 4f and 5f), re-spectively. Those maximum values are consistent with those, within the 30–40 10−4m2 s−3 range, obtained by Jacoby-Koaly et al. (2002), using UHF profiler and in-situ aircraft data, for typical summer anticyclonic situations (no wind cases) and above a very large and flat terrain (the Beauce plain in central France).
Theεmaximum values between 40 10−4and 50 10−4m2 s−3found for the autumn case (Figs. 3e and f) proves that the intensity of the turbulence dynamically produced may be of the same order of magnitude as the one produced by convec-tion. Finally, during the summer nights and as for the autumn case, significant dynamically-inducedεvalues could be ex-pected when the Mistral recovers its low-level jet structure. Here, such highεvalues are not obtained probably because the wind shears are not strong enough. Indeed, wind shear values between 8 and 18 m s−1/km are found instead of the 20 to 38 ms−1/km previously mentioned.
5 Summary and concluding remarks
Some mesoscale and seasonal aspects of the Mistral in coastal area have been investigated thanks to UHF profiler data. In addition to the already analysed classical horizontal wind values, vertical velocity and turbulent parameter (the turbulent dissipation rateε) values are presented and inter-preted here for the first time in Mistral situations.
In autumn, when the ground is cool, the Mistral has a syn-optically and orographically forced low-level jet structure. The wind speed can be strong, the depth strongly depends on the upstream conditions and on the observation sites (wind fields observed above two places 90 km apart may be very different) and the air masses are globally subsident when they approach the sea, as expected from a cold and dry wind regime in a stable ABL. In these non-convective cases the turbulence is of pure dynamic origin and can be due to the permanent wind shears or, in some occasion, to mountain/lee wave breaking which can occur over the lateral mountainous sides of the Rhˆone valley.
stabilized. During nighttimes, because of the ground cooling, the Mistral recovers its low-level jet structure.
In addition to the above mentioned low-tropospheric/ABL physics, our results show that the vertical velocity at lower levels and the turbulent dissipation rate can be reliably mea-sured and estimated from UHF wind profilers. Indeed, our experimental values are consistent with both our Mistral ba-sic knowledge and the already analysed horizontal wind mea-surements. Future works will consist of further developments in the technique of turbulent dissipation rate estimation by UHF profiler in dynamically perturbed situations and of com-parisons of such a radar-derived parameter with mesoscale model simulations.
Acknowledgements. The CNRS, the INSU/PATOM, the INSU/PNCA, M´et´eo-France, Ets. Degr´eane, and EDF are gratefully acknowledged for their financial and/or logistical supports. The authors are also thankful for the efforts made by the number of international committees, working groups and staffs during the MAP and ESCOMPTE Special Observing Periods.
Topical Editor O. Boucher thanks M. Teshiba and another referee for their help in evaluating this paper.
References
Angevine, W. M.: Errors in mean vertical velocities measured by boundary layer wind profilers, J. Atmos. Oceanic Technol., 14, 565–569, 1997.
Blondin, C. and Bret, B.: Numerical study of the Mistral with a mesoscale model. Scientific results of the Alpine experiment (ALPEX), GARP Publication Series, WMO/TD, 549–563, 1986. Bougeault, P., Binder, P., Buzzi, A., Dirks, R., Houze, R., Kuettner, J., Smith, R. B., Steinacker, R., and Volkert, H.: The MAP Spe-cial Observing Period, Bull. Amer. Meteor. Soc., 82, 433–462, 2001.
Caccia, J.-L., Aubagnac, J.-P., B´ethenod, G., Bourdier, C., Bruzzese, E., Campistron, B., Candusso, J.-P., Ch´erel, G., Claey-man, J.-P., Conrad, J.-L., Cordesses, R., Currier, P., Derrien, S., Despaux, G., Dole, J., Durbe, R., Fournet-Fayard, J., Frappier, A., Ghio, F., Girard-Ardhuin, F., Jacoby-Koaly, S., Klaus, V., Ney, R., Pag`es, J.-P., Petitdidier, M., Pointin, Y., Richard, E., Seloyan, I., Sma¨ıni L., and Wilson, R.: The French ST-radar net-work during MAP: observational and scientific aspects, Meteor. Zeit., 10, 469–478, 2001.
Corsmeier, U., Behrent, R., Drobinski, P., and Kottmeier, C.: The Mistral and its effect on air pollution transport and vertical mix-ing, Atmos. Res., in press, 2004.
Cros, B., Durand, P., Cachier, H., Drobinski, P., Fr´ejafon, E., Kottmeier, C., Perros, P. E., Peuch, V. H., Ponche, J. L., Robin, D., Sa¨ıd, F., Toupance, G., and Wortham, H.: The ESCOMPTE Program: An overview, Atmos. Res., 69, 241–279, 2004. Drobinski, P., Gu´enard, V., Dabas, A. M., Bastin, S., Caccia,
J-L., Campistron, B., Delville, P., Reitebuch, O., and Werner, C.: Combined observations by airborne Doppler lidar and UHF-wind profilers of the 28 June 2001 Mistral event during the ES-COMPTE field experiment, 6th Int. Symp. on Tropospheric Pro-filing : needs and technologies, Leipzig, Germany, 2003. Druilhet, A., Benech, B., Caccia, J-L., Richard, E., Campistron, B.,
Flamant, C., Lothon, M., Sa¨ıd, F., Caminade, C., and Gu´enard, V.: Experimental and numerical analysis of a Mistral case
dur-ing MAP experiment in relation with the PV banner observation, 10th AMS Conf. on Mountain Meteorology, Park City, Utah, USA, 2002.
Ecklund, W. L., Carter, D. A., and Balsley, B. B.: A UHF wind pro-filer for the boundary layer: brief description and initial results, J. Atmos. Oceanic Technol., 5, 432–441,1988.
Fritts, D. C., Andreassen, J. R., and Isler, J. R.: Gravity wave break-ing in two and three dimensions 2. Three-dimensional evolution and instability structure, J. Geophys. Res., 99, 8109–8123, 1994. Gage, K. S., Williams, C. R., and Ecklund, W. L.: UHF wind pro-filer: A new tool for diagnosing tropical convective clouds sys-tems, Bull. Am. Meteorol. Soc., 75, 2289–2294, 1994.
Gu´enard, V., Caccia, J-L., Campistron, B., and Drobinski, P.: UHF-radar investigations of low-tropospheric mesoscale dynamical processes, 2nd European Conf. on Radar Meteorology, Delft, The Netherlands, 428–432, 2002.
Gu´enard, V., Drobinski, P., Caccia, J-L., Campistron, B., and B´enech, B.: An observational study of the Mistral mesoscale dy-namics, Bound.-Layer Meteor., accepted, 2004.
Heo, B. H., Jacoby-Koaly, S., Kiung-Eak, K., Campistron, B., B´enech, B., and Eun-Sil, J.: Use of the Doppler spectral width to improve the estimation of the convective boundary layer height from UHF wind profiler observations, J. Atmos. Oceanic Tech-nol., 20, 408–424, 2003.
Jacoby-Koaly, S., Campistron, B., Bernard, S., B´enech, B., Ardhuin-Girard, F., Dessens, J., Dupont, E., and Carissimo, B.: Turbulent dissipation rate in the boundary layer via UHF wind profiler Doppler spectral width measurements, Bound.-Layer Meteor., 103, 361–389, 2002.
Jiang, Q., Smith, R. B., and Doyle, J. D.: The nature of the Mistral: observations and modelling of two MAP events, Quart. J. Roy. Meteor. Soc., 129, 857–876, 2003.
Lafore, J.-P., Stein, J., Ascensio, N., Bougeault, P., Ducrocq, V., Duron, J., Fisher, C., H´ereil, C., Mascart, P., Pinty, J.-P., Richard, E., and Vila-Guerau, J.: The Meso-NH atmospheric simulation system. Part I: Adiabatic formulation and control simulations, Ann. Geophys., 16, 90–109, 1998.
Lothon, M., Campistron, B., Jacoby-Koaly, S., B´enech, B., Lohou, F., Girard-Ardhuin, F., and Druilhet, A.: Comparison of radar re-flectivity and vertical velocity observed with a scannable C-band Doppler radar and two UHF profilers in the lower troposphere, J. Atmos. Oceanic Technol., 19, 899–910, 2002.
Lothon, M., Campistron, B., Jacoby-Koaly, S., B´enech, B., Lo-hou, F., Girard-Ardhuin, F., and Druilhet, A.: Reply to the com-ment on ‘Comparison of radar reflectivity and vertical velocity observed with a scannable C-band Doppler radar and two UHF profilers in the lower troposphere’, J. Atmos. Oceanic Technol., 20, 1224–1229, 2003.
Pettr´e, P.: On the problem of violent valley wind, J. Atmos. Sci., 39, 542–554, 1982.
Ralph, F. M., Neiman, P. J., and Levinson, D.: Lidar observations of a breaking mountain wave associated with extreme turbulence, Geophys. Res. Let., 24, 663–666, 1997.
Tafferner, A. and Egger, J.: Test of theories of lee cyclogenesis: ALPEX cases, J. Atmos. Sci., 47, 2417–2428, 1990.
Tennekes, H. and Lumley, J. L.: A first course in turbulence, M.I.T. press, 300, 1972.