THE PROSPECT OF THE ACCESSION OF ROMANIA TO THE
EUROPEAN MONETARY UNION - AN APPROACH IN TERMS OF REAL
CONVERGENCE
LECTURER PHD ANISOARA NICULINA APETRI
Ş
tefan cel Mare University of Suceava, Romania,
Email:
[email protected]
PREP. PHD STUDENT ANA MARIA HLACIUC
Ş
tefan cel Mare University of Suceava, Romania
Email:
[email protected]
,
MASTERAND IRINA NISTOR
Ş
tefan cel Mare University of Suceava, Romania
Email:
[email protected]
Rezumat
Joining the European Monetary Union and adopting the unique currency - euro requires the states to meet a set of real and nominal convergence criteria. Although the real convergence criteria are not mentioned in the Treaty of Maastricht, they planned a major contribution to the success of adopting a common currency by a European Union member state, especially in recording a great relation between benefits and costs. Starting from this consideration, we decided to conduct an assessment of the level of accomplishment of real convergence criteria by Romania in this moment, taking into account a comparative approach in the Euro zone and at the level of non- European Union countries members of the Euro zone, for the real convergence criteria analyzed.
Cuvinte cheie: European Monetary Union, convergence criteria, nominal convergence, real convergence
Clasificare JEL : E 26, E42
1. Introduction
The convergence criteria to the European Monetary Union set out in the Maastricht Treaty represents the economic test for assessing the preparedness of an economy for joining the union. They provide economic objectives that a country must carry out before adopting the euro and the changeover in the euro zone, which are actually targets in inflation, interest rates and exchange rates [6].The Treaty does not suggest a hierarchy of criteria, because they are considered equally important. Potential euro zone members must meet the same criteria that were met by the current members of the euro zone. The macroeconomic indicators used to measure the convergence are presented in the following table:
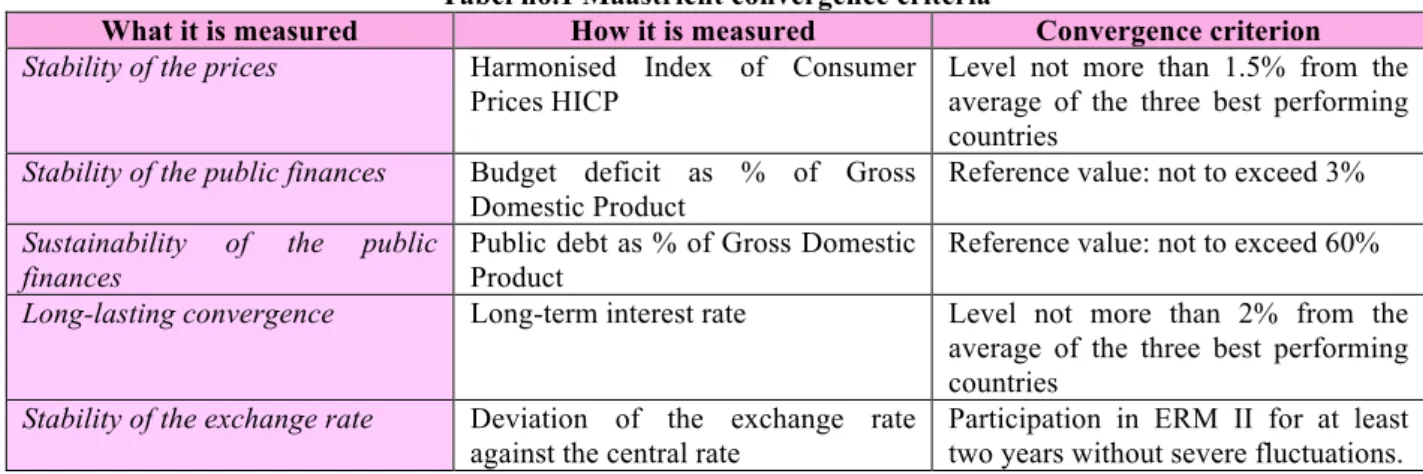
Tabel no.1Maastricht convergence criteria
What it is measured How it is measured Convergence criterion
Stability of the prices Harmonised Index of Consumer Prices HICP
Level not more than 1.5% from the average of the three best performing countries
Stability of the public finances Budget deficit as % of Gross Domestic Product
Reference value: not to exceed 3%
Sustainability of the public finances
Public debt as % of Gross Domestic Product
Reference value: not to exceed 60%
Long-lasting convergence Long-term interest rate Level not more than 2% from the average of the three best performing countries
Stability of the exchange rate Deviation of the exchange rate against the central rate
Participation in ERM II for at least two years without severe fluctuations.
Annals of the „Constantin Brâncuşi” University of Târgu Jiu, Economy Series, Issue 2/2014 convergence. However, in the literature, some authors such as Hen and Leonard (2003) propose four criteria to be considered worthy to measure the results of this process , namely: growth of Gross Domestic Product (within 2% on average of three states which are the most efficient) ; unemployment (up to 3 % around the average of the three countries that are most efficient), the balance of current (2% of Gross Domestic Product), and the amount of competitiveness indicator calculated on Germany (whose variation should not exceed a weight of 10 % compared to the forecast for the euro market entry timing) [5].
According to other authors (Isarescu Mugur, 2004) there are listed a number of other criteria to achieve real convergence analysis such as the openness of the economy (expressed as share of imports and exports in Gross Domestic Product); share of bilateral trade with EU countries in total foreign trade; Gross Domestic Product / capita (which is expressed in purchasing power parity) and the structure of the economy (which is expressed through the share of the gross value added in the main sectors in Gross Domestic Product). These criteria will be particularly analyzed in this study.
Although these real convergence criteria are not mentioned in the Treaty of Maastricht, they planned a major contribution to the success of adopting a common currency by an EU member state, especially recording a great relation between benefits and costs. The single monetary policy, developed by the European Central Bank, addresses a group of homogeneous economies and therefore cannot and need not to cover the characteristics of each economy [3].
2. The analysis of Gross Domestic Product / capita at purchasing power parity
The analysis of real convergence in the Romanian economy starts with identifying indicator called Gross Domestic Product / capita at purchasing power parity. According to estimates by the European Statistical Office (Euro state) 2012 states that had the lowest Gross Domestic Product per capita are Romania and Bulgaria, standing midway average achieved in the other Member States.
Among the other countries that were analyzed in the present study, in terms of nominal convergence criteria, the Czech Republic has a Gross Domestic Product / capita in PPS 15-25% below the EU average, followed by Poland and Hungary that record indicator 30 -40% lower than the EU average, while the last places are Romania and Bulgaria.
In Romania, the Gross Domestic Product per capita in purchasing power standard (PPS) stood at 49% of the EU average in 2012, about the same level that was achieved in the previous year. Thus, Romania was still the second lowest in the EU is ahead of Bulgaria, whose values Gross Domestic Product / capita in PPS is 47% of the EU average1.
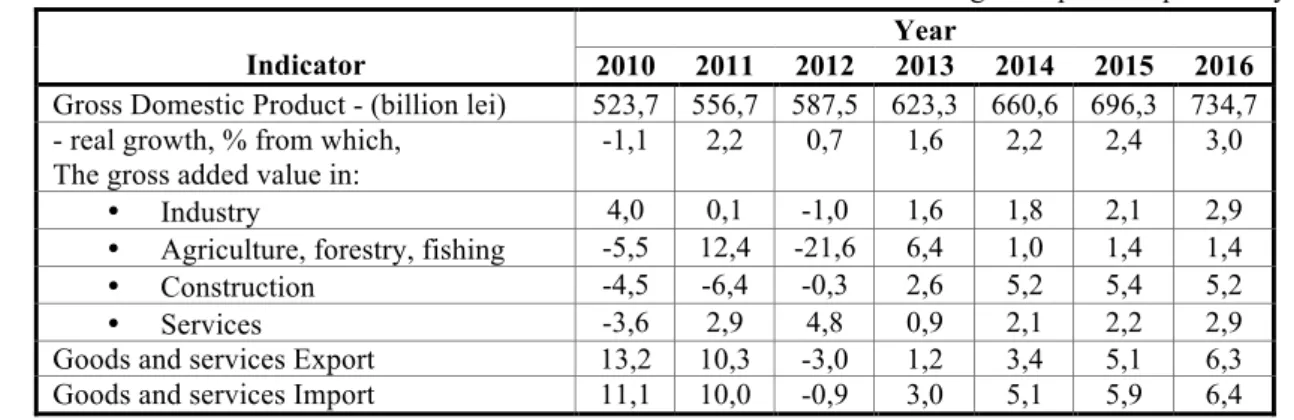
In Romania the Gross Domestic Product registered a steady growth level during 2010 - 2012 of about 523.7 billion to 587.5 billion lei, and according to the forecasts of the National Prognosis Commission (May 2013) this trend will be continued in the next four years, reaching a value domestic product of 700 billion (734.7 billion lei) corresponds to an increase of 3%.
3. The analysis of the evolution of the sectors of the Romanian economy
With regard to the evolution of the Romanian economy sectors, in relation to Gross Domestic Product can be seen from the above table a decrease in gross added value generated by industry in 2011-2012 to -1.0%, due to the bankruptcy of many companies in various fields of industry or the various problems they face at the moment. In the same period there has been a significant reduction in gross added value in agricultural activities, forestry and fishing from year to year (-21.6%).
Table no. 2. The evolution of the Romanian economy sectors, imports and exports, in relation to Gross Domestic Product (2010 - 2016)
- Percent change compared to previous year,% -
Source: National Commission for Prognosis, Mai 2013
1www.finantistii.ro [accessed at 27.06.2013] Indicator
Year
2010 2011 2012 2013 2014 2015 2016 Gross Domestic Product - (billion lei) 523,7 556,7 587,5 623,3 660,6 696,3 734,7 - real growth, % from which,
The gross added value in:
-1,1 2,2 0,7 1,6 2,2 2,4 3,0
• Industry 4,0 0,1 -1,0 1,6 1,8 2,1 2,9
• Agriculture, forestry, fishing -5,5 12,4 -21,6 6,4 1,0 1,4 1,4
• Construction -4,5 -6,4 -0,3 2,6 5,2 5,4 5,2
• Services -3,6 2,9 4,8 0,9 2,1 2,2 2,9
Also, there is a downside, however, declining in construction sector, which in 2010 presented a development index of -4.5% and in 2012 only 0.3% change over the previous year. This may be due to the new neighborhoods that appear in some cities, the establishment in Romania and building a house by the persons who left the country temporarily, but also opening of large shops with its own head offices. Not least are depicted services, which as can be seen from the table, evolved positively over the years. While in 2012 it achieved an index of negative trend compared to the previous period (-3.6%) in 2011 compared to 2010, we can see an overall increase of this sector, and the favorable situation is maintaining for the next year (4.8% in 2012).
Regarding the evolution of these sectors of the Romanian economy during 2010 - 2016, the National Commission for Prognosis predicts a steady growth in the industry from one period to another, and in the service sector, after a reduction in the current year, is also expected that the next three years will be a moderate growth. In the construction sector and agriculture, forestry and fishing situation is not as favorable. The construction will increase during 2013 - 2015 and 2016 from the previous year there will be a slight setback. A more unfavorable situation is present in 2013 in the agriculture sector which is an increase of 6.4% over the previous year, followed by a development index of 1.0% in 2014 and 1.4% in 2015 (is maintained in the next year).
4. The Analysis of imports and exports
The import and export situation of Romania in the period under review, presents many opportunities, as both recorded in the period 2010 - 2016 an average growth rate of 5.21% and 5.8%. After 2010 both activities have grown from the previous period, with 13.2% of exports and 11.1% of imports, and in 2012 both decreased significantly from the previous year, in the period 2013-2016 will be a significant increase. Both show increasing activity to be similar in 2016, but much lower than that of the first year. Imports will overtake exports in Romania, this being due to the acquisition of technology and equipment from other countries to achieve a higher quality activity.
In 2010, net exports 2 had a positive contribution to real Gross Domestic Product growth of 2.1 percent, and the 2016 forecast reflects a slight negative contribution of them -0.1 percent.
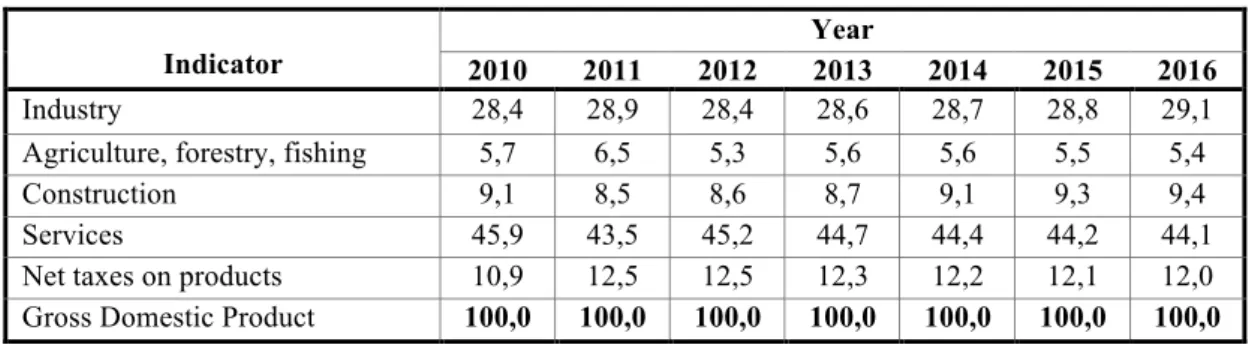
The structure of gross domestic product on sectors reflects the weight of each component contributing to its realization. The sector that holds detached the largest share, with an average of the review period of 44.6% of Gross Domestic Product, is the services sector. Next in the hierarchy is the industry sector with values ranging around 28.7% share of Gross Domestic Product. Other branches participating in the gross added value in Gross Domestic Product are, in order of their influence, the following: net taxes on products (12.1% of Gross Domestic Product), construction (8.9% of Gross Domestic Product) and agriculture, forestry, fishing (5 7% of Gross Domestic Product).
Table no. 3. The structure of gross domestic product by industry (%) from 2010 to 2016
* The structure was calculated on the basis of the nominal value Source: National Commission for Prognosis, Mai 2013
The share of bilateral trade with EU countries in total foreign trade is another indicator of real convergence. In retrospect, we can say that the sum of imports and exports in Romania increased between 2000 and 2004 from 70.7% to 80.9% of GDP, so it is observed that there has been an increase of over 10 percentage points. According to the National Statistics Institute, the bilateral trade with the EU this amount represents approximately 65% in 2005 and 71.3% in 2007
2 Exporturile nete sunt rezultatul diferenţei dintre exporturi şi importuri. Indicator
Year
2010 2011 2012 2013 2014 2015 2016
Industry 28,4 28,9 28,4 28,6 28,7 28,8 29,1
Agriculture, forestry, fishing 5,7 6,5 5,3 5,6 5,6 5,5 5,4
Construction 9,1 8,5 8,6 8,7 9,1 9,3 9,4
Services 45,9 43,5 45,2 44,7 44,4 44,2 44,1
Annals of the „Constantin Brâncuşi” University of Târgu Jiu, Economy Series, Issue 2/2014
Table no. 4. Imports and exports of goods and services in Romania in the period 2010 - 2016 and the openness of the economy
* It is calculated by dividing the value of the current period to the base period [1/0 * 100]
Source: own processing based on data taken from the National Commission for Prognosis report, May 2013
It is easy to note that this is an upward trend, but the share of imports in the total amount surpasses clearly the share of exports, and therefore they can create both medium and long term major macroeconomic imbalances. This fact is directly related to the Romanian exports, which are mainly based on products that have a low degree of processing (for example metal products, furniture, clothing, agricultural products) and this make possible that their value to be lower compared to EU countries, but also to the other states. With regard to the degree of openness indicator, we can say that it is based on the sum of exports and imports to Gross Domestic Product. The retrospective analysis reflects a degree of openness of the economy of Romania about 66% in 2010 and increasing to 75% in 2016, reflecting a significant positive trend.
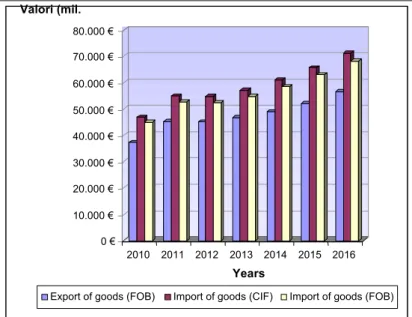
The analysis of the balance of imports and exports of goods and services presents a very unfavorable situation. Both shows negative balances throughout the period subject to study, but the maximum values indicate that the ratio of imports to national level will be reached until 2016. They will be -14 670 million for imports CIF, respectively -11.745 million for imports FOB.
During 2013 - 2016, the shares of exports and imports in Gross Domestic Product will increase Romania's economy becoming extremely open similar to small and medium sized EU countries. However, compared with the EU member states like Hungary, Czech Republic and Bulgaria, the Romanian economy is less open, but has a higher degree of openness than that of Poland. The result of these changes was represented by the modification of the nature of the financial stability of the Romanian economy, as this stability risks have not disappeared [5].
The development of imports and exports of goods and services indicates also a lower share of exports compared to imports, whether FOB or CIF. However, both groups recorded an upward trend of evolution. In 2010 compared to 2009 has been a significant increase in their level, closely followed by development index reported in 2011, the remainder of their progress from year to year, decreasing visible.
Indicator
Year
2010 2011 2012 2013 2014 2015 2016
Export of goods (FOB) - million euro
37.360 45.275 45.056 46.725 48.960 52.140 56.470
- percent change
against the previous year*, (%)
28,5 21,2 -0,5 3,7 4,8 6,5 8,3
Import of goods (CIF) - million euro
46.869 54.948 54.684 57.145 61.055 65.600 71.140
- percent change
against the previous year*, (%)
20,3 17,2 -0,5 4,5 6,8 7,4 8,4
Import of goods (FOB) - million euro
44.937 52.682 52.430 54.790 58.540 62.900 68.215
- percent change
against the previous year*, (%)
25,0 17,2 -0,5 4,5 6,8 7,4 8,4
Trade balance (FOB - CIF)
-9.509 -9.673 -9.628 -10.420 -12.095 -13.460 -14.670
Trade balance (FOB - FOB)
-7.577 -7.407 -7.374 -8.065 -9.580 -10.760 -11.745
Openness of the economy (exp.+imp.)/GDP
Chart no. 1. Imports and exports of goods and services (2010 - 2016) 5. The analysis of the labor productivity
The macroeconomic theory specifies that the productivity growth is one that ensures the success of real convergence. Many studies present the increased convergence index with the European Union on labor productivity growth. This can determine the wage growth, raise the living standards and accelerate the economic growth. According to data provided by Euro state, the EU average difference in labor productivity per person employed in Romania in 2011 was approximately -2 SD, which means a weaker performance than the EU average.
The labor productivity growth should be associated with the increased investment volume, another indicator that helps to determine the level of accomplishment of real convergence. In Romania, while in 2010 we have evolved to this indicator, since next year there is a trend of 0.5%, down slightly in 2012, but currently a significant return to 0, 6 percentage points from the first quarter of the previous year.
Tabel nr. 5. Investments in volume (2010 – sem I from 2013) - Percent change compared to previous year,% -
Ţara
Anul
2010 2011 2012 2013Q1/Q4
Uniunea Europeană (27 ţări) 0,5 0,2 -0,2 -0,1
Zona Euro (17 ţări) 0,4 0,2 -0,3 -0,3
Bulgaria 0,6 0,3 0,2 0,1
Cehia 0,5 0,2 -0,4 -1,3
Ungaria 1 0,3 -0,6 0,7
Polonia 0,7 1,1 0,2 0,1
România - 0,5 0,3 0,6
Source: made by processing data from the Eurostat database
Other countries showing maximum changes in this sample, are Poland which registered an average annual percentage change of 1.1% in 2011 compared to 2010 and Hungary in the first quarter of 2013 show a percentage change of the indicator by 0.1% in May high as that of Romania, then a change of 0.7% from the same quarter of the previous year.
The Index of the hourly cost of labor presents short-term evolution of the total cost on an hourly basis for employers to recruit and hire labor. The index refers to a wide range of market economic activities except the following: agriculture, forestry, fishery, education, health, community, social and personal service activities. Labor costs include gross wages and salaries, employers' social contributions and net taxes of subsidies connected to employment.
0 € 10.000 € 20.000 € 30.000 € 40.000 € 50.000 € 60.000 € 70.000 € 80.000 €
Valori (mil. euro)
2010 2011 2012 2013 2014 2015 2016
Years
Annals of the „Constantin Brâncuşi” University of Târgu Jiu, Economy Series, Issue 2/2014 Tabel nr. 6. The Index of the hourly cost of labor (2010 – sem I from 2013)
- Percent change compared to previous year,% -
Country
Year
2010 2011 2012 2013Q1/Q4
European Union (27 countries) 1,7 2,2 1,6 1,9
EuroZone (17 countries) 1,6 2,1 1,5 1,6
Bulgaria 7,5 7,5 7,5 4,7
Czech 2,3 3,6 3,1 6,1
Hungary -1,7 5,1 4,2 4,9
Poland 1,3 4,6 3,1 3,8
Romania 0,8 4,5 6,6 8,6
Source: made by processing data from the Eurostat database
Looking into the past, in 2010 the five countries analyzed the annual average of this index had a favorable outcome compared with the previous year, except in the case of Hungary in the second quarter as the percentage change of the indicator over the same period of the previous year showed a decrease of -3.5% . This country has also the most impressive comeback in 2011, then rises by 5.1%, while Bulgaria is the only country whose values remain constant, while the cost index in other states are increased. In 2012 there was a rebound in all states except Bulgaria which is maintained at the same level and Romania which experienced a significant expansion of up to 6.6% compared to 2011. During the first quarter of 2013, Bulgaria is the country that even it had maintained the percentage change from one year to another, it decreases in this quarter to 4.7 % against the same period of the last year, but Romania knows the most favorable development up to 8.6 %.
6. Conclusions
The analysis in terms of real convergence criteria shows that the gaps that Romania has to recover are still high, although the dynamics shows that the recovery process takes place at a high enough speed. Due to difficulties in implementing structural reforms in Romania, real convergence had a delayed start.
To improve competitiveness, it is necessary for Romania to meet the challenge of achieving and apply some national strategies and innovation in the industry to have clear and consistent priorities for redirecting resources distributed in various fields to present significant scientific and economic advantages.
The nominal convergence process has the advantage that its objectives can be achieved in a lower frame time, but as the governor of the Romanian National Bank said, the adoption of the euro by Romania before they achieve a minimum of real economic convergence would be risky and potentially counterproductive. In addition, the nominal convergence criteria can have positive and negative on real convergence [4].
Although it is considered that the process of real convergence is not achieved as rapidly as that of nominal convergence to consensus among experts that the high degree of convergence with the European Union is the solution to obtain a favorable integration.
Bibliography:
[1]. Golban Radu, Silaşi Grigore (2009) Eurosystem: an architectural convergence, Economic Publishing House, Bucharest
[2]. Marinescu Cristian (RFPC nr.2/2012) Is there a future for the Euro zone?, Journal of Public Finance and Accountancy
[3]. Moroşan Gheorghe (2009) The impact of the euro on banking business in Romania, Didactic and Pedagogic Publishing House, Bucharest
[4]. Radu Anda-Cristina (2008) 2014 – To be or not to be? Romania's prospects of joining the Economic and Monetary Union, ASE Bucharest
[5]. Socol Aura Gabriela (2009) Macroeconomics European monetary integration - The case of Romania, Economic Publishing House, Bucharest
[6]. Tofan, M., The integration of Romania in the European Monetary Union, C.H.Beck Publishing House, Bucharest 2008
[7]. ***epp.eurostat.ec.europa.eu [8]. ***www.ecb.int