Hemodynamic Effects of Experimental Acute Right Ventricular Overload
Flávio Brito Filho
1; Kleber Nogueira de Campos
1; Humberto Alves de Oliveira
1; Josué Fernandes
1; César Augusto Melo
e Silva
2; Eduardo Gaio
2; Edwin Roger Parra
5; Paulo Henrique Cândido de Carvalho
3, Paulo Manuel Pêgo Fernandes
4 Unidade de Cirurgia Torácica, Hospital de Base do Distrito Federal1; Laboratório de Fisiologia Respiratória Experimental, Faculdade de Medicina da Universidade de Brasília2; Centro de Treinamento e Ensino em Ciências da Saúde - CETREX3, Brasília, DF; Instituto do Coração, Faculdade de Medicina da Universidade de São Paulo4; Departamento de Patologia, Faculdade de Medicina da Universidade de São Paulo5, São Paulo, SP - BrazilMailing address: Flávio Brito Filho •
SQN 309, Bloco K, apt. 503 - Asa Norte - 70755-110 - Brasília, DF - Brazil E-mail: [email protected], [email protected]
Manuscript received July 31, 2010; revised manuscript received October 15, 2010, accepted on October 28, 2010.
Abstract
Background: Acute right ventricular overload is associated with high morbidity and mortality clinical situations such as: extensive lung resection, pulmonary thromboembolism, lung transplantation and high altitude pulmonary edema. Some points of its pathophysiology remain unclear.
Objective: To assess the hemodynamic effects of experimental acute right ventricular overload in pigs.
Methods: Right ventricular overload was induced through the occlusion of the pulmonary arteries using ligationss.
Twenty pigs were used in the study, divided into 04 groups: one control group not subject to pulmonary vascular
occlusion, and three right ventricular overload groups subject to occlusion of the following pulmonary arteries: SVD1
(left pulmonary artery); SVD2 (left pulmonary artery and right lower lobe) and SVD3 (left pulmonary artery, right lower lobe and mediastinal lobe), obstructing the pulmonary vasculature in 42, 76 and 82.0% respectively. Hemodynamic
variables were measured every 15 minutes during one hour of study. The statistical analysis employed mixed linear models with variance and covariance structures.
Results: Group comparisons revealed significant increases in heart rate (p = 0.004), mean pulmonary artery pressure
(p = 0.001) and pulmonary capillary wedge pressure (p < 0.0001). There was no significant difference in cardiac index (p = 0.94).
Conclusion: Despite the severe right ventricular overload promoted by 82.0% obstruction of the pulmonary vasculature
and the significant increase in pulmonary arterial pressure, there was no severe cardiovascular dysfunction and/or
circulatory shock during the study period. (Arq Bras Cardiol 2011;96(4):284-292)
Keywords: Ventricular dysfunction, right; pulmonary embolism; catheterization, Swan-Ganz; swine.
through serial ventricular alignment6. Intense RVO promotes
a strong deviation of the interventricular septum and its thrust to the left side, consequently reducing the left ventricular chamber, reducing their complacency and leading to biventricular dysfunction4. Right ventricular dysfunction is not
only caused by pressure overload, but also by the reduction of myocardial oxygenation, which in this context is caused by two factors: (I) coronary hypoperfusion promoted by reduced cardiac output; and (ii), reduced subendocardial blood flow caused by compression of the right coronary artery due to distention and right ventricular hypertension. Furthermore, reduced myocardial oxygen supply may cause ischemia, and worsened cardiovascular ventricular dysfunction4,7.
The degree of tolerance of the cardiovascular system to acute RVO is still controversial. Regarding pressure levels, some authors8,9 advocate that 40 mmHg is the maximum
pressure level that the right ventricle withstands in the absence of prior heart disease. There is evidence that during intense physical exercise, blood pressure levels in the pulmonary artery (PA) get close to 40 mmHg with no cardiovascular dysfunction1. Hultgren et al10 demonstrated that some patients
Introduction
The study of acute right ventricular overload (RVO) arouses the interest of the scientific community, not only for its clinical relevance, but also for its important biological significance, since the RVO is also present in physiological situations, for example, in the exercise1. In the clinical context, the main
cause of acute RVO is the increase in pulmonary vascular impedance, which occurs in various situations, such as: extensive pulmonary resection2, pulmonary transplantation3,
pulmonary thromboembolism (PTE)4 and high altitude
pulmonary edema5, among others.
with high altitude pulmonary edema present PA pressure levels above 50 mmHg. One patient, in this particular study, showed mean pulmonary artery pressure (PAP) close to systemic levels (117 mmHg), with no cardiovascular dysfunction and/ or circulatory shock.
Regarding tolerance of the cardiovascular system to the percentage of pulmonary vascular obstruction, the literature is controversial. Póvoa et al11 report that pulmonary
vascular obstruction above 40.0% promotes hemodynamic instability in PTE. In this same context, Simek et al12 report
that hemodynamic instability occurs with obstruction above 50.0%. In a different context, Hsia et al13 demonstrated that
extensive lung resection can be performed in dogs, though without cardiovascular dysfunction. In the Hsia’s study, 58.0% of the pulmonary parenchyma of animals were resected in one time, and 70.0% sequentially, with an interval of 3-4 weeks. In spite of dealing with different situations, the three examples described above demonstrate that some important hemodynamic effects of acute right ventricular overload remain unclear.
The purpose of this study is to assess such effects systematically, as well as its evolution in a model of acute RVO in pigs.
Methods
RVO model and animals used
RVO in pigs was induced by occlusion of the pulmonary arteries by the method of ligations, after dissection and isolation of its branches. The degree of pulmonary vascular occlusion promoted by the ligationss in different study groups was estimated in a percentage, assuming that the pulmonary vasculature of the pigs and, consequently, blood flow is proportional to the weight of the relevant lobes. The anatomical configuration and the percentage weights of the pulmonary parenchyma of the pigs are shown in Figure 1.
Twenty male Large White pigs weighing in average 21.3 kg ± 0.7 (SEM) were intubated after induction of anesthesia with sodium thiopental (7 mg.kg-¹) and fentanyl (15 μcg.kg-¹)
intravenously in bolus and undergoing mechanical ventilation (VT 10 ml kg-¹, PEEP 5 cmH
2O and FR 25 ipm and FiO2 of
100.0%). Anesthesia was maintained by continuous venous infusion of fentanyl (20-40 μcg.kg-1h-¹) associated with sodium
thiopental (7-14 mg.kg-¹.h-¹), served in saline solution at
0.9%, and pancuronium (0.3 mg.kg-¹) in bolus. Then the
animals underwent trans-sternal bilateral thoracotomy with dissection and repair of the pulmonary arteries, and randomly allocated into four groups (n = 5), including one control group (C) and three right ventricular overload groups (SVD1, SVD2, and SVD3). Group C was not submitted to pulmonary vascular occlusion. The right ventricular overload groups were submitted to occlusion of the following pulmonary arteries: SVD1 (left pulmonary artery); SVD2 (left pulmonary artery and right lower lobe) and SVD3 (left pulmonary artery, right lower lobe and mediastinal lobe), obstructing the pulmonary vasculature in 42, 76 and 82.0% respectively (Figure 2).
All animals were handled in accordance with the standards established in the Guide for the Care and Use of Laboratory
Animals” (Institute of Laboratory Animal Resources, National Academy of Sciences, Washington, D. C. 1996) and the Ethical Principles for Animal Experiments of the Colégio Brasileiro de Experimentação Animal (COBEA) were duly followed. The study was approved by the Ethics Committee on Animal Experiments of the Universidade de Brasília, Brazil.
Experimental design
Data collection was performed in 05 times at intervals of 15 minutes, totaling one hour of study, as shown in Figure 3.
Variables
Mean arterial pressure (MAP), mean pulmonary artery pressure (PAP), pulmonary capillary wedge pressure (PCWP) and central venous pressure (CVP)
The MAP was obtained by catheterization of the right femoral artery, the catheter being connected to a pressure transducer and to the multiparameter heart monitor (Dixtal DX 2010™, Manaus, Amazonas, Brazil). The PAP and CVP were measured by the pulmonary artery catheter (Edwards™131HF7, Irvine, CA, USA) connected to the said monitor. The PCWP was measured by the occlusion method by inflation of the balloon located at the distal end of the pulmonary artery catheter.
Heart rate (HR), cardiac output (CO), cardiac index (CI) and systolic index (SI)
The HR was obtained by the multiparameter monitor and pulse oximeter attached to the left ear of the animal. CO was obtained by thermodilution and calculated by the multiparameter monitor through Stewart-Hamilton modified
Figure 1 -Schematic representation of the anatomical coniguration and
equation. CI was calculated through the above monitor from the division of the CO values by the animal’s body surface. The body surface area (BS) of the pigs was obtained by the following formula14:
SC = K.p2/3
K = Constant equal to 0.09 for animals over 4 kg p = Animal weight in kilograms
The SI was obtained indirectly by dividing the cardiac index by the heart rate.
Statistical analysis
The variables were analyzed according to their distribution through Shapiro Wilk’s test for normality. The homogeneity of variances among groups was assessed by the Levene test. The statistical analysis employed mixed linear models with variance and covariance structures. Calculations were performed with the SPSS (Statistical Package for the Social
Sciences) version 13.0 for Windows. All data are presented as a mean ( ) ± standard error (SE), and an arbitrary value of α = 0.05 is adopted.
Results
The MAP did not change significantly over the study (p = 0.27). In group comparisons, the MAP in SVD3 was significantly lower than in SVD1 (p = 0.03) (Figure 4-A).
The CVP increased significantly over the study in the SVD3 group (p = 0.01). However, comparisons of intergroup CVPs revealed no significant differences (p = 0.07) (Figure 4-B).
The PAP increased significantly over the study in the SVD2 and SVD3 groups (p < 0.01). In intergroup comparisons, the PAP in SVD3 was significantly higher than in C and SVD1, p-value of 0.001 and 0.02, respectively (Figure 5-A).
The PCWP, similary to the PAP, increased significantly over the study in the SVD2 and SVD3 groups (p < 0.01). In Figure 2 -Schematic representation of the study groups. Striped areas: pulmonary lobes with connected arteries. Blank areas: absence of vascular ligation.
GROUP SVD3 VASCULAR OCCLUSION OF 82% GROUP C
NO VASCULAR OCCLUSION
GROUP SVD1 VASCULAR OCCLUSION OF 42%
Figure 3 -Schematic representation of the experimental design. T0: immediately preceding vascular ligations; T15: ifteen minutes after vascular ligation; T30: thirty
minutes after vascular ligations; T45: forty-ive minutes after vascular ligations; and T60: sixty minutes after vascular ligations.
Collection of hemodynamic data VASCULAR
LIGATIONS
ANESTHESIA
SURGERY PROCEDURES
SACRIFICE
intergroup comparisons, the PCWP in SVD3 was significantly higher than in C and SVD1, with p-value of 0.001 and 0.02 in both comparisons (Figure 5-B).
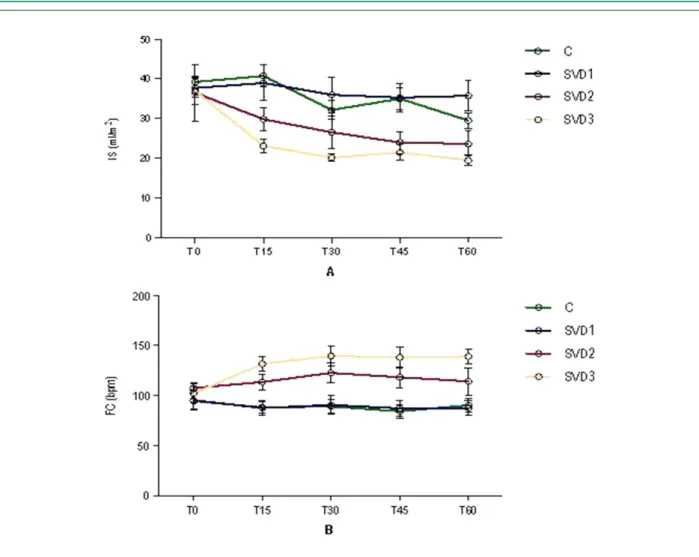
The SI reduced significantly over the study in the C, SVD2 and SVD3 groups (p = 0.01). In intergroup comparisons, the SI in SVD3 was significantly higher than in C and SVD1, with p-value of 0.001 and 0.02, respectively (Figure 6-A).
The HR was stable in the groups C and SVD1 and increased significantly in the groups SVD2 and SVD3 over the study (p < 0.04). In intergroup comparisons, the HR in SVD3 was significantly higher than in C and SVD1, with p-value of 0.001 and 0.02 in both comparisons (Figure 6-B).
The IC showed a similar reduction in all of the 04 groups throughout the study (p = 0.005). Despite the high pulmonary vascular occlusion in groups and SVD2 and SVD3, the CI showed no significant differences in intergroup comparisons, with p-value of 0.94 (Figure 7).
Discussion
The SVD is characterized by an increased volume and/or pressure load imposed on the right ventricle15. The SVD is
present in physical exercise and in various clinical situations such as: extensive lung resection, lung transplantation, pulmonary thromboembolism (PTE) and high altitude pulmonary edema. The SVD can cause hemodynamic instability, depending on its intensity and previous cardiovascular status of patients4,6.
In this study, the degree of pulmonary vascular occlusion was estimated by the weight of the lung parenchyma subjected to ligations, by assuming that the pulmonary vasculature and, consequently, blood flow is proportional to the weight percentage of the respective lobes. Similarly, in animals, the weight of the lung parenchyma has been used previously as a method to quantify the pulmonary volume16. Regarding the regional
distribution of the pulmonary blood flow, it was demonstrated that the pulmonary vascular structure is the most important one17. Therefore, the heaviest pulmonary lobes probably have a
higher percentage of vasculature and thus increased blood flow in relation to lighter pulmonary lobes. However, it should be noted that the quantification of the pulmonary vascular occlusion percentage used in this study is only an estimate, rather than a direct measure, and may be inaccurate.
In this study, the SI tended to decrease throughout the study, but it revealed greater intensity in groups SVD2 and
Figure 6 -Systolic index (A) and heart rate (B) in the 04 study groups. Data expressed as ± EP.
SVD3, being significantly lower in SVD3 when compared to groups C and SVD1. This result indicates that in groups of larger SVD, there was a decrease in systolic volume that can be explained by the lower left ventricular filling. In RVO situations, a lower left ventricular filling can occur due to two factors. The first results from reduced right ventricular systolic volume caused by afterload increase as a result of increased pulmonary vascular impedance due to vascular occlusions, that is, serial ventricular alignment6,7. The second
factor is due to reduced left ventricular complacence caused by interventricular septal deviation, which occurs in large right ventricular dilations during sudden afterload increases (mechanism of interdependence of the heart chambers)18,19.
In this study, we have no images of the ventricular chambers to confirm this hypothesis. We also observed a significant increase in HR in groups SVD2 and SVD3 throughout the study, but the HR in the group SVD3 was significantly higher than in groups C and SVD1.
The CI showed a similar reduction in all groups throughout the study without significant differences in intergroup comparisons. A similar reduction of the CI in the various study groups, including in the control group, was not an expected finding, and that indicates that the reduced CI in the different groups cannot be solely attributed to the RVO. It is possible that in this study the reduced CI can be attributed, at least in part, to the myocardial depression promoted by anesthetics, especially barbiturates that depress the cardiovascular system by two mechanisms: the first, through the direct negative inotropic effect; the second, through the sympathetic nervous system20,21. The fact that there was no intergroup differences
in the intergroup CI indicates that the intensity of the RVO, even the most extreme one in the group SVD3 (with 82.0% of pulmonary vascular occlusion), did not severely affect the cardiac function. If the effect existed, it was so subtle that it has not generated significant differences between the groups. Despite the magnitude of the pulmonary vascular occlusion in groups SVD2 and SVD3, the CVP showed a significant tendency to increase only in the group SVD3. However, in intergroup comparisons, there were no significant differences. This finding indicates that the increased pulmonary vascular impedance, capable of promoting an increase in the right ventricular pressure, occurred only in extreme degrees of occlusion of the pulmonary vasculature, revealing a considerable tolerance of the right ventricle to acute occlusion of the pulmonary vascular bed.
According to Wood et al6, during acute PTE in patients
without prior cardiopulmonary disease, there is a right atrial pressure increase with pulmonary vascular occlusion around 40.0%. In contrast, in this study, increased right atrial pressure and CVP was observed only in the group SVD3, whose pulmonary vascular occlusion was at 82.0%. According to other authors11,12,22, the PTE with vascular occlusion above
30 to 50.0% promotes cardiovascular dysfunction and hemodynamic instability. However, in this study, there was no cardiovascular dysfunction or significant hemodynamic instability, even with 82.0% of pulmonary vascular occlusion in the group SVD3. However, it should be noted that in patients with acute PTE, increased pulmonary vascular impedance does
not occur just by the obstructive factor. Also, there are the effects of humoral factors derived from platelets, released by the emboli, which promote reflex pulmonary vasoconstriction and contribute significantly to the increase in pulmonary vascular impedance.
As expected, PAP and PCWP increased significantly in the groups SVD2 and SVD3 after vascular ligation. In intergroup comparisons, this finding was confirmed, with PAP and PCWP significantly higher in the group SVD3 than in the groups C and SVD1. These results can be attributed to hyperflow in the pulmonary microvasculature1,5,23.
A relevant question concerns the location or segment of the pulmonary microvasculature in which there is increased impedance in situations of hyperflow. It is known that the flow overhead reduces the resistance in the arterial portion of the pulmonary microvasculature, through recruitment and distensibility of their capillary vessels24,25. In the venous
portion of the pulmonary microvasculature, such adaptive capacity may be limited and may be a significant site of generation of impedance in the pulmonary vasculature as suggested by Hultgren5. The findings of Younes et al23, in turn,
reveal that during the experimental pulmonary hyperflow, the pressure gradient between the left atrium and the pulmonary capillaries increases significantly with increased flow, revealing that increased flow induces a significantly increased resistance in the venous segment of the pulmonary vasculature. These findings are corroborated by the studies of Hyman26, which showed that during the hyperflow, the
pulmonary veins of small caliper (2 mm) show a significant pressure increase due to the increased flow, without left atrial hypertension.
It is possible that in this study, increased blood pressure in the arterial segment of the pulmonary vasculature has occurred when the recruitment capacity of the pulmonary capillaries was exceeded and that, for the reason described above, this pressure increase was not passed through to the venous segment of a greater caliper. In this study, measurement of pulmonary artery occlusion pressure should be interpreted with caution as it may solely reflect the PCWP values. Younes et al23 and Bshouty et al27 also demonstrated that, in situations
of hyperflow, the pulmonary artery occlusion pressure values are much closer to those values of the arterial component than to the venous values. Other authors5,24 also showed that during
the experimental hyperflow there was no increase in the left atrial pressure despite the significant increase in pulmonary arterial pressure. Therefore, in this study and in situations of hyperflow, pulmonary artery occlusion pressure predominantly estimates the pulmonary capillary pressure values and cannot be used as an estimate of left atrial pressure.
As for the degree of right ventricular tolerance and sudden increase in pulmonary vascular pressure, Baruzzi et al8
and McIntyre et al9 report that the right ventricle is unable
circulatory shock, possibly observed in situations of acute obstruction of the pulmonary vascular bed.
Conclusion
In this study, increased CVP indicating increased right ventricular pressure was observed only in the utmost degree of pulmonary vascular occlusion (82.0%). Despite intense RVO, promoted by the pulmonary vascular occlusion of 82.0%, and significant increase of PAP, there was no significant cardiovascular dysfunction and/or circulatory shock during the period studied. The findings of this study show a surprising tolerance of the cardiovascular system to acute RVO over one hour in the model used.
Potential Conflict of Interest
No potential conflict of interest relevant to this article was reported.
Sources of Funding
There were no external funding sources for this study.
Study Association
This article is part of the thesis of doctoral submitted by Flávio Brito Filho, from Instituto do Coração - Faculdade de Medicina da Universidade de São Paulo.
References
1. Wagner PD, Gale GE, Moon RE, Torre-Bueno JR, Stolp BW, Saltzman HA. Pulmonary gas exchange in humans exercising at a sea level and simulated altitude. J Appl Physiol. 1986;61(1):260-70.
2. Waller DA, Keavey P, Woodfine L, Dark JH. Pulmonary endothelial permeability changes after major lung resection. Ann Thorac Surg . 1996;61(5):1435-40.
3. Della Rocca G, Coccia C. Nitric oxide in thoracic surgery. Minerva Anestesiol. 2005;71(6):313-8.
4. Kreit JW. The impact of right ventricular dysfunction on the prognosis and therapy of normotensive patients with pulmonary embolism. Chest. 2004;125(4):1539-45.
5. Hultgren HN. High-altitude pulmonary edema: current concepts. Annu Rev Med. 1996;47:267-84.
6. Wood KE. Major pulmonary embolism: review of a pathophysiologic approach to the golden hour of hemodynamically significant pulmonary embolism. Chest. 2002;121(3):877-905.
7. Goldhaber SZ, Elliott CG. Acute pulmonary embolism: part I. Epidemiology, pathophysiology and diagnosis. Circulation. 2003;108(22):2726-9.
8. Baruzzi ACA, Knobel M, Knobel E. Right ventricle in pulmonary hypertension. Rev Soc Cardiol Estado de São Paulo. 2000;5:636-9.
9. McIntyre KM, Sasahara AA. Determinants of right ventricular function and hemodynamics after pulmonary embolism. Chest. 1974;65(5):534-43.
10. Hultgren HN, Lopez CE, Lundberg E, Miller H. Physiologic studies of pulmonary edema at high altitude. Circulation. 1964;29:393-408.
11. Póvoa R, Kasinski N. Pulmonary hypertension in pulmonary tromboembolism. Rev Soc Cardiol Estado de São Paulo. 2000;5:590-8.
12. Simek M, Nemec P, Cermak M, Prikrylová K. Intraoperative massive pulmonary embolism during coronary artery bypass grafting. Interact CardioVasc Thorac Surg. 2005;4(4):283-4.
13. Hsia CCW, Dane DM, Estrera AS, Wagner HE, Wagner PD, Johnson Jr RL. Shifting sources of functional limitation following extensive (70%) lung resection. J Appl Physiol. 2008;104(4):1060-79.
14. Otsuki DA. Hemodiluição normovolêmica aguda: estudo experimental comparativo utilizando amido hidroxietílico a 6% ou solução de Ringer
lactato [tese]. São Paulo: Faculdade de Medicina Veterinária e Zootecnia. Universidade de São Paulo; 2004.
15. Santamore WP, Gray L Jr. Significant left ventricular contributions to right ventricular systolic function. Mechanism and clinical implications. Chest. 1995;107(4):1134-45.
16. Fusco LB, Fonseca MH, Pêgo-Fernandes PM, Pazetti R, Capelozzi V, Jatene FB, et al. Cirurgia de redução do volume pulmonar em modelo experimental de enfisema em ratos. J Bras Pneumol. 2005;31(1):34-40.
17. Hlastala MP, Glenny RW. Vascular structure determines pulmonary blood flow distribution. News Physiol Sci. 1999;14:182-6.
18. Dell’Italia LJ, Pearce DJ, Blackwell GG, Singleton HR, Bishop SP, Pohost GM. Right and left ventricular volumes and function after acute pulmonary hypertension in intact dogs. J Appl Physiol. 1995;78(6):2320-7.
19. Belenkie I, Dani R, Smith ER, Tyberg JV. Ventricular interaction during experimental acute pulmonary embolism. Circulation. 1988;78(3):761-8.
20. Neukirchen M, Kienbaum P. Sympathetic nervous system: evaluation and importance for clinical general anesthesia. Anesthesiology. 2008;109(6):1113-31.
21. Wada RD, Harashima H, Ebling WF, Osaki EWAS, Stanski DR. Effects of thiopental on regional blood flows in the rat. Anesthesiology. 1996;84(3):596-604.
22. Ocak I, Fuhrman C. CT angiography findings of the left atrium and the right ventricle in patients with massive pulmonary embolism. AJR.Am J Roentgenol. 2008;191(4):1072-6.
23. Younes M, Bshouty Z, Ali J. Longitudinal distribution of pulmonary vascular resistance with very high pulmonary blood flow. J App Physiol. 1987;62(1):344-58.
24. Nagasaka Y, Ishigaki M, Okazaki H, Huang J, Matsuda M, Noguchi T, et al. Effect of pulmonary blood flow on microvascular pressure profile determined by micropuncture in perfused cat lungs. J Appl Physiol. 1994;77(4):1834-9.
25. Levitzky MG. Pulmonary physiology. 6th ed. New York: McGraw-Hill; 2003.
26. Hyman AL. Effects of large increases in pulmonary blood flow on pulmonary venous pressure. J Appl Physiol. 1969;27(2):179-85.