Arq Bras Cardiol 2001; 76: 449-52.
Funchs et al Prevalence of systemic hypertension
4 4 9
Hospital de Clínicas de Porto Alegre - Faculdade de Medicina da UFRGS Mailing address: Sandra Costa Fuchs - Rua Ramiro Barcelos, 2600 - S/415 - 90035-003 - Porto Alegre, RS, Brazil
English version by Stela Maris C. Gandour
Objective - To compare the prevalence of systemic
hy-pertension in two different populations: a representative sample of the adult urban population of Porto Alegre, and individuals who sought blood pressure measurement in a hypertension prevention and control campaign.
Methods - A cross-sectional study was carried out
in-volving a representative sample of the adult urban popu-lation of Porto Alegre and a popupopu-lation sample obtained from a hypertension prevention and control campaign, which included all the individuals who sought the blood pressure assessment unit at the Hospital das Clínicas in Porto Alegre. The following parameters were investiga-ted: history of hypertension, use of antihypertensive drugs, age, and sex. Adjustments for age and sex in the prevalence rates were performed to make them comparable.
Results - Hypertension prevalence, defined as values ≥160/95mmHg or treatment with antihypertensive drugs, was higher in the campaign sample (42%) as compared with the population sample (24%). Among those who were aware of their hypertensive condition and were under medication, 54% of the campaign sample and 62% of the representative population sample maintained their pressure levels <160/90mmHg.
Conclusion - Prevalence rates of hypertension differed
a lot in the campaign sample and in the representative po-pulation sample, showing that the sampling criterion may influence assessment of risk factors and bias the associa-tion between risk factors and health aggravaassocia-tions.
Key words: hypertension, sampling, prevalence
Arq Bras Cardiol, volume 76 (nº 6), 449-52, 2001
Sandra Costa Fuchs, Juliano G. Petter, Melissa C. Accordi, Vanessa L. Zen, Antônio D. Pizzol-Jr, Leila Beltrami Moreira, Flávio Danni Fuchs
Porto Alegre, RS - Brazil
Establishing the Prevalence of Hypertension. Influence of
Sampling Criteria
Original Article
Risk quantification in medicine is based on epidemiolo-gical investigations performed in samples of individuals, out of which data for the whole population are inferred. This approach is justified because rarely can the whole popu-lation be studied, but it requires an appropriate sample to provide reliable results. In the clinical practice, availability of patients in hospitals and referral services often cons-titutes the sample by demand of patients or volunteers. Campaigns of disease prevention and detection are exam-ples of samexam-ples of self-selected participants, who do not have a known probability of being included in the study.
However, more than theoretical, this question has a practical aspect, as is shown with the example of systemic hypertension. The high prevalence of hypertension in Brazil (between 14% and 32%) 1-5 and its potential for
control turn hypertension into the most important chan-geable risk factor for cardiovascular disease 6. In the United
States, data from the American Heart Association for 1997 estimated that the cost of attending and treating hyper-tensive patients was US$ 21.8 billion. When adding reduc-tion in productivity due to morbidity and mortality caused by hypertension, these costs were elevated by US$ 8.2 billion 7. These data show the magnitude of the error if
preventive programs are based on estimates originating from nonrepresentative samples of the population.
In our study, we compared the prevalence of hyper-tension assessed in a hyperhyper-tension prevention and control campaign with the prevalence obtained in the investigation of a representative sample of the same population of origin.
Methods
4 5 0
Funchs et al
Prevalence of systemic hypertension
Arq Bras Cardiol 2001; 76: 449-52.
Geografia e Estatística (IBGE – Brazilian Institute of Geo-graphy and Statistics). The individuals who should be included in each borough were randomly picked, and their number was proportional to the size of the borough. The census sectors of each borough were listed and the conglo-merates taking part in the study were randomly picked. Each census sector was visited to check the distribution of dwellings, presence of hotels, hospitals, headquarters, or commercial facilities. Dwellings were selected in a syste-matic manner, ie, the first dwelling was randomly picked and then, following a clockwise direction, one after 10 dwellings was identified. In each dwelling, all individuals ≥18 years of age were considered eligible. The resulting sample com-prised 488 dwellings distributed in 27 census sectors of the IBGE. To calculate the size of the sample, 1 million indivi-duals ≥18 years of age were considered part of the popu-lation; estimating that 14% of this population had high blood pressure levels, with an accuracy of measurement of 2%, we determined that 1,155 individuals should be studied. As this database aimed at testing hypotheses, the sample was enlarged, resulting in 1,174 individuals. Trained inter-viewers gathered information about the participants by applying pretested structured questionnaires in their dwe-llings. Blood pressure levels were measured in a standar-dized manner at the beginning and at the end of the inter-view. The mean of both measurements with correction for the brachial perimeter according to the formulae proposed by Maxwell 8 was considered for analysis.
In another study carried out during the 1999 campaign of hypertension prevention and control, all 249 individuals who sought the blood pressure assessment unit in the Hospital das Clínicas in Porto Alegre were included (campaign sample). This medical unit was located at the entrance of the outpatient care clinics of the Hospital das Clínicas in Porto Alegre. This campaign sample comprised individuals of the general population who accepted the invi-tation that was aired in the media for measuring their blood pressure, along with other individuals who sought the out-patient care clinics of different specialties, their caretakers, and visitors in general. The participants refrained from smo-king and drinsmo-king coffee in the 15-30 minutes preceding the interview, and they remained seated for at least 15 minutes while awaiting blood pressure measurement. The partici-pants were interviewed and underwent blood pressure measurement in a standardized manner by trained perso-nnel. In addition to blood pressure measurement, previous knowledge about hypertension, use of antihypertensive medication, age, and sex were investigated.
In both studies, blood pressure was measured with aneroid manometers, which were periodically calibrated taking mercurial manometers as references according to the Programa Nacional de Educação e Controle da Hipertenção Arterial 9 guidelines (National Program on Education and
Control of Hypertension) and of the Fifth Joint National Committee 10. The first and fifth Korotkoff sounds were
respectively considered the systolic and diastolic blood pressure levels. Systemic hypertension was defined as
systolic blood pressure levels ≥140mmHg or diastolic blood pressure levels ≥90mmHg, or belon this under the use of an-tihypertensive medication. A second classifying criterion was used with systolic blood pressure levels ≥160mmHg or diastolic blood pressure levels ≥95mmHg, or use of medica-tion, in order to reduce the potential for bias in measurement through the phenomenon of regression to the mean. The definition of hypertension was based on the diagnostic classification criteria recommended in the III Consenso Bra-sileiro de Hipertensão Arterial (III Brazilian Consensus on Hypertension) 11. In the analysis of data, we used the
distri-bution by sex and age in the population sample and the pre-valence rates obtained in the campaign sample to calculate the standard prevalence rates through direct standardiza-tion 12. Confidence intervals for the prevalence rates were
calculated based on the formula: P±1.96 √(1-P/N); where P is the prevalence and N is the total number of individuals studied 12. The chi-square test was used to analyze the
statistical significance of the differences in prevalence rates in the 2 samples.
Results
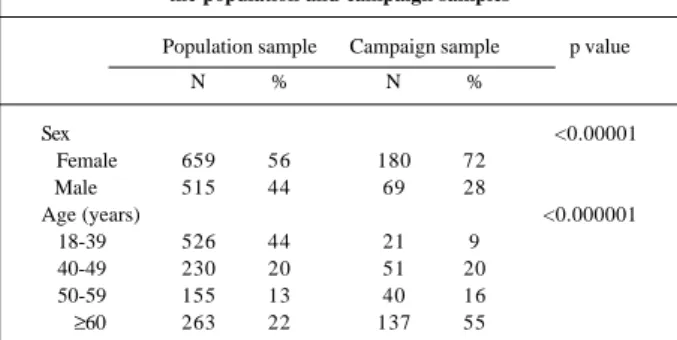
Table I shows the characteristics of the 1,174 partici-pants in the population sample (representative sample) and of the 249 individuals comprising the campaign sample, in which women prevailed (72%). In the representative sample, women accounted for 56% of the individuals. The marked differences in age distribution of the participants included 44% of individuals under the age of 40 years and 22% of the individuals 60 or older than 60 years of age in the represen-tative sample, as compared with 9% and 55%, respectively, in the campaign sample.
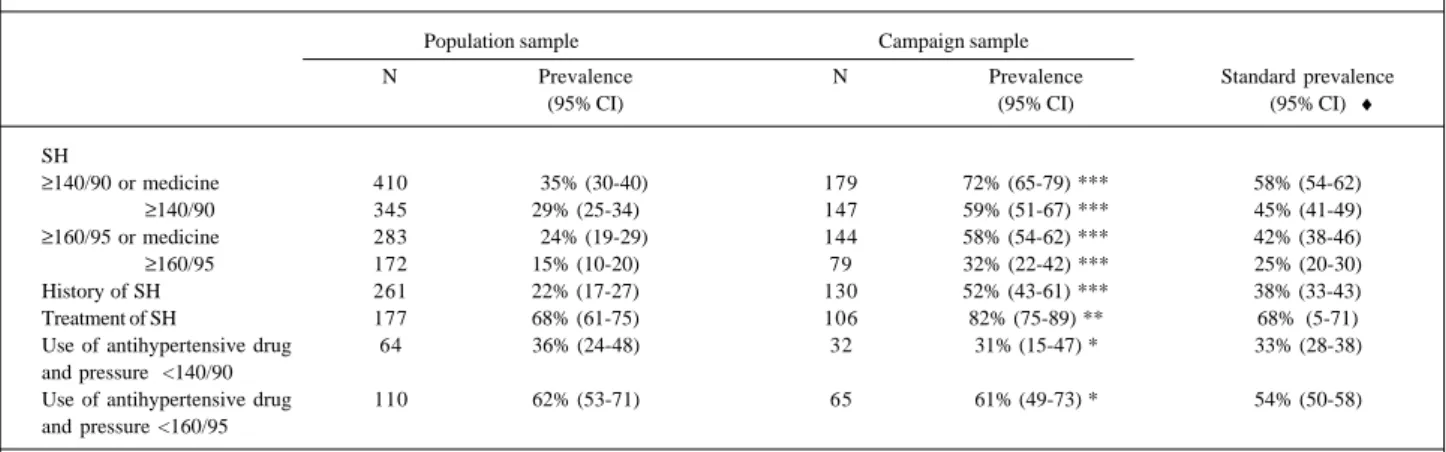
Hypertension prevalence, family history of tension, frequency of treatment, and degree of hyper-tension control are shown in table II. Prevalence of sys-temic hypertension in the campaign sample was appro-ximately two times higher than that in the population sample, independent of the diagnostic criterion used.
Applying the hypertension rates identified in the campaign sample to the distribution according to age and sex in the representative sample, we obtained standardized prevalence rates. Based on this direct standardization, the
Table I – Demographic characteristics of the individuals studied in the population and campaign samples
Population sample Campaign sample p value
N % N %
Sex <0.00001
Female 659 56 180 72
Male 515 44 69 28
Age (years) <0.000001
18-39 526 44 21 9
40-49 230 20 51 20
50-59 155 13 40 16
Arq Bras Cardiol 2001; 76: 449-52.
Funchs et al Prevalence of systemic hypertension
4 5 1
samples became comparable; nevertheless, the prevalences of hypertension remained substantially higher in the campaign sample as compared with those of the represen-tative sample. In the campaign sample, the standardized prevalence of hypertension, defined as blood pressure levels >160/95mmHg, was 25% as compared with 15% in the representative sample. The proportion of individuals with previous knowledge of their hypertensive condition also differed substantially between the samples. On the other hand, the frequency of use of antihypertensive medication was the same (68%) for the participants of both samples.
Considering exclusively the individuals with prior knowledge of their hypertensive condition and using antihypertensive medication in both samples, we identified approximately the same proportion of people with contro-lled blood pressure according to the criterion of 140/ 90mmHg. For the criterion of 160/95mmHg, a slightly higher proportion of individuals was identified in the represen-tative sample.
Discussion
The statistical basis of the test of hypotheses assu-mes that the use of probabilistic samples represents the pulation of origin. In epidemiological studies describing po-pulations, samples are used, and the same principle of representativeness is assumed. However, this assumption is not always realized. The study by Korrick et al 13
inves-tigated a subsample of the Nurses’ Health Study in the area of Boston, Massachusetts in the United States, to test the association between lead exposure and hypertension. The national study included a sample of 121,700 women, but in this substudy, out of the 689 potentially eligible women, only 43% agreed to participate 13.
In our study, we compared the repercussion of the sampling criterion in the inclusion of participants in a study, where one sample was constituted by random selection through multiple stages and the other sample was formed by self-selected individuals, who sought a medical unit for blood
pressure assessment on the national day for hypertension prevention and control. Analyzing the distribution of demographic characteristics, we identified a predominance of women and older individuals in the campaign sample. In another study 14, differences in the distribution by sex and
age between 2 samples, patients of the outpatient care clinic and employees of a department store in New York, were associated with variations in the prevalence rates of hyper-tension and diabetes. The greater number of women increa-ses the prevalence of obesity and sedentary lifestyle and reduces the prevalence of abusive consumption of alcoholic beverages 2. The inclusion of individuals older than 60 years
of age suggests absence of formal work and a higher chance of hypertension 3,5. Availability to seek a medical facility
as-sumes, theoretically, a higher level of health care. In our study, the presence of these characteristics resulted in higher rates of hypertension in the campaign sample than in the re-presentative sample. Comparisons between rere-presentative and nonprobabilistic samples show how bias in selection may distort results, such as increasing the prevalence of hypertension and diabetes 14.
As the prevalence rate is a measure that summarizes the experience of an entire sample and does not discriminate heterogeneity among its members, we performed the direct standardization to make the samples comparable. However, even with standardization, prevalence rates of hyperten-sion were higher in the campaign sample than in the repre-sentative sample. Using blood pressure levels >160/ 95mmHg or antihypertensive medication, the prevalence of hypertension increased from 24% to 42%.
These results show that in the campaign sample we studied a greater proportion of individuals with prior know-ledge of their hypertensive condition. If the participants, in addition to hypertension also had other risk factors, the sampling criterion would not only change the distribution of characteristics of the participants but could also bias the magnitude of associations.
The findings have implications in different contexts of hypertension screening. Certainly, campaign samples lack representativeness to estimate the prevalence of
aggrava-Table II - Prevalence of systemic hypertension and other characteristics according to the type of sample
Population sample Campaign sample
N Prevalence N Prevalence Standard prevalence
(95% CI) (95% CI) (95% CI) ♦
SH
≥140/90 or medicine 410 35% (30-40) 179 72% (65-79) *** 58% (54-62)
≥140/90 345 29% (25-34) 147 59% (51-67) *** 45% (41-49) ≥160/95 or medicine 283 24% (19-29) 144 58% (54-62) *** 42% (38-46) ≥160/95 172 15% (10-20) 79 32% (22-42) *** 25% (20-30)
History of SH 261 22% (17-27) 130 52% (43-61) *** 38% (33-43)
Treatment of SH 177 68% (61-75) 106 82% (75-89) ** 68% (5-71)
Use of antihypertensive drug 64 36% (24-48) 32 31% (15-47) * 33% (28-38) and pressure <140/90
Use of antihypertensive drug 110 62% (53-71) 65 61% (49-73) * 54% (50-58) and pressure <160/95
4 5 2
Funchs et al
Prevalence of systemic hypertension
Arq Bras Cardiol 2001; 76: 449-52.
1. Lolio CA, Pereira JCR, Lotufo PA, Souza JMP. Hipertensão arterial e possíveis fatores de risco. Rev Saúde Pública 1993; 27: 357-62.
2. Duncan BB, Schmidt MI, Polanczyk, Homirich CS, Rosa RS, Achutti AC. Fatores de risco para doenças não-transmissíveis em área metropolitana na região sul do Brasil. Prevalência e simultaneidade. Rev Saúde Pública 1993; 27: 143-8. 3. Fuchs FD, Moreira LB, Moraes RS, Bredmeier M, Cardozo SC. Prevalência de
hipertensão arterial sistêmica e fatores associados na região urbana de Porto Alegre. Estudo de base populacional. Arq Bras Cardiol 1994; 63: 473-9. 4. Bloch KV, KleinCH, Silva NAS, Nogueira AR, Campos LHS. Hipertensão
arterial e obesidade na Ilha do Governador – Rio de Janeiro. Arq Bras Cardiol 1994; 63: 17-22.
5. Piccini RX, Victora CG. Hipertensão arterial sistêmica em área urbana no sul do Brasil: prevalência e fatores de risco. Rev Saúde Pública 1994; 28: 261-7. 6. MacMahon S, Peto R, Cutler J, et al. Blood pressure, stroke, and coronary heart
disease, I: prolonged differences in blood pressure: prospective observational studies corrected for the regression dilution bias. Lancet 1990; 335: 765-74. 7. American Heart Association. Economic cost of cardiovascular diseases. In:
References
tions to health. The actual impact of a campaign as a mean of alerting and screening cases is hardly quantifiable. We observed that the experience in the clinical setting origina-ting from the spontaneous demand of patients is closer to the findings detected in the campaign. Therefore, in this setting, concomitance of health aggravations is more com-mon, leading to a distortion in their actual association. Re-presentative studies lacking selection bias are the only ones capable of accurately measuring the prevalence of risk fac-tors and diseases in communities.
1997 Heart and Stroke Statistical Update. Dallas, TX: American Heart Association, 1997.
8. Maxwell MH, Waks AU, Schroth PC, Karam M, Dornfeld LP. Error in blood pres-sure meapres-surement due to incorrect cuff size in obese patients. Lancet 1982; 2: 33-5. 9. Ministério da Saúde. Normas Técnicas para o Programa Nacional de Educação e Controle da Hipertensão Arterial (PNECHA). Brasília, Centro de Documen-tação do Ministério da Saúde, 1988.
10. Joint National Committee. The fifth report of the Joint National Committee on detection, evaluation, and treatment of high blood pressure. Arch Intern Med 1993; 153: 154-08.
11. III Consenso Brasileiro de Hipertensão. Campos do Jordão (SP): Sociedade Brasileira de Hipertensão, 1998.
12. Kirkwood BR. Essential of Medical Statistics. London, Blackwell Scientific Publications, 1988.
13. Korrick AS, Hunter DJ, Rotnitzky A, Howard h, Speizer F. Lead and hypertension in a sample of midle-age women. Am J Public Health 1999; 89: 330-5. 14. Gerber LM, Wolf AM, Braham RL, Alderman MH. Effects of sample selection on
the coincidence of hypertension and diabetes. JAMA; 1982: 43-6.