A Work Project presented as part of the requirements for the Award of a Masters Degree in Economics from the NOVA - School of Business and Economics.
Institutions and Firm Formation: an Empirical
Analysis of Portuguese Municipalities
Simão Perestrello de Vasconcelos Arouca (no. 508)
A Project carried out on the Macroeconomics major, under the supervision of:
Professor José Tavares
Institutions and Firm Formation: an Empirical Analysis of
Portuguese Municipalities
Abstract
The uneven spatial distribution of start-ups observed for Portugal from 2003 to 2009 suggests that local attributes, among which the quality of municipal institutions and their respective governance, impact the entrepreneurial process. Through the usage of a fixed effects negative binomial model, this thesis examines the role of municipalities in stimulating firm births, finding both the development of business-related infrastructures and the signals stemming from sound financial management to be the most relevant determinants. While some significance, although conditional, can be assigned to fast-paced licensing and EU structural funding, political right-left preferences appear to exert a negligible influence.
Keywords: Firm Formation; Municipalities; Institutions.
Acknowledgements
The author is deeply grateful to Professor José Tavares for the invaluable guidance, Professor Paulo Júlio and the entire GEE (Ministry of Economics and Employment) team for help with the database and support in programming, and Dr. Isabel Cardoso (AICEP Global Parques), Dr. Duarte Rodrigues (Observatório do QREN) and Professor João Ferrão (ICS) for important suggestions. Comments on an earlier version by Professor Francesco Franco and Professor Luís Campos e Cunha are also appreciated.
1. Introduction:
To ensure their competitiveness in a globalized knowledge-based economy, “places developed a greater need for strategic management in order to capitalize on the growth associated with entrepreneurship” (Audretsch et al., 2004: 317). Accordingly, large
relevance can be assigned to an unprecedented identification of those processes through which local institutions and respective governance end up influencing firm births.
Such purpose was fulfilled by analyzing the determinants of the varied spatial pattern of start-ups found for the Portuguese territory throughout the previous decade. Estimation of a panel count data model, properly accounting for regional characteristics and specific effects, allowed to test the significance of several indicators on the role played by municipalities in setting the conditions for new business creation.
The report hereby presented is organized as follows1. While Section 2. summarizes previous research on the geography of firm formation, 3. outlines some hypothesis on how the municipal institutional framework may impact location decisions. All methodological procedures are described in 4., being the consequent results detailed in 5. and policy implications, as well as possibilities for further investigation, derived in 6.
2.1. Relevance of entrepreneurial activity for local growth:
Since the seminal work of Schumpeter (1942), the figure of the entrepreneur has emerged as an important piece in the economic puzzle. For the Austrian, firm formation (or even its prospect) feeds a process of continuous renewal known for posterity as creative destruction. Such theoretical reasoning has been confirmed by several
1
empirical tests on the impact of business creation on regional growth. In fact, a comprehensive survey undertaken by Fritsch (2008) illustrates how supply-side effects resulting from firm entry tend to drive welfare through the path of enhanced competition. Contradicting Birch (1981), the direct contributions for net job creation seem negligible given the crowding-out of both incumbents and entrants that results from selection in a well-functioning system. Nonetheless, associated efficiency gains and innovation-based expansion of markets produce a positive lagged effect on employment which generally prevails. While analysis at the firm level supports the documented dynamics (Mata et al., 1995), overall effects seem conditional, not only on the quality of start-ups and on the financial constraints faced by entrepreneurs, but also on the characteristics of the region chosen for location (Acs and Mueller, 2008).
2.2. Regional determinants of firm formation:
Sharp differences arise when analyzing the yearly spatial variation of new entrepreneurial ventures within the same country. In order to explain this pattern, understanding which factors underlie local attractiveness appears essential.
magnetism exerted by cities also lies on the frequency of such cross-industry interactions. Hence, firm entry is driven by the benefits accruing from diversity.
Moreover, the regional presence of a vaster pool of qualified workforce, either in terms of job skills or educational background, is determinant in the business creation process. According to Audretsch and Feldman (1996), proximity to knowledge sources, namely private and public R&D-based organizations, increases the likelihood of nascent entrepreneurial activity, namely in the area of innovation.
Two final factors must also be accounted for when studying local differences in entry. On one hand, individual decisions of moving to self-employment are much conditioned by wage and unemployment levels (Storey, 1991). On the other, constraints to firm formation posed by liquidity requirements and limited access to capital (Evans and Jovanovic, 1989) cannot be overlooked: wealth, and therefore its regional distribution has an important influence.
For two decades now, empirical research on the geographical variation of firm formation (e.g., Reynolds et al., 1994; Armington and Acs, 2002; Fritsch and Falck, 2007) has examined the suitability of the theoretical predictions aforementioned in numerous spatial and temporal contexts. Transversal to most studies is the high significance verified for demand and agglomeration variables in predicting the local volume of start-ups. While Reynolds et al. (1994) also came across non negligible wealth effects, Armington and Acs (2002) confirmed the positive impact of workforce qualifications and Fritsch and Falck (2007) found short-term unemployment and unitary labour costs to posses explanatory relevance as well.
to new business creation, whereas Baptista and Mendonça (2010) observed the birth of knowledge-based enterprises to be potentiated by their proximity to universities.
Overall, results indicate that, independently of the developed country under analysis, variation across regions is inherent to the generic firm formation process. Accordingly, both policy design and institutional setup at the level of localities are more effective in fomenting entrepreneurship than the majority of standardized national strategies.
3. Role of local governance in the firm creation process:
As previously seen, the intensity of entrepreneurial activity constitutes an important (although not sufficient) condition for economic growth and job generation. Being such phenomenon localized in its determinants, it is surprising to note the scarcity of literature concerning the part played by regional institutions2.
This thesis originally contributes by deepening the ex-post analysis on the impact of local governance over the amount of firms created. Given the focus on the Portuguese case, the spatial and administrative unit considered is the municipality (município)3. Each of the 278 municipalities in continental4 Portugal is effectively empowered in what regards several domains of public choice (e.g., infrastructural development, land-use planning, business licensing). As a matter of fact, in a country with almost3 no intermediate tiers of regional authority, municipalities fulfil an important institutional role that can be framed in five key vectors of action. Local attractiveness on the perspective of the entrepreneur is therefore impacted through the following means:
2
Notable exceptions, as Reynolds et al. (1994), Audretsch et al. (2004) and Wagner and Sternberg (2004), take different approaches ranging from econometric estimation to the collection of case-studies.
3
The average mainland municipality comprises an area of 322 km2 with a resident population of 34.216 inhabitants. Politically, municipalities are ruled by an executive chamber (led by a mayor) which reports to a deliberative assembly, with both institutional bodies being elected simultaneously every 4 years.
4
1. Infrastructural planning. Audretsch et al. (2004) highlight the development of industrial parks, business areas and science and technology incubators as the best representation of a successful start-up oriented policy. By providing the necessary infrastructures, as well as eventual linkages to academic and other R&D-based organizations, municipalities tend to draw closer potential entrants who seek the benefits of knowledge spillovers, synergetic scaling and cost sharing.
2. European structural funding. In line with the previous argument, municipalities growingly rely on EU mechanisms to finance several types of projects in the fields of human capital development, innovation and entrepreneurship, among which the creation of enterprise location areas is naturally included. Besides, being most of the territory eligible under the same core cohesion targets5, application efforts to Community funds, especially in a scenario of competitive bidding, reveals a higher commitment of municipal entities towards enhancing the local business environment. 3. Licensing and regulatory framework. Prospective entrepreneurs may be deterred from market entry due to burdensome bureaucratic requirements. According to Wagner and Sternberg (2004), higher regulatory barriers and, especially, the prevalence of slow paced licensing can discourage any attempts of business creation at start. By holding a partial control over those procedures, municipalities have the ability to influence the likelihood of firm formation.
4. Financial performance. Broadening the scope of the previous topic, the well-functioning of municipal institutions must be regarded as a relevant determinant. In fact, the absence of sound financial management, possibly reflected on an exceedingly high current expenditure, may lead to a rise of local taxation to cope
5
Throughout the previous decade, all Portuguese continental regions, except Lisboa, were encompassed
with the accumulated debt service. Accordingly, the low institutional quality proxied by such misallocation of resources is bound to divert new enterprise ventures.
5. Political preferences. Finally, given that ruling coalitions tend to be majoritarian, the way in which political forces are customarily represented in municipal governing bodies can be symptomatic of the population attitudes towards business creation and self-employment. In the view of Reynolds et al. (1994), established right-wing conservatism tends to be associated with a stronger entrepreneurial tradition.
Having laid down the theoretical foundations of this study, the following section provides a thorough description of the variables and methods used for empirical testing.
4.1. Database description and measurement of firm births:
The majority of information used in this paper was taken from Quadros de Pessoal, a longitudinal matched employer-employee dataset annually updated by the Portuguese Ministry of Solidarity and Social Security (MSSS) on the basis of a survey that firms with positive payroll are legally required to submit (cases of self or wholly familiar employment are thereby exempted). Covering with micro-level detail all private sector business units having at least one wage earner, this database constitutes an exceptionally comprehensive source for research on firm dynamics6, among other topics.
In practical terms, three interconnected files link workers to the respective establishments and companies, with only the latter set being considered when calculating the volume of business formation per municipality. Thus, the adopted notion of births (i.e., firm identifiers appearing from one year to another7 in Quadros de
6
For examples of past usage given such purpose see Mata et al. (1995), Figueiredo et al. (2002), Holl (2004) or Baptista and Mendonça (2010).
7
Pessoal) refers exclusively to new primary locations/headquarters, something which suits better any analysis on the influence of municipal institutions over entrepreneurship. For similar reasons, start-ups falling outside the partnership or sole proprietorship legal definitions were excluded8 given their non-profit character.
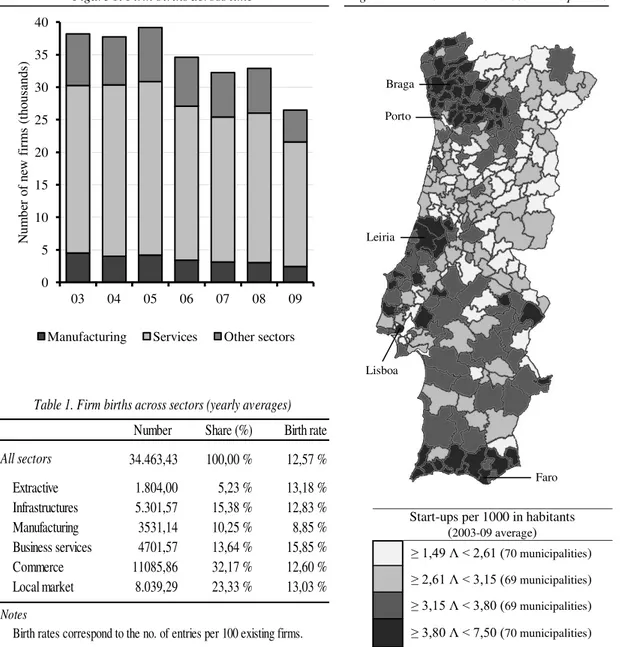
According to the applied criteria, throughout the 2003-09 period9 roughly 34.460 start-ups were annually registered in the entire continental territory, most of them (95%) employing less than 10 workers upon creation. For the 1.946 observations pertaining to such interval, this amounts to say that the average municipality experienced 122 new entrepreneurial ventures yearly. However, the level of firm formation behaved in a volatile manner across time (Figure 1.): while a slight increase is observed from 2003 to 2005, a distinct drop took place both in 2006 and 2009, being the latter indissociable from a major economic downturn. Confirming such scenario, the first three years’ average is roughly 26% higher than the one for the remaining time span.
Accounting for differences in the industrial structure, the weight of manufacturing in the start-up process has been declining throughout time, now standing below 10%. In sharp contrast, services increased their dominant position during the previous decade such that, by the last year sampled, more than seven out of ten newly created businesses would belong to this sectoral group. Further disaggregation10,11 provided in Table 1. shows that, although most firms are still set in the industries of commerce and local
8
Other entities, like foundations, cooperatives or associations, amounted to 6% of all business units originally surveyed.
9
Quadros de Pessoal information at the worker-level was not made available for 2001. Given that, not only several regressors were computed through this database, but the nature of the econometric estimation itself required the usage of a lag structure, firm births were only measured from 2003 onwards.
10
Classification of firms per sector of activity was achieved through the use of 5-digit national industry codes (CAE) which are strongly comparable to the 4-digit European standard (NACE). Changes operated in 2007 over the CAE arrangement (related to a harmonization effort that occurred after NACE’s 2nd revision) where circumvented by applying, under certain assumptions, INE’s matrix of partial conversion.
11
market supply (which jointly amount to 56% of all new ventures), business services12 have been gradually acquiring importance. Highlighted by Armington and Acs (2002) for its knowledge-intensiveness and impact on local growth, the sector’s expansion is clearly patent in a mean birth rate of 15%, by far the largest.
Even more than temporal or sectoral differences, spatial variation constitutes a marked feature of the analyzed data. Unsurprisingly, the geographical pattern of entrepreneurial intensiveness is clearly biased towards the coastal side of the country
12
It includes financial and computing activities, as well as research and consultancy services. 0 5 10 15 20 25 30 35 40
03 04 05 06 07 08 09
N u m b er o f n ew fi rm s (t h o u san d s)
Figure 1. Firm births across time
Manufacturing Services Other sectors
Number Share (%) Birth rate
34.463,43 100,00 % 12,57 %
Extractive 1.804,00 5,23 % 13,18 % Infrastructures 5.301,57 15,38 % 12,83 % Manufacturing 3531,14 10,25 % 8,85 % Business services 4701,57 13,64 % 15,85 % Commerce 11085,86 32,17 % 12,60 % Local market 8.039,29 23,33 % 13,03 %
Birth rates correspond to the no. of entries per 100 existing firms.
All sectors
Notes
Table 1. Firm births across sectors (yearly averages)
Start-ups per 1000 in habitants (2003-09 average)
≥ 1,49 Λ < 2,61 (70 municipalities)
≥ 2,61 Λ < 3,15 (69 municipalities)
≥ 3,15 Λ < 3,80 (69 municipalities)
≥ 3,80 Λ < 7,50 (70 municipalities) Figure 2. Firm birth rates across municipalities
Braga
Porto
Leiria
Lisboa
(Figure 2.). In fact, the number of firms created per 1000 inhabitants is particularly high in municipalities located in the northwest (above Porto and surrounding Braga), the littoral centre13 (close to Leiria) and the extreme south (around Faro). Reversely, the interior, namely the central and north-eastern regions, perform poorly in such respect.
Research by Figueiredo et al. (2002) concluded that investors tend to locate in close proximity of their residence area. Nonetheless, firm formation seems unevenly distributed across the territory when controlling uniquely for population. This indicates that other factors associated to local environment, including the quality of municipal governance, influence entrepreneurial intensity. Appropriate econometric modelization addresses this subject by testing which variables weigh the most in the process.
4.2. Econometric specification and methodological issues:
From the end of the last section it became clear that the probability of observing a firm birth in municipality during period , henceforth termed ), must be regarded as a function of local attributes. Given its count nature, the dependent variable
, i.e. the annual number of start-ups (nonnegative integers) verified for each
municipality, is assumed to follow a Poisson distribution with parameter
accounting for the respective set of municipal determinants.
Such stochastic process relies on the strict hypothesis of constancy in the variance to mean ratio, something which finds no empirical support in the analyzed data. Conversely, this relation tends to rise with the number of firms created, thus evidencing the presence of overdispersion. To handle it appropriately, a negative binomial specification where follows a gamma distribution of parameters was
13
adopted. Since no municipality ever faced a complete absence of business formation, augmentation towards a zero-inflated negative binomial was found unnecessary.
Non independence of the counts, given the serial correlation stemming from it, constitutes another assumption violation that had to be tackled. In face of unobserved time-invariant heterogeneity, residuals consistently point the direction in which a specific municipality deviates from the average one. Such phenomenon can be properly dealt through fixed-effects estimation. By controlling for local characteristics which are constant across time (e.g., proximity to the coast) this panel method eliminates a source of bias that would otherwise come from the undetected correlation with the regressors14.
Addressing the mentioned issues, Hausman et al. (1984) suggested a parameterization for the negative binomial model that accounted for such unobserved heterogeneity: was indexed to locality and identified as the ratio , with
representing the municipal specific effect. Under those transformations, considered parameters will become , so that
(1) .
Provided that , which contains the individual effect term, stays constant across time, maximum likelihood conditioned on the sum of firms created in the municipality throughout the sample period causes this parameter to be dropped, meaning it can assume any value for each observational group. In fact, the corresponding joint density comprises several gamma functions depending uniquely on
, as it was demonstrated by Hausman et al. (1984):
(2)
14
By exploring within variation and accommodating overdispersion simultaneously, the adopted fixed-effects negative binomial model delivers consistent estimates on the influence that the set of factors specified below displays over local business formation:
(3)
.
While embodies the number of firms created per observational unit and retains its previous meaning, regressor sets and stand, respectively, for the role of municipal institutions and for other local environment characteristics. Notice that temporal indexation is lagged by 1 year to avoid eventual reversed causality. In addition, two dummy groups where considered for this specification: on one hand,
, encompassing binary variables that account for all Portuguese districts (distritos)15, controls for spatial autocorrelation by absorbing spillover effects which are transversal to neighbouring municipalities (Baptista and Mendonça, 2010); on the other side, dummies expunge time-specific influences associated to the economic cycle. Lastly, corresponds, as usual, to the random term.
Estimations relied on the use of cluster-robust standard errors to correct for remaining autocorrelation. As to robustness checks, these are detailed in Section 5.
4.3. Institutional indicators and other explanatory variables:
The modelization above presented associates the volume of business formation to regional related factors16. Hereupon, the purpose of this thesis is twofold: to analyze the extent in which municipalities stimulate entrepreneurship, as well as to evaluate how
15
Districts are the formal first-level administrative division of the continental territory. Despite geographically larger, those 18 spatial units have no de facto power when compared to municipalities.
16
controls for local environment deemed significant in earlier studies fit the observed sample. Although endogeneity may be a feature of some variables, something inevitable given the insertion of entrepreneurial patterns in a cumulative growth mechanism (Armington and Acs, 2002), causal interpretations may still be derived by examining firm birth variations within municipalities while lagging the chosen regressors.
Recalling Section 3., the part played by municipal institutions in the start-up process could be sorted in five vectors of influence. Among them, infrastructural planning, especially in what concerns the creation of business location parks, appears to stand out. Oftentimes, implementation of such projects is accompanied by an increase on the amount of hectares per km2 formally designated as industrial area in the municipal spatial chart, a fact justifying the adoption of this indicator as a suitable proxy. Since most firms in services are established on residential space, differences regarding the strength of that determinant are expected upon comparison with manufacturing.
Additionally, per capita access to European Union funds, which encompass all capital flows under the cohesion (CF), social (ESF) and regional development (ERDF) mechanisms, signals the efforts and institutional adaptations in which municipalities must engage to improve local attractiveness in the view of entrepreneurs. This rationale applies as well to the burden dictated by the scale of licensing requirements, proxied as the average unplanned length of construction works (i.e., in excess of initially predicted duration). Given the controls imposed on household financial constraints and economic cycle, a major source of delays probably resides on bureaucracy-based interruptions.
ratio of municipal expenditure on employees (in the sense of own personnel/staff) per inhabitant. On the other side, accounting for the weight of leftist mandates, i.e.
proportion of members of the municipality’s government ideologically distant from
right-wing traditional parties (either for current affiliation or past record), enables one to test how differences on both political inclination and agenda may condition the proneness for start-up venturing in the area.
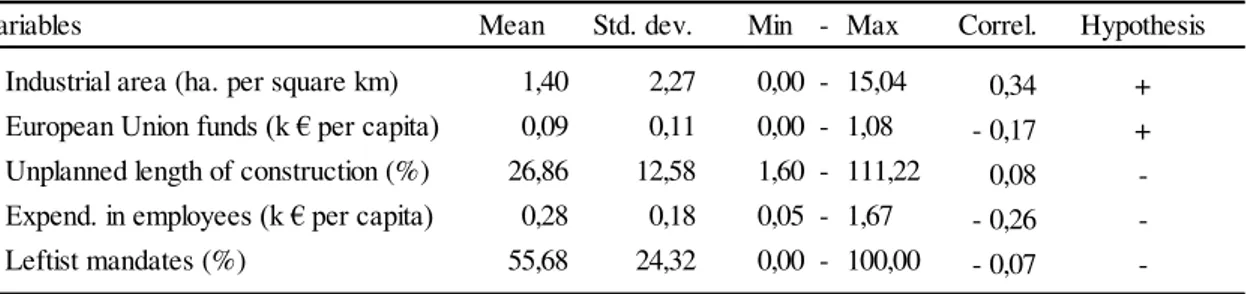
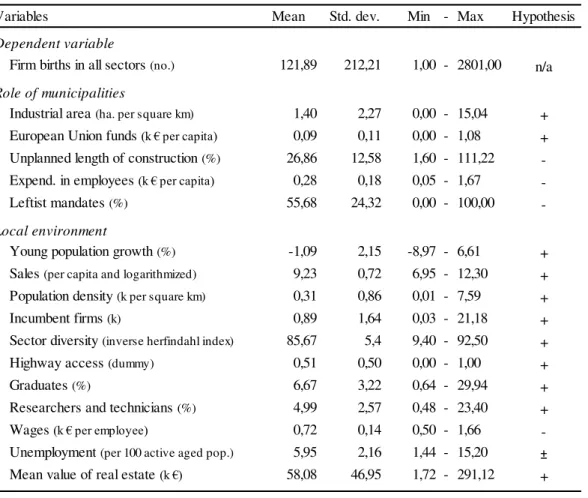
Despite portraying the relevant institutional variables under analysis, it should be noted that Table 2. contains only part of all regressors considered. In fact, other features of the local milieu (introduced in Section 2.1. and detailed below) were controlled for to prevent any omission-related bias from affecting the results.
Demand expansion, to start with, is here gauged as the annual rate of young population growth. By solely considering inhabitants with less than 15 years of age, this measure circumvents endogeneity. As a complement, local market size was scaled using the logarithmized volume of sales per capita (Baptista and Mendonça, 2010).
Previously, it was also argued that urban contexts may enhance entrepreneurial activity by pooling a varied labour supply and facilitating technological spillovers. While the former advantage should be captured by population density, calculated as the
Mean Std. dev. Min - Max Correl. Hypothesis
Industrial area (ha. per square km) 1,40 2,27 0,00 - 15,04 0,34 +
European Union funds (k € per capita) 0,09 0,11 0,00 - 1,08 - 0,17 +
Unplanned length of construction (%) 26,86 12,58 1,60 - 111,22 0,08
-Expend. in employees (k € per capita) 0,28 0,18 0,05 - 1,67 - 0,26
-Leftist mandates (%) 55,68 24,32 0,00 - 100,00 - 0,07
-Variables
Notes
Table 2. Summary statistics (partial): indicators of the role of municipalities
Correl.column reports the correlation with the number of firm births in all sectors.
See Figure A.2. (p. 33) for a map-based analysis containing the two indicators here exhibiting a stronger Correl. Symbol k stands for thousands; ha.stands for hectares.
amount of residents per km2, the latter benefits ought to be reflected in the local sum of incumbent firms. In close connection, the extent to which a heterogeneous setting promotes cross-industry interactions was analyzed through sector diversity, a transformed Herfindahl index of employment share dispersion17. Moreover, given that reduced cost-distance patterns are inherent to the agglomerative phenomenon, one expects municipalities enjoying highway access to attract a greater number of start-ups.
In terms of regional qualification, the existing stock of human capital is consistently found to set the stage for entrepreneurship. Accordingly, workforce skills are assumed to be patent in the shares of graduates (i.e. university degree holders) or researchers and technicians, a classification comprising knowledge intensive occupations18.
Lastly, several forms of opportunity cost may impact the likeliness of firm creation. A higher level of wages, for instance, not only amounts to increased input prices as it deters eventual moves towards self-employment. The reverse would apply to a larger municipal unemployment rate if it was not for the economic decline also signalled by this measurement. Beyond labour market variables, financial constraints are accounted for as well. Herein, the mean value of real estate traded locally proxies the amount of capital available to the average household.
5. Empirical results and interpretation of the regressions:
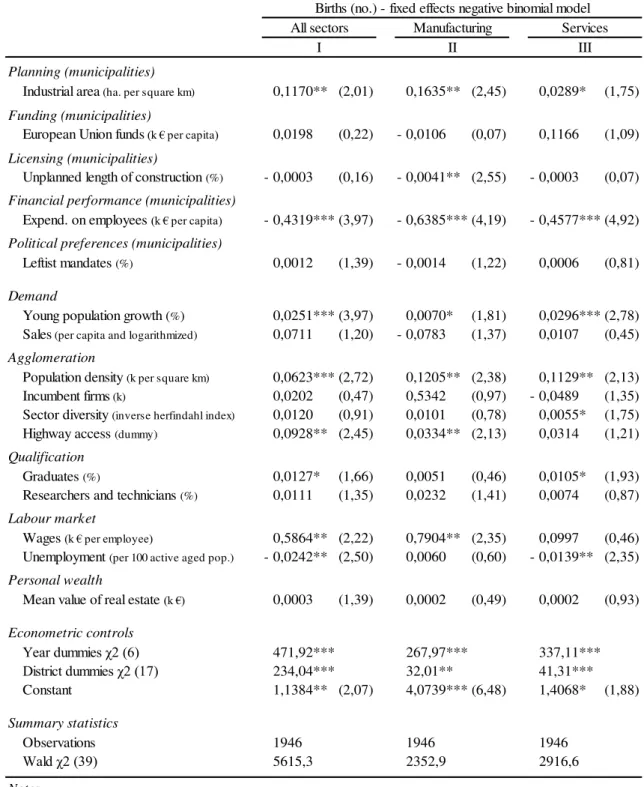
Following the prior discussion, major hypothesis underlying local variations in the firm formation process were tested through a fixed-effects negative binomial model. Table 3. provides a summary of results regarding the all-sectors baseline specification
17
Diversity in municipality is given by , where is the overall local employment while represents the workforce operating in each of the 26 industries specified in Figure A.1. (p. 32).
18
(I) described in Eq. (3), as well as a separation between manufacturing (II) and services (III) aimed at controlling for aggregation issues (Armington and Acs, 2002).
All sectors Manufacturing Services
I II III
Industrial area (ha. per square km) 0,1170** (2,01) 0,1635** (2,45) 0,0289* (1,75)
European Union funds (k € per capita) 0,0198 (0,22) - 0,0106 (0,07) 0,1166 (1,09)
Unplanned length of construction (%) - 0,0003 (0,16) - 0,0041** (2,55) - 0,0003 (0,07)
Expend. on employees (k € per capita) - 0,4319*** (3,97) - 0,6385*** (4,19) - 0,4577*** (4,92)
Leftist mandates (%) 0,0012 (1,39) - 0,0014 (1,22) 0,0006 (0,81)
Young population growth (%) 0,0251*** (3,97) 0,0070* (1,81) 0,0296*** (2,78)
Sales (per capita and logarithmized) 0,0711 (1,20) - 0,0783 (1,37) 0,0107 (0,45)
Population density (k per square km) 0,0623*** (2,72) 0,1205** (2,38) 0,1129** (2,13)
Incumbent firms (k) 0,0202 (0,47) 0,5342 (0,97) - 0,0489 (1,35)
Sector diversity (inverse herfindahl index) 0,0120 (0,91) 0,0101 (0,78) 0,0055* (1,75)
Highway access (dummy) 0,0928** (2,45) 0,0334** (2,13) 0,0314 (1,21)
Graduates (%) 0,0127* (1,66) 0,0051 (0,46) 0,0105* (1,93)
Researchers and technicians (%) 0,0111 (1,35) 0,0232 (1,41) 0,0074 (0,87)
Wages (k € per employee) 0,5864** (2,22) 0,7904** (2,35) 0,0997 (0,46)
Unemployment (per 100 active aged pop.) - 0,0242** (2,50) 0,0060 (0,60) - 0,0139** (2,35)
Mean value of real estate (k €) 0,0003 (1,39) 0,0002 (0,49) 0,0002 (0,93)
Year dummies χ2 (6) 471,92*** 267,97*** 337,11***
District dummies χ2 (17) 234,04*** 32,01** 41,31***
Constant 1,1384** (2,07) 4,0739*** (6,48) 1,4068* (1,88)
Observations 1946 1946 1946
Wald χ2 (39) 5615,3 2352,9 2916,6
Significance at 1% denoted by ***; significance at 5% denoted by **; significance at 10% denoted by *. Symbol k stands for thousands; ha.stands for hectares.
Econometric controls
Summary statistics
Notes
All explanatory variables were lagged one period to account for potential endogeneity. For the exponential conditional mean, coefficients are interpreted as a semi-elasticity. Standard errors were adjusted for clustering; absolute z-statistics are given in parenthesis.
Personal wealth
Table 3. Regression results for firm creation: all sectors, manufacturing and services
Births (no.) - fixed effects negative binomial model
Planning (municipalities)
Funding (municipalities)
Licensing (municipalities)
Financial performance (municipalities)
Political preferences (municipalities)
Demand
Agglomeration
Qualification
The above coefficients are to be interpreted as semi-elasticities evaluated at the exponential conditional mean, while standard errors adjust for clustering19. As to the adopted panel approach, Hausman tests performed consistently support its adequacy20.
In what concerns the role of municipalities as entrepreneurship promoters, significance levels associated to the planning variable confirm the predictions of Audretsch et al. (2004). Evidence shows that an increase of industrial area by one hectare per km2 leads to a 12% rise in the firm birth probability, thus corroborating (under the assumptions argued in Sections 3. and 4.3.) the importance of business location infrastructures. Furthermore, stronger effects are expected for manufacturing due to the sector’s requirements on scale, set-up costs and synergetic proximity.
A strikingly high relevance is also displayed by the assumed indicator of institutional quality. In fact, spatial units where financial resources are better managed seem to attract a higher volume of new ventures, being such phenomenon transversal to all sectoral groups. Accordingly, the direction of signs patented, not only reflects the pushing influence of ineffective local governance, as it may capture the prevalence of interiority municipalities who still weigh as non-negligible sources of employment.
Regarding the regulatory framework, unplanned length of construction solely illustrates a situation of deterred market entry in the manufacturing case. Irrelevance of this licensing proxy for the services model reveals that only larger projects, usually asked to comply with a stringent set of norms, are discouraged upon implementation by slow-paced bureaucratic proceedings under the partial control of municipal institutions.
As for the political landscape, estimation outcomes are in line with Wagner and
Sternberg’s (2004): ideology, taken as the proportion of mandates assigned to left-wing
19
Calculations using Stata12 software relied on a cluster bootstrap routine set for 400 replications. 20
forces, has no part in the firm formation process. Consequently, neither the neutrality of business supporting policies is contested, nor voting is viewed as mirroring a traditional aversion towards entrepreneurial activity.
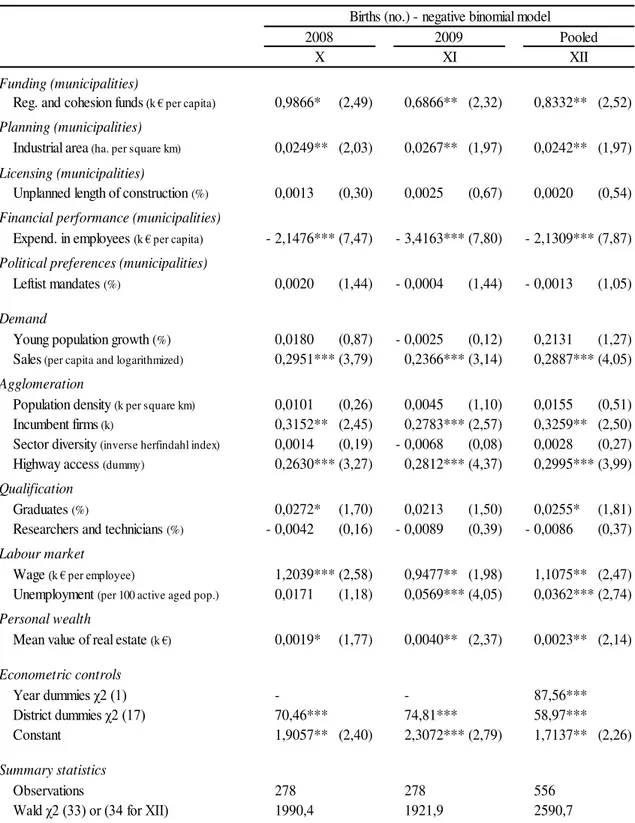
Surprisingly alike, per capita distribution of European funds appears to exert no impact over local start-up intensity. Given the sums considered, the similitude in regional eligibility and the within-country nature of this analysis, one cannot expect sheer misapplication to explain those results on its own. Such reasoning suggests that differences across programming intervals and expenditure objectives must be properly handled. Therefore, alternative computations were carried out focusing solely on competitiveness, infrastructural enhancement or innovation projects21 financed under the NSRF (2007-13) agenda and promoted by any entity belonging to the so-called municipal sphere (i.e., companies owned by the local government, as well as civil parishes, in addition to the municipal institution per se).
In order to match the selected sample period, only 2008 and 2009 were accounted for, thus precluding fixed-effects methodology. Surrogate robust models, which include separate negative binomial regressions for each of the two years, and a complementary pooled specification encompassing them both, are presented in Table A.3. of the appendix (p. 29). Therein, positive coefficients on Community financing are highly significant22, hence corroborating the theoretical expectations argued beforehand.
When exploring local environment traits which are beyond the institutional influence of municipalities, demand behaviour and agglomeration dynamics protrude as the most important processes affecting overall firm formation (in line with Reynolds et al., 1994).
21
All programs mentioned are supported through regional development (ERDF) and cohesion (CF) funding. The social (ESF) branch was disregarded due to its emphasis on longer term goals related with human capital.
22
By inspecting once again Table 3., it is visible how a percentage point rise on young population growth or a density increase of one thousand inhabitants per km2 enlarges the proneness for new business ventures in 3% and 6% respectively, being those effects non-rejectable at any typical level. Interestingly, measures like disposable income or volume of incumbent firms seem to have no relevance in the model, an occurrence perhaps explained by their strong correlation with the above cited regressors23.
Notable discrepancies emerge if taking services and manufacturing separately. Being the former sectoral group still dominated by births on the fields of commerce and local market supply, it comes as no wonder to observe such greater incidence of demand-based variables. Inversely, manufacturers appear more susceptible to rely on a dispersed network of clients and, thereafter, to face heavier transport costs. In a country where around 85% of freight movement is done by road (Holl, 2004), that alone could justify the attraction stemming from highway proximity24. Contrasts are extensive to the used diversity index. As a matter of fact, the lack of significance verified for manufacturing is possibly echoing the existence of some industries which benefit from localized specialization, scenario finding no replication in column (III).
In terms of human capital, the municipal share of graduates impacts the propensity for business creation25, meaning that a higher level of skills encourages entrepreneurial activity. Upon disaggregation, this merely holds true for services. Examining knowledge intensive sectors, Baptista and Mendonça (2010) put forward an appealing explanation ahead of obvious disparities in entry costs: while manufacturing-related
23
In fact, other potential predictors, such as the size of local population (correlated with density by 0,83), were not included precisely to avoid excessive interdependence and resulting multicollinearity problems.
24
Distance to the main metropolitan areas was ruled out as an alternative measure given the presence of district dummies in each of the models.
25
qualifications are still scant and generally absorbed by incumbents, the competitive setting in services is altogether in a superior stage, thus fostering start-up ventures.
Unexpectedly, the wage predictor yielded a negative sign for specifications (I) and (II). Such outcome may be reflecting either a failure of the considered qualification measurements in fully controlling for workforce attributes, or the unsuitability of exploring cross-regional rather than cross-industry input price variations (Fritsch and Falk, 2007). These interpretative caveats do not apply to unemployment. Its dampening influence over firm formation, as exposed in columns (I) and (III), illustrates how broad market-shrinkage effects prevail over necessity driven entrepreneurship. Lastly, after accounting for a plethora of variables, no significance was assigned to personal wealth.
Supplementary variables and robustness checks:
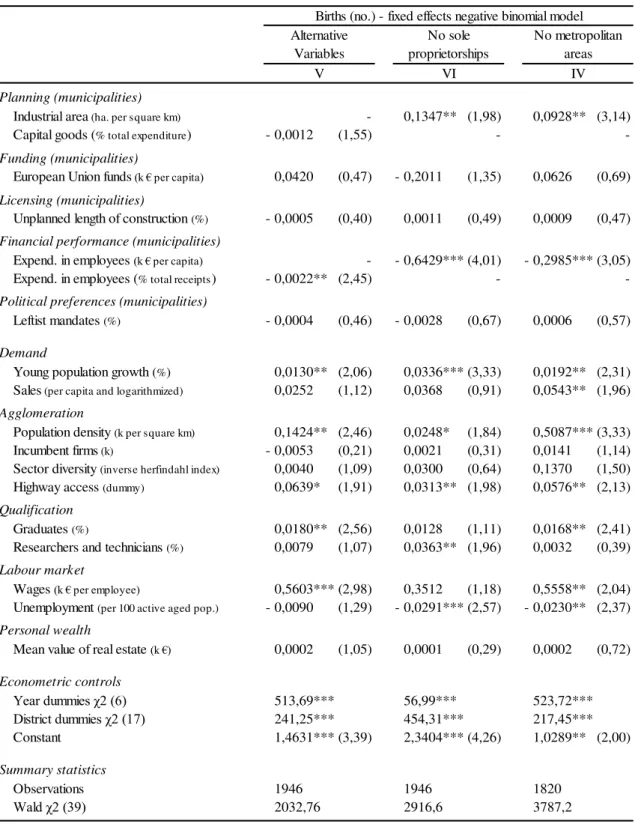
To confirm the consistency of results, additional estimations, whose output is partially26 exhibited in Table 4., were carried out for alternative sets of variables and observations or performed using different panel methods. Specification (IV), to start with, ascribes new indicators to the two institutional vectors previously deemed as being the most relevant, i.e. financial performance and infrastructural planning. For the former, the negative and significant impact associated to the expenditure in employees’ weight on total receipts substantiates, once more, how firm creation is stimulated by good municipal administration; As to the later, no link could be established between start-up intensiveness and the percentage of total expenditure allocated for capital goods acquisition probably due to the variety of projects funded under this category.
As a further coherence test, both the dimension of firms in terms of employees and the size of municipalities in what comes to the amount of newly formed businesses had
26
IV V VI VII VIII IX
Industrial area (ha. per square km) - 0,1347** (1,98) 0,0928** (3,14) 0,0461** (2,00) 0,1040** (2,17) 0,1024*** (3,79)
Capital goods (% total expenditure) - 0,0012 (1,55) - - - -
-European Union funds (k € per capita) 0,0420 (0,47) - 0,2011 (1,35) 0,0626 (0,69) - 0,0039 (0,03) 0,1302 (1,08) - 0,1022 (0,92)
Unplanned length of construction (%) - 0,0005 (0,40) 0,0011 (0,49) 0,0009 (0,47) - 0,0015 (0,93) - 0,0033 (1,36) - 0,0005 (0,24)
Expend. in employees (k € per capita) - - 0,6429** (2,41) - 0,2985*** (3,05) - 0,4146*** (3,92) - 0,5849*** (5,10) - 0,9604*** (5,03)
Expend. in employees (% total receipts) - 0,0022** (2,45) - - - -
-Leftist mandates (%) - 0,0004 (0,46) - 0,0028 (0,67) 0,0006 (0,57) - 0,0010 (1,04) 0,0012 (0,93) 0,0008 (0,84)
Joint significance χ2 (11) 48,81*** 48,00*** 45,85*** 116,93*** 185,75*** 108,81***
Observations 1946 1946 1820 1946 1946 1946
Wald χ2 (39) or (22 for VII and VIII) 2032,76 2916,6 3787,2 1067,0 2376,8 4799,7
Standard errors were adjusted for clustering; absolute z-statistics are given in parenthesis; Significance at 1% denoted by ***, at 5% denoted by **, and at 10% denoted by *. Symbol k stands for thousands; ha.stands for hectares.
Refer to Tables A.4.1. and A.4.2. (pp. 30-31) for a complete version which includes the remaining explanatory variables, year controls and district dummies (where appropriate).
Summary statistics
Notes
Regression IV encompasses additional indicators for infrastructural planning and financial performance; V excludes all firms born under the sole proprietorship legal regime (Portuguese civil law definition); VI rules out any observation belonging to the NUTSIII regions of Grande Porto (Oporto) and Grande Lisboa (Lisbon); Finally, VII, VIII and IX regard the application of different econometric methods.
All explanatory variables were lagged one period to account for potential endogeneity; For the exponential conditional mean coefficients are interpreted as a semielasticity.
Local environment regressors
Table 4. (partial) Regression results for firm creation: alternative variables, treatment of outliers and other estimation procedures
Births (no.) - fixed effects negative binomial model Births (no.) - other estimation procedures Alternative
variables
No sole proprietorships
No metropolitan areas
Fixed effects log-linear model
Fixed effects poisson model
Random effects negbin model
Planning (municipalities)
Funding (municipalities)
Licensing (municipalities)
Financial performance (municipalities)
to be controlled for. To fulfil the first goal, sole proprietorships were removed from the analysis (V), causing the dependent variable only to include partnerships, a generally larger form of company27 which represents 66% of total births. On the second case, observations pertaining to Lisboa and Porto metropolitan areas, which embrace roughly one third of start-ups, were dropped (VI) to better evaluate if municipal influences over entrepreneurship propensity are verified in the remaining territory. Inspection of both columns (V) and (VI) reveals that the importance and direction of most determinants is preserved, implying an identical process to be underlying all these models.
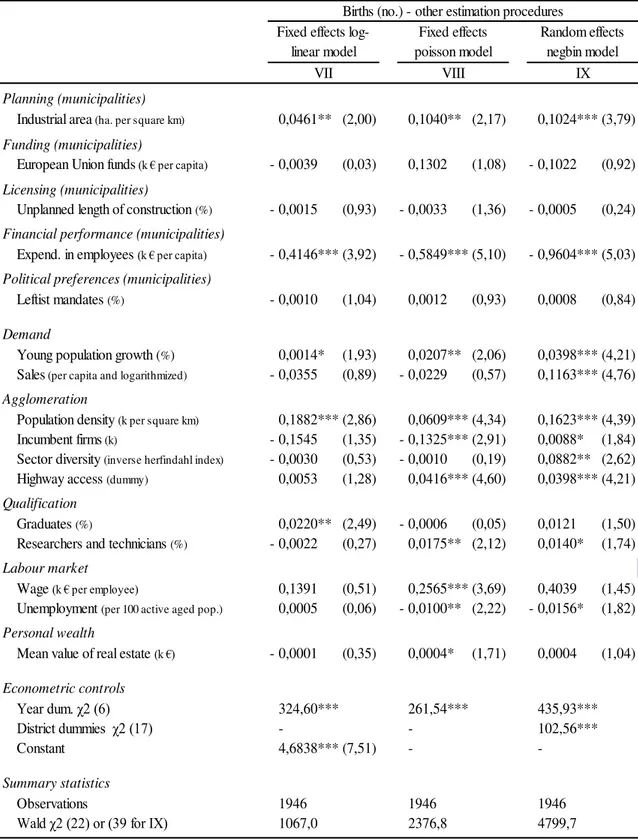
Similar conclusions can be withdrawn from the application of diverse panel procedures to baseline Eq. (3). Whereas the fixed effects log-linear OLS approach (VII) enables analogous interpretations of coefficients despite not being itself a count data method, the fixed effects Poisson (VIII) relies on weaker distributional assumptions (Cameron and Trivedi, 2005) and the random effects negative binomial (IX) treats municipal specificity as a random variable uncorrelated with the . Albeit the deflated standard errors patent in (VIII) and (IX)28, comparison with the original fixed effects negative binomial estimates unveils the persistency of a common empirical pattern, thus corroborating the robustness of the major findings.
6. Final remarks and policy implications:
By promoting innovation and enhancing the competitive stage, a high level of firm creation can be seen as a prerequisite for economic development. Consequently, it is in the interest of municipal policy makers to encourage entrepreneurship. Portuguese data on the uneven spatial distribution of entrants, drawn from Quadros de Pessoal for the
27
Taking incumbents and entrants together, those corresponding to sole proprietorships tend to employ 2,52 workers, less than the 12,11jobs provided by the average firm under the partnership legal definition.
28
2003-09 period, constitute evidence on how regional characteristics influence location decisions, therefore attesting such view. While some features, as demand or agglomeration dynamics, result from circular pull effects hardly replicable by local governments alone, there are areas where the action of municipal institutions overcomes any standardized national measures in successfully fostering business formation.
The thesis original contribution lies in identifying those means through which municipalities influenced the start-up volume. Following the estimation of a fixed effects negative binomial model that controlled for several local environment attributes, two outcomes clearly stood out: Both the sound management of municipal financial resources, here taken as a sign of overall institutional quality, and the increase in the amount of land officially allocated for industrial usage, assumed as a proxy for the establishment of business location areas, were found to exert a positive and highly significant impact. This also proved to be the case for a less cumbersome licensing framework, if confining the sample solely to manufacturing, as well as for a greater access to EU structural funds, when restricting the analysis to regional (ERDF) and cohesion (CF) projects under the NSRF (2007-13) agenda. Conversely, the ideological stance of the party/coalition leading local governance seems to be irrelevant.
References
Acs, Zoltan J. and Pamela Mueller. 2008. “Employment Effects of Business Dynamics: Mice,
Gazelles and Elephants.” Small Business Economics, 30: 85-100.
Armington, Catherine and Zoltan J. Acs. 2002. “The Determinants of Regional Variation in
New Firm Formation.” Regional Studies, 36(1): 33-45.
Audretsch, David B. and Maryann Feldman. 1996. “R&D Spillovers and the Geography of
Innovation and Production.” American Economic Review, 86(3): 630-640.
Audretsch, David D., Brett A. Gilbert and Patricia P. McDougall. 2004. “The Emergence of
Entrepreneurship Policy.” Small Business Economics, 22: 313-323.
Baptista, Rui and Joana Mendonça. 2010. “Proximity to Knowledge Sources and the
Location of Knowledge-based Start-ups.” The Annals of Regional Science, 45: 5-29.
Birch, David L. 1981. “Who Creates Jobs?” The Public Interest, 65: 3-14.
Cameron, A. Colin and Pravin K. Trivedi. 2005. Microeconometrics: Methods and
Applications. New York: Cambridge University Press.
Evans, David S. and Boyan Jovanovic. 1989. “Estimates of a Model of Entrepreneurial
Choice under Liquidity Constraints”. Journal of Political Economy, 97(4): 808-827.
Figueiredo, Octávio, Paulo Guimarães and Douglas Woodward. 2002. “Home-Field Advantage: Location Decisions of Portuguese Entrepreneurs.” Urban Economics, 52: 341-361.
Fritsch, Michael and Olivier Falk. 2007. “New Business Formation by Industry over Space
and Time: a Multidimensional Analysis.” Regional Studies, 41(2): 157-172.
Fritsch, Michael. 2008. “How Does New Business Formation Affect Regional Development?
Introduction to the Special Issue.” Small Business Economics, 30: 1-14.
Glaeser, Edward L., Hedi Kallal, José Scheinkman and Andrei Shleifer. 1992. “Growth in
Cities.” Journal of Political Economy, 100(6): 1126-1152.
Hausman, Jerry, Bronwyn H. Hall and Zvi Griliches. 1984. “Econometric Models for Count
Data with an Application to the Patents-R&D relationship.” Econometrica, 52(4): 909-938.
Holl, Adelheid. 2004. “Transport Infrastructure, Agglomeration Economies and Firm Birth:
Empirical Evidence from Portugal.” Journal of Regional Science, 44(4): 693-712.
Krugman, Paul. 1991. “Increasing Returns and Economic Geography.” Journal of Political
Economy, 99(3): 483-499.
Mata, José, Pedro Portugal and Paulo Guimarães. 1995. “The Survival of New Plants: Start -up Conditions and Post-Entry Evolution.” International Journal of Industrial Organization, 13: 459-481.
Reynolds, Paul D., David J. Storey and Paul Westhead. 1994. “Cross-national Comparisons
of the Variation in New Firm Formation Rates.” Regional Studies, 28(4): 443-456.
Schumpeter, Joseph A. 1942. Capitalism, Socialism and Democracy, London: Routledge, 1994.
Storey, David J. 1991. “The Birth of New Firms - Does Unemployment Matter? A Review of
the Evidence.” Small Business Economics, 3: 167-178.
Operational definition Source of raw data
Industrial area Ha. (per sq. km) allocated for industrial usage according to the official Municipal Spatial and Land-use Plan (PMOT). DGOTDU
European Union funds EU transfers (ERDF, CF and ESF mechanisms) registered in the income statements of municipalities (k € per capita). DGAL
Length of construction Average difference between predicted and effective duration of construction works (in % of the latter). INE a)
Expend. in employees Annual expenditure of municipalities in own personnel/staff (k € per capita). INE b)
Leftist mandates Weight of mandates in the municipal government assigned to parties or coallitions ideologically leftist (%). DGAI
Young pop. growth Annual growth of young population, i.e. inhabitants with an age inferior to 15 (%). INE b)
Sales Yearly volume of registered sales per capita, proxying personal income in each municipality (logarithmized). Quadros de Pessoal
Population density Ratio of resident population per square kilometre of municipal territory (k inhabitants per sq. km). INE b)
Incumbent firms Amount of firms (all sectors and legal regimes) existing in the municipality at the start of each year (k). Quadros de Pessoal
Sector diversity Dispersion of employment shares across the 26 industries specified in Figure A.1. (inverse Herfindahl index; see p. 16). Quadros de Pessoal
Highway access Existence of at least one highway passing through municipal territory (dummy variable equal to 1 if such is the case). INE b)
Graduates Proportion of employees holding an university degree, i.e. tertiary level of education, as defined in ISCED 11 (%). Quadros de Pessoal
Researchers and Tech. Share of the workforce in knowledge intensive occupations, categorized as such following ISCO 88 (%; see p.16). Quadros de Pessoal
Wages Earnings of full-time employees, including base salaries, regular benefits and overtime remuneration (k € per worker). Quadros de Pessoal
Unemployment Number of registered unemployed per 100 active aged inhabitants, a proxy for the municipal unemployment rate (%). GEE and IEFP
Value of real estate Average value of real estates traded throughout the year, measuring the wealth of households (k € per estate) INE b)
Alternative explanatory variables assumed for specification IV, which are described in (p. 21), were taken from INE b). Variables
Table A.1. Description of explanatory variables and respective sources: baseline specification (I)
Notes
Symbol k stands for thousands; ha.stands for hectares.
Acronyms for data sources have the following correspondance: DGAI, Office for Internal Affairs; DGAL, Office for Local Authorities; DGOTDU, Office for Spatial Planning and Urbanism;
GEE, Office for Streategy and Studies; IEFP, Institute for Employment and Vocational Training; INE, Statistics Portugal (being INE a) the Building and Housing Statistics annual publication and INE b) the institute's Regional Statistical Yearbook s).
Role of municipalities
Mean Std. dev. Min - Max Hypothesis
Firm births in all sectors (no.) 121,89 212,21 1,00 - 2801,00 n/a
Industrial area (ha. per square km) 1,40 2,27 0,00 - 15,04 +
European Union funds (k € per capita) 0,09 0,11 0,00 - 1,08 +
Unplanned length of construction (%) 26,86 12,58 1,60 - 111,22
-Expend. in employees (k € per capita) 0,28 0,18 0,05 - 1,67
-Leftist mandates (%) 55,68 24,32 0,00 - 100,00
-Young population growth (%) -1,09 2,15 -8,97 - 6,61 +
Sales (per capita and logarithmized) 9,23 0,72 6,95 - 12,30 +
Population density (k per square km) 0,31 0,86 0,01 - 7,59 +
Incumbent firms (k) 0,89 1,64 0,03 - 21,18 +
Sector diversity (inverse herfindahl index) 85,67 5,4 9,40 - 92,50 +
Highway access (dummy) 0,51 0,50 0,00 - 1,00 +
Graduates (%) 6,67 3,22 0,64 - 29,94 +
Researchers and technicians (%) 4,99 2,57 0,48 - 23,40 +
Wages (k € per employee) 0,72 0,14 0,50 - 1,66
-Unemployment (per 100 active aged pop.) 5,95 2,16 1,44 - 15,20 ±
Mean value of real estate (k €) 58,08 46,95 1,72 - 291,12 +
Dependent variable
Role of municipalities
Local environment
Table A.2.1. Summary statistics: baseline specification (I)
Variables
Notes
Symbol k stands for thousands; ha.stands for hectares.
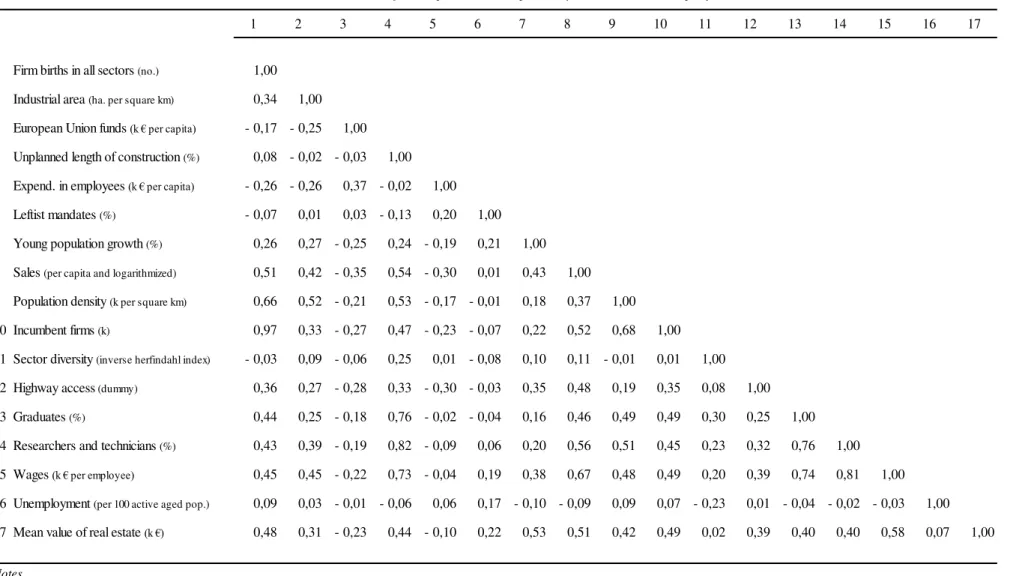
1 2 3 4 5 6 7 8 9 10 11 12 13 14 15 16 17
1 Firm births in all sectors (no.) 1,00
2 Industrial area (ha. per square km) 0,34 1,00
3 European Union funds (k € per capita) - 0,17 - 0,25 1,00
4 Unplanned length of construction (%) 0,08 - 0,02 - 0,03 1,00
5 Expend. in employees (k € per capita) - 0,26 - 0,26 0,37 - 0,02 1,00
6 Leftist mandates (%) - 0,07 0,01 0,03 - 0,13 0,20 1,00
7 Young population growth (%) 0,26 0,27 - 0,25 0,24 - 0,19 0,21 1,00
8 Sales (per capita and logarithmized) 0,51 0,42 - 0,35 0,54 - 0,30 0,01 0,43 1,00
9 Population density (k per square km) 0,66 0,52 - 0,21 0,53 - 0,17 - 0,01 0,18 0,37 1,00
10 Incumbent firms (k) 0,97 0,33 - 0,27 0,47 - 0,23 - 0,07 0,22 0,52 0,68 1,00
11 Sector diversity (inverse herfindahl index) - 0,03 0,09 - 0,06 0,25 0,01 - 0,08 0,10 0,11 - 0,01 0,01 1,00
12 Highway access (dummy) 0,36 0,27 - 0,28 0,33 - 0,30 - 0,03 0,35 0,48 0,19 0,35 0,08 1,00
13 Graduates (%) 0,44 0,25 - 0,18 0,76 - 0,02 - 0,04 0,16 0,46 0,49 0,49 0,30 0,25 1,00
14 Researchers and technicians (%) 0,43 0,39 - 0,19 0,82 - 0,09 0,06 0,20 0,56 0,51 0,45 0,23 0,32 0,76 1,00
15 Wages (k € per employee) 0,45 0,45 - 0,22 0,73 - 0,04 0,19 0,38 0,67 0,48 0,49 0,20 0,39 0,74 0,81 1,00
16 Unemployment (per 100 active aged pop.) 0,09 0,03 - 0,01 - 0,06 0,06 0,17 - 0,10 - 0,09 0,09 0,07 - 0,23 0,01 - 0,04 - 0,02 - 0,03 1,00
17 Mean value of real estate (k €) 0,48 0,31 - 0,23 0,44 - 0,10 0,22 0,53 0,51 0,42 0,49 0,02 0,39 0,40 0,40 0,58 0,07 1,00
Notes
Pairwise correlations for the alternative dependent and explanatory variables used in specifications II to VI are available from the author upon request.
Table A.2.2. Correlation matrix for independent and explanatory variables: baseline specification (I)
2008 2009 Pooled
X XI XII
Reg. and cohesion funds (k € per capita) 0,9866* (2,49) 0,6866** (2,32) 0,8332** (2,52)
Industrial area (ha. per square km) 0,0249** (2,03) 0,0267** (1,97) 0,0242** (1,97)
Unplanned length of construction (%) 0,0013 (0,30) 0,0025 (0,67) 0,0020 (0,54)
Expend. in employees (k € per capita) - 2,1476*** (7,47) - 3,4163*** (7,80) - 2,1309*** (7,87)
Leftist mandates (%) 0,0020 (1,44) - 0,0004 (1,44) - 0,0013 (1,05)
Young population growth (%) 0,0180 (0,87) - 0,0025 (0,12) 0,2131 (1,27) Sales (per capita and logarithmized) 0,2951*** (3,79) 0,2366*** (3,14) 0,2887*** (4,05)
Population density (k per square km) 0,0101 (0,26) 0,0045 (1,10) 0,0155 (0,51) Incumbent firms (k) 0,3152** (2,45) 0,2783*** (2,57) 0,3259** (2,50) Sector diversity (inverse herfindahl index) 0,0014 (0,19) - 0,0068 (0,08) 0,0028 (0,27) Highway access (dummy) 0,2630*** (3,27) 0,2812*** (4,37) 0,2995*** (3,99)
Graduates (%) 0,0272* (1,70) 0,0213 (1,50) 0,0255* (1,81) Researchers and technicians (%) - 0,0042 (0,16) - 0,0089 (0,39) - 0,0086 (0,37)
Wage (k € per employee) 1,2039*** (2,58) 0,9477** (1,98) 1,1075** (2,47) Unemployment (per 100 active aged pop.) 0,0171 (1,18) 0,0569*** (4,05) 0,0362*** (2,74)
Mean value of real estate (k €) 0,0019* (1,77) 0,0040** (2,37) 0,0023** (2,14)
Year dummies χ2 (1) - - 87,56***
District dummies χ2 (17) 70,46*** 74,81*** 58,97*** Constant 1,9057** (2,40) 2,3072*** (2,79) 1,7137** (2,26)
Observations 278 278 556
Wald χ2 (33) or (34 for XII) 1990,4 1921,9 2590,7 Financial performance (municipalities)
Political preferences (municipalities)
Agglomeration
The funding variable accounts for all National Strategic Reference Framework financial resources assigned to regional (ERDF) and cohesion (CF) projects benefiting any entity comprised in the municipal institutional sphere.
Table A.3. Regression results for firm creation: regional and cohesion funds under the NSRF (EU agenda) Births (no.) - negative binomial model
Demand
Funding (municipalities)
Planning (municipalities)
Licensing (municipalities)
Symbol k stands for thousands; ha.stands for hectares.
Qualification
Labour market
Personal wealth
Econometric controls
Summary statistics
Notes
Regressions X and XI correspond to negative binomial models with robust standard erros; XII amounts to a pooled negbin adjusted for clustering; In both cases, absolute z-statistics are given in parentheses.
V VI IV
Industrial area (ha. per square km) - 0,1347** (1,98) 0,0928** (3,14) Capital goods (% total expenditure) - 0,0012 (1,55) -
-European Union funds (k € per capita) 0,0420 (0,47) - 0,2011 (1,35) 0,0626 (0,69)
Unplanned length of construction (%) - 0,0005 (0,40) 0,0011 (0,49) 0,0009 (0,47)
Expend. in employees (k € per capita) - - 0,6429*** (4,01) - 0,2985*** (3,05) Expend. in employees (% total receipts) - 0,0022** (2,45) -
-Leftist mandates (%) - 0,0004 (0,46) - 0,0028 (0,67) 0,0006 (0,57)
Young population growth (%) 0,0130** (2,06) 0,0336*** (3,33) 0,0192** (2,31) Sales (per capita and logarithmized) 0,0252 (1,12) 0,0368 (0,91) 0,0543** (1,96)
Population density (k per square km) 0,1424** (2,46) 0,0248* (1,84) 0,5087*** (3,33) Incumbent firms (k) - 0,0053 (0,21) 0,0021 (0,31) 0,0141 (1,14) Sector diversity (inverse herfindahl index) 0,0040 (1,09) 0,0300 (0,64) 0,1370 (1,50) Highway access (dummy) 0,0639* (1,91) 0,0313** (1,98) 0,0576** (2,13)
Graduates (%) 0,0180** (2,56) 0,0128 (1,11) 0,0168** (2,41) Researchers and technicians (%) 0,0079 (1,07) 0,0363** (1,96) 0,0032 (0,39)
Wages (k € per employee) 0,5603*** (2,98) 0,3512 (1,18) 0,5558** (2,04) Unemployment (per 100 active aged pop.) - 0,0090 (1,29) - 0,0291*** (2,57) - 0,0230** (2,37)
Mean value of real estate (k €) 0,0002 (1,05) 0,0001 (0,29) 0,0002 (0,72)
Year dummies χ2 (6) 513,69*** 56,99*** 523,72***
District dummies χ2 (17) 241,25*** 454,31*** 217,45***
Constant 1,4631*** (3,39) 2,3404*** (4,26) 1,0289** (2,00)
Observations 1946 1946 1820
Wald χ2 (39) 2032,76 2916,6 3787,2
All explanatory variables were lagged one period to account for potential endogeneity.
Table A.4.1. Regression results for firm creation: alternative variables and treatment of outliers
Births (no.) - fixed effects negative binomial model
Demand No metropolitan areas No sole proprietorships Planning (municipalities) Funding (municipalities) Licensing (municipalities)
Financial performance (municipalities)
Political preferences (municipalities)
For the exponential conditional mean, coefficients are interpreted as a semi-elasticity. Standard errors were adjusted for clustering; absolute z-statistics are given in parenthesis.
Significance at 1% denoted by ***; significance at 5% denoted by **; significance at 10% denoted by *. Symbol k stands for thousands; ha.stands for hectares.
Regression IV encompasses additional indicators for infrastructural planning and financial performance; V excludes all firms born under the sole propritorship legal regime (Portuguese civil law definition); Finally, VI rules out any
VII VIII IX
Industrial area (ha. per square km) 0,0461** (2,00) 0,1040** (2,17) 0,1024*** (3,79)
European Union funds (k € per capita) - 0,0039 (0,03) 0,1302 (1,08) - 0,1022 (0,92)
Unplanned length of construction (%) - 0,0015 (0,93) - 0,0033 (1,36) - 0,0005 (0,24)
Expend. in employees (k € per capita) - 0,4146*** (3,92) - 0,5849*** (5,10) - 0,9604*** (5,03)
Leftist mandates (%) - 0,0010 (1,04) 0,0012 (0,93) 0,0008 (0,84)
Young population growth (%) 0,0014* (1,93) 0,0207** (2,06) 0,0398*** (4,21)
Sales (per capita and logarithmized) - 0,0355 (0,89) - 0,0229 (0,57) 0,1163*** (4,76)
Population density (k per square km) 0,1882*** (2,86) 0,0609*** (4,34) 0,1623*** (4,39)
Incumbent firms (k) - 0,1545 (1,35) - 0,1325*** (2,91) 0,0088* (1,84)
Sector diversity (inverse herfindahl index) - 0,0030 (0,53) - 0,0010 (0,19) 0,0882** (2,62)
Highway access (dummy) 0,0053 (1,28) 0,0416*** (4,60) 0,0398*** (4,21)
Graduates (%) 0,0220** (2,49) - 0,0006 (0,05) 0,0121 (1,50)
Researchers and technicians (%) - 0,0022 (0,27) 0,0175** (2,12) 0,0140* (1,74)
Wage (k € per employee) 0,1391 (0,51) 0,2565*** (3,69) 0,4039 (1,45)
Unemployment (per 100 active aged pop.) 0,0005 (0,06) - 0,0100** (2,22) - 0,0156* (1,82)
Mean value of real estate (k €) - 0,0001 (0,35) 0,0004* (1,71) 0,0004 (1,04)
Year dum. χ2 (6) 324,60*** 261,54*** 435,93***
District dummies χ2 (17) - - 102,56***
Constant 4,6838*** (7,51) -
-Observations 1946 1946 1946
Wald χ2 (22) or (39 for IX) 1067,0 2376,8 4799,7
Fixed effects log-linear model
Fixed effects poisson model
Random effects negbin model Births (no.) - other estimation procedures
Table A.4.2. Regression results for firm creation: other estimation procedures
Summary statistics Planning (municipalities)
Funding (municipalities)
Licensing (municipalities)
Financial performance (municipalities)
Political preferences (municipalities)
Demand Qualification Labour market Personal wealth Econometric controls Agglomeration
Significance at 1% denoted by ***; significance at 5% denoted by **; significance at 10% denoted by *. Notes
For the exponential conditional mean coefficients are interpreted as a semielasticity. All explanatory variables were lagged one period to account for potential endogeneity.
Standard errors were adjusted for clustering; absolute z-statistics are given in parenthesis. Regressions VII, VIII and IX regard the application of different econometric methods.
Sectoral group Sector Industry
Other Sectors Extraction Agriculture, fishing and related activities Mining and quarrying
Infrastructures Construction and related activities
Electricity, water and gas supply
Manufacturing Basic and fabricated metals
Glass, ceramics and contruction materials Food, beverages and tobacco
Leather and textiles Wood and similar products Pulp, paper and similar products Rubber and plastics
Chemicals, synthetic fibers and refining Electrical and optical equipment Transportation equipment Other equipments and machinery Other manufacturing activities
Services Business Financial intermediation Business and renting activities
Commerce Transport and storage
Wholesale and retail trade
Local market supply Education and related services
Health and social work
Public administration and organizations Hotels and restaurants
Leisure-related services
Household-related and other services
Notes
Figure A.1. Sectoral and industrial disaggregation of economic activity
This breakdown was performed using the 5-digit Portuguese industry codes (CAE). A methodological break resulting from the general review operated in 2007 (CAE-Rev.2.1 to CAE-Rev.3) made it necessary to apply INE's table of partial conversion (assumptions performed by the author can be detailed upon request).
Notes
Spatial patterns hereby presented must be confronted with the distribution of start-ups per 1000 inhabitants shown in Figure 2. (p. 10). Additionally, core areas are identified in there. Although estimations conducted are solely focused on within variation (Section 4.2.), graphical comparisons between municipalities serve as further empirical motivation.
Figure A.2. Map-based comparison between municipalities: firm formation and institutional indicators on infrastructural planning and financial performance
≥ 2,0 Λ < 16,5
≥ 16,5 Λ < 37,5
≥ 37,5 Λ < 99,8
≥ 99,8 Λ < 1930
≥ 0,00 Λ < 0,17
≥ 0,17 Λ < 0,55
≥ 0,55 Λ < 1,62
≥ 1,62 Λ < 15,1
≥ 0.08 Λ < 0,19
≥ 0,19 Λ < 0,29
≥ 0,29 Λ < 0,44
≥ 0,44 Λ < 1,35 Firm births in all sectors
(no.) (2003-09 average)
Industrial area (ha. per square km) (2002-08 average)
Expend. in employees (k € per capita)