TEMAS LIVRES FREE THEMES
1 Departamento de Odontologia Social, Faculdade de Odontologia de Piracicaba, Unicamp. Av. Limeira 901, Vila Rezende. 13414-903 Piracicaba SP Brasil.
[email protected] 2 Faculdade de Medicina, Universidade Federal de São João Del-Rei. Campus Centro Oeste Dona Lindu. Divinópolis MG Brasil. 3 Programa de Pós-Graduação em Ortodontia, Fundação Hermínio Ometto, Uniararas. Araras SP Brasil.
4 Programa de Pós-Graduação em Odontologia-Ortodontia, FHO, Uniararas. Araras SP Brasil.
Bayesian model and spatial analysis of oral
and oropharynx cancer mortality in Minas Gerais, Brazil
Modelo Bayesiano e análise espacial da mortalidade
por câncer de boca e orofaringe em Minas Gerais, Brasil
Resumo O objetivo deste estudo foi determinar a taxa de mortalidade por câncer de boca e aplicar o Modelo Bayesiano Empírico e a Análise Espa-cial para suavizar a taxa bruta de mortalidade por câncer de boca e orofaringe. Foi usado o Capí-tulo II da Classificação Internacional de Doenças (CID-10) para Categorias C00 a C14. Os dados foram extraídos do Sistema de Informações sobre Mortalidade do Brasil (SIM) do Estado de Minas Gerais. As estatísticas descritivas e as taxas brutas de mortalidade foram calculadas para cada muni-cípio. Posteriormente, foram aplicados os estima-dores Bayesianos Empíricos. Em 2012, em Minas Gerais, foram registradas 769 mortes para o cân-cer de boca e orofaringe, dos quais 607 (78,96%) eram homens e 162 (21,04%) mulheres. Houve uma grande variação na distribuição espacial da taxa de mortalidade bruta. Foi possível identificar aglomeração nas regiões Sul, Central e Norte com maior precisão pelo Estimador Bayesiano Modelo Global e Local. Através dos Modelos Bayesian foi possível mapear aglomeração espacial de mortes por câncer de boca e orofaringe com maior preci-são. Assim, pela epidemiologia espacial foi possível obter resultados mais precisos e fornecer subsídios para ações para reduzir a mortalidade por este tipo de câncer.
Palavras-chave Câncer oral, Mortalidade, Epi-demiologia, Análise Bayesiana
Abstract The objective of this study was to de-termine of oral and oropharynx cancer mortality rate and the results were analyzed by applying the Spatial Analysis of Empirical Bayesian Model. To this end, we used the information contained in the International Classification of Diseases (ICD-10), Chapter II, Category C00 to C14 and Brazilian Mortality Information System (SIM) of Minas Gerais State. Descriptive statistics were observed and the gross rate of mortality was calculated for each municipality. Then Empirical Bayesian esti-mators were applied. The results showed that, in 2012, in the state of Minas Gerais, were registered 769 deaths of patients with cancer of oral and oropharynx, with 607 (78.96%) men and 162 (21.04%) women. There was a wide variation in spatial distribution of crude mortality rate and were identified agglomeration in the South, Cen-tral and North more accurately by Bayesian Esti-mator Global and Local Model. Through Bayesian models was possible to map the spatial clustering of deaths from oral cancer more accurately, and with the application of the method of spatial epi-demiology, it was possible to obtain more accurate results and provide subsidies to reduce the number of deaths from this type of cancer.
Key words Oral cancer, Mortality, Epidemiology, Bayesian Analysis
Emílio Prado da Fonseca 1
Cláudia Di Lorenzo Oliveira 2
Francisco Chiaravalloti Neto 3
Antonio Carlos Pereira 1
Silvia Amélia Scudeler Vedovello 4
F
o
nse
ca EP
Introduction
Epidemiological studies of incidence of and mortality from oral cancer have demonstrated high rates for this type of neoplasm in
individ-uals, irrespective of age, sex, race and country1-4.
Regional differences in the distribution of mor-tality are attributed to the population’s exposure to risk factors, such as lifestyle, socioeconomic conditions, migratory phenomena, type of diet, or those directly related to the genetic
character-istics of the population2-7.
Brazil is among the countries with the
high-est incidence of and mortality from oral cancer2-7.
The estimates of incidence rates are 10.6 new cases per 100 thousand men and 3.4 new cases per 100 thousand women. Higher crude rates of
mortality for men are also expected8,9.
Studies published in the literature invariably analyze the data of mortality from oral cancer by
crude or pondered rates by age or sex3,4,7.
How-ever, this measure may be equal to zero or close to zero in municipalities with small populations,
and hardly any or no cases10. This result arises
from analysis performed from crude rates, in which the information about neighboring mu-nicipalities are not included in calculation of the
rate10,11. Furthermore, spatial analysis also allows
for identifying the formation of agglomerates of deaths and their relations with contextual and
environmental factors12,13.
Whereas, the use of the Empirical Bayesian method before the construction of thematic maps, refines the mortality rates, since they have
been used in studies of other types of cancer11,14.
This refinement of the mortality rates results from the fact that the Empirical Bayesian meth-od corrects random fluctuations, especially those related to locations with small populations and allows for better control of the variability of rates through the reduction in variance, considering information of the neighborhood and relations
between close areas in small populations10,11,14.
Considering as null hypothesis that mapping of the crude rate does not clearly identify the for-mation of agglomerates of deaths, and that the Empirical Bayesian analysis provides a re-config-uration of the distribution of mortality and for-mation of agglomerates, the aim of this study was to compare the results obtained between the esti-mate by the crude rate and the Bayesian method for the rate of deaths from oral and oropharynx cancer, in the State of Minas Gerais, in 2012.
Methodology
The State of Minas Gerais is located in the South-eastern region of Brazil. It consists of 853 munici-palities and has a population of 19.597.330 inhab-itants (10% of the population of the country). It has a Mean Human Development Index (MHDI) of 0.731 and GINI Index of 0.46. The proportion of persons resident in urban areas represents 85.3%, and the economically active population is 9.94 million. It has a tropical climate with mean
annual temperatures of over 18°C15,16.
This was an ecological study with a secondary source of data. To analyze the situation of oral and oropharynx cancer in Minas Gerais, data made available by the System of Information about
Mortality (SIM)17. Data collection was
standard-ized by the selection of death per place of resi-dence. To verify the consistency of information, the option was to access the data by means of two sites: State Secretary of Health of Minas Gerais
(SES/MG) and Tabnet/DATASUS18,19. This
pro-cedure was performed at two distinct time inter-vals to ensure that there would be no inclusion or exclusion of registers, and to guarantee the data, since the two systems are fed in a constant and consistent manner. Afterwards the data extract-ed from the system were tabulatextract-ed in a computer software program. The data contained in the SIM are made available in a public and open manner, and as it was a secondary source of data. We use the year 2012 because while collecting data from the years 2013, 2014 and 2015 were not updated by the Mortality Information System (SIM) and can be modified in order to perform additional tests to confirm the origin of the lesion and cause
of death18,19.
The selection of locations of neoplasm was based on Chapter 2 of CID-10 (List of Tabulation CID-BR-10) for the year 2010. For this study, the
following categories were selected: C00 to C143,20.
The consistency and validation of the use of data extracted from SIM as source of information for studies with reference to mortality from oral and oropharynx cancer were performed by previous
studies21,22.
Crude Rate
The crude rate was calculated by the number of cases of each geographical unit divided by the population at risk and later multiplication by a
aúd
e C
ole
tiv
a,
23(1):153-160,
2018
Spatial Rate, Empirical Bayesian and Spatial Empirical Bayesian Models
The Crude Rate of mortality from cancer of the mouth for the year 2012 was adopted, as standard for comparison for the application of
smoothing by the Bayesian models10,11,14.
First was calculated the neighborhood matrix with contiguity criterion. The Spatial Rate is es-timated by substituting the rate of each munici-pality with the rate of the region, and inserting the municipality itself and its neighbors in the
calculation10,11,14.
The Empirical Bayesian Rate is the pondered sum between the Crude Rate and the overall/ global mean rate. Ponderation has a factor in-versely proportional to that of the population exposed; that is, the higher the population of a municipality, the greater its reliability. Therefore, the Empirical Bayesian Rate is close to the Crude Rate. In the literature, it is also called the Global
Empirical Bayesian rate10,11,14. The difference from
the Spatial Empirical Bayesian Rate is that in the latter, ponderation is done by the local mean val-ue, and is also called the Local Empirical
Bayes-ian Rate10,11,14. The methodology of this study was
based on that of a previous study developed by
Carvalho et al.23, who used the Bayesian rates for
mapping homicides in Brazilian municipalities. In order to describe the geographical pattern of the occurrence of oral cancer, thematic maps were constructed, based on the distributions of the mortality rates for each municipality. The legends of the maps were standardized into five extracts to facilitate visualization and under-standing of the results. For the construction of the maps, an electronic cartographic base was used, made available by IBGE, and a specific
computer software program24,25.
In addition, to investigate the relationship between age and gender were calculated the rea-son prevalence and odds ratio. The data were subdivided into two variables: gender (male and female) and age (less than 60 years and greater than 60 years).
Results
The distribution of deaths from oral and oropha-ryngeal cancer of the 853 municipalities of the State of Minas Gerais in 2012 were analyzed. In the mentioned year, 770 deaths from cancer of the mouth occurred, with 608 (78.96%) being men and 162 (21.04%) women. For this study,
one death was excluded because of lack of in-formation about the municipality of residence. Considering the estimated population of the
State in 201215 and the total number of cases,
the crude rate for Minas Gerais in 2012 was 3.87 deaths per one hundred thousand inhabitants. The proportion of male deaths was 3.75 higher than the proportion of women deaths.
The simple mean of the Crude Rate and Spatial Empirical Bayesian Rate of deaths from cancer of the mouth were lower, in addition to presenting a higher standard deviation in com-parison with the Empirical Bayesian and Spatial Rates (Table 1).
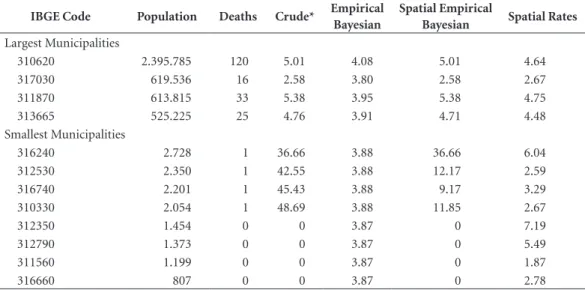
In 2012, 517 municipalities in Minas Gerais recorded no deaths; In the same year, 176 re-corded only 1 death. Among the 8 less populated municipalities, and with few cases, the crude rate ranged from 0 to 36.66 and caused an overesti-mation of the death rate from this type of can-cer. In an inverse direction, the 4 most populated municipalities, and with the highest number of deaths in the state, presented crude rates that ranged from 2.58 to 5.38 and caused an under-estimation of the rate (Table 2). In Minas Gerais, men over 60 years old die 1.38 times more than women with over 60 years old when compared to deaths in individuals less 60 years old. The preva-lence of deaths from oral and oropharynx cancer was 3.75 more in men than in women (Table 3).
Figures 1 and 2 present the distribution of the mortality rates from oral and oropharynx cancer that occurred in the state in 2012. From Figure 1, it is possible to affirm that deaths from cancer of the mouth are dispersed throughout the State and interspersed by a high number of geograph-ic voids and low extremes represented by lighter colors. As the method used was the crude rate, it is also possible to visualize that the highest rates occurred in municipalities of small size, repre-sented by the darker colors.
F
o
nse
ca EP
It is also possible to observe the formation of re-gional agglomerates of deaths.
The Empirical Bayesian Rate presented great-er scattgreat-ering among the segments, mosaic ap-pearance and many polygons. This may be due to the influence of the general mean which was 3.87 deaths per 100 thousand inhabitants. The large number of small municipalities with zero cases may contribute to the downward displacement
of the global mean value and may consequently have compromised this estimate.
Discussion
In this study, techniques for smoothing of data for mortality rates from oral and oropharynx cancer were used. For rare events, and in the case
Table 1. Descriptive statistics of the mortality rates from oral cancer in the municipalities of Minas Gerais, Brazil,
2012.
Rates* Mean Median Standard Deviation Minimum Maximum
Crude 3.57 0 7.45 0 50.59
Empirical Bayesian 3.87 3.87 0.01 3.80 4.07 Spatial Empirical Bayesian 3.07 0.29 4.89 0 36.65
Spatial 3.75 3.57 2.21 0 12.69
* Rates per 100,000 inhabitants.
Table 2. Rates of deaths from oral cancer in the largest and smallest municipalities in the State of Minas Gerais,
Brazil, 2012.
IBGE Code Population Deaths Crude* Empirical
Bayesian
Spatial Empirical
Bayesian Spatial Rates
Largest Municipalities
310620 2.395.785 120 5.01 4.08 5.01 4.64
317030 619.536 16 2.58 3.80 2.58 2.67
311870 613.815 33 5.38 3.95 5.38 4.75
313665 525.225 25 4.76 3.91 4.71 4.48
Smallest Municipalities
316240 2.728 1 36.66 3.88 36.66 6.04
312530 2.350 1 42.55 3.88 12.17 2.59
316740 2.201 1 45.43 3.88 9.17 3.29
310330 2.054 1 48.69 3.88 11.85 2.67
312350 1.454 0 0 3.87 0 7.19
312790 1.373 0 0 3.87 0 5.49
311560 1.199 0 0 3.87 0 1.87
316660 807 0 0 3.87 0 2.78
* Rates per 100, 000 inhabitants.
Table 3. Prevalence of deaths from oral and oropharynx cancer by sex and age, Minas Gerais, Brazil, 2012.
Sex Age in Years n (%) O R* p IC** PR*** p IC**
≤ 59 ≥ 60
Male 307 300 607 (78.96) 1.38 0.08 0.9722 – 1.9567 3.75 < 0.001 3.25-4.32
Female 69 93 162 (21.04) 1 - - - -
-Total 376 393 769 (100) - - -
aúd
e C
ole
tiv
a,
23(1):153-160,
2018
of the occurrence of cancer, the researcher needs to be cautious, because problems of under- or
overestimation of the rates found may occur23.
In municipalities in which no cases occurred, or which have very small populations, the crude rate would be zero or close to zero, so that the appear-ance of a single case in these municipalities may
significantly alter the crude rate23. To smooth the
analysis, the Bayesian models and identification of agglomerates of death from oral and orophar-ynx cancer were used in a manner similar to those of previous studies that used Bayesian models for stabilizing mortality rates from oral cancer and
identification of agglomerates26,27.
Researches on oral and oropharynx cancer in
Brazil have used crude and pondered rates28-30.
However, They are sensitive to random vari-ability, particularly in municipalities with low populations. In this study, the phenomenon of overestimation and underestimation of the crude rate were demonstrated. This may occur in other studies on oral and oropharynx cancer, which are based on frequency, crude and pondered rates. In the state studied, a municipality with over 2
million inhabitants and 120 deaths recorded a lower crude rate than a municipality with 2.054 inhabitants and 1 death. It could be verified that the Bayesian and Spatial rates smoothed the re-sults of crude rates. That is, as many municipal-ities in the state did not register any deaths from this type of cancer, and had a crude rate equal to zero, the mean value of the crude rate was dis-placed by lower values. These facts compromised the estimation of the crude rate and showed the influence of population size on the value of the
results23 (Tables 1 and 2).
Identification of agglomerates of death from oral cancer has also been made by means of
fre-quencies and pondered rates by age or gender3.
The results of this study suggest the Bayesian models as alternative to the use of crude, pon-dered and frequency rates for analysis, mapping and identification of agglomerates of death from this type of cancer that occurred in Minas Gerais.
Therefore, the methods used suggest the smoothing of extreme values by means of Bayes-ian and Spatial techniques. For the more popu-lated municipalities, the corrected rates obtained
Figure 1. Spatial distribution of the crude rate of mortality from oral and oropharynx cancer (per 100,000
inhabitants) MG, 2012.
Crude
F
o
nse
ca EP
values with little variation in comparison with the crude rate. Whereas for smaller municipali-ties, the smoothing converges on values close to those of the crude rates in the larger municipal-ities. This result was similar to that found in a
study conducted in Brazil on homicide rates23
(Figures 1 and 2).
In a state with many municipalities, regional differences and the high number of municipali-ties that did not present deaths, use of the Em-pirical Bayesian Rate (EBR) is not recommend-ed, because its correction is made by the mean value of the state. Among the rates corrected, only the Spatial Empirical Bayesian Rate (SEBR) presented better visualization of the distribution of deaths and identification of the regional ag-glomerates (Figure 2). Smoothing by SEBR uses the local mean value, the municipalities located
in microregions have the same characteristics, with coherent regional results. Therefore, SEBR may be a more reliable measure of smoothing for studies on mortality from oral and oropharynx cancer in Minas Gerais.
By means of both the Spatial and Empirical Rates (Global and Local) it was possible to iden-tify agglomerates of deaths in regions with the best and worst socioeconomic conditions in the state (Figure 2). A previous study supposed that the problem was not related to the size of popu-lation or level of development, because without distinction among regions, advanced cases of the disease, at a high level of complexity occurred on arrival, therefore, with an unfavorable prognosis
at the beginning of treatment8. However,
previ-ous studies have identified the higher frequency of deaths from oral cancer in regions with the
Figure 2. Spatial distribution of the mortality rates from oral and oropharynx cancer, adjusted by the Bayesian
models (per 100 thousand inhabitants), MG, 2012.
Spatial rate -0.0001 ~ 1.9004 1.9004 ~ 3.0556 3.0556 ~ 4.2637 4.2637 ~ 5.5262 5.5262 ~ 12.6942
Empirical Bayesian rate 3.8034 ~ 3.8693 3.8693 ~ 3.8709 3.8709 ~ 3.8717 3.8717 ~ 3.8773 3.8773 ~ 4.0781
aúd
e C
ole
tiv
a,
23(1):153-160,
2018
worst socioeconomic indicators3,4,7,30.
Epidemi-ological studies about oral and oropharyngeal cancer prevalence and association with contex-tual, environmental and individual variables
are based on frequencies and rates5-7,13.27-31. It is
important to affirm that the Bayesian rates do not substitute the crude and pondered rates, but
make a smoothing26,27. This study suggests that
the maps and identification of agglomerates of deaths from oral and oropharynx cancer should
be conducted10,11,14,26,27.
It is important to point out that this method is subject to error caused by under-registration, particularly in small municipalities, and when the quality of the information is not known. Un-der-registration of deaths and quality of informa-tion present in the declarainforma-tion of Death may com-promise the quality of SIM and explain the high number of municipalities with “zero” deaths from cancer of the mouth and oropharynx in Minas
Gerais21,22. Therefore, epidemiological studies of
spatial distribution based on maps are sensitive to the quality of the data of the areas studied.
This study has limitations. For being a cross-sectional study could not establish causal-ity. By using secondary data may have occurred bias information.
Conclusion
The application of smoothing of crude rates al-lowed a alternative interpretation of the results. However, this application suffers influence from the size of the population of the municipality. There was the formation of agglomerates in cer-tain regions, and this fact provides subsidies for the development of priority actions for facing up to this type of death.
Collaborations
EP Fonseca, DL Oliveira, F Chiaravalloti Neto participated in the design and development of the article, collection and tabulation of data, data interpretation and writing of the article. AC Pereira and SAS Vedovello attended the article design, data interpretation and critical text revi-sion and approval of the final verrevi-sion. MC Me-neghim attended data interpretation, critical text revision and approval of the final version.
Acknowledgements
F
o
nse
ca EP
References
1. Stewart BW, Kleihues P, editors. World cancer report. Lyon: IARC Press; 2003.
2. Wünsch Filho V, Moncau JE. Cancer mortality in Brazil 1980-1995: regional patterns and time trends. Rev
As-soc Med Bras 2002; 48(3):250-257.
3. Radespiel- Tröger M, Meyer M, Fenner M. Geograph-ic differences and time trends of intraoral cancer in-cidence and mortality in Bavaria, Germany. J
Cranio-maxillofac Surg 2012; 40(8):285-292.
4. Bonifazi M, Malvezzi M, Bertuccio P, Edefonte V, Gar-avello W, Levi F, La Vecchia C, Negri E. Age-period-co-hort analysis of oral cancer mortality in Europe: The end of an epidemic? Oral Oncol 2011; 47(5):400-407. 5. Borges DML, Sena MF, Ferreira MAF, Roncalli AG.
Mortality for oral cancer and socioeconomic status in Brazil. Cad Saude Publica 2009; (25):321-327. 6. Güneri P, Cankaya H, Yavuzer A, Güneri EA, ErisenL,
Ozkul D, El SN, Karakaya S, Arican A, Boyacioğlu H. Primary oral cancer in a Turkishpopulation sample: association with sociodemographic features, smok-ing, alcohol, diet and dentition. Oral Oncol 2005; 41(10):1005-1012.
7. Warnakulasuriya S. Global epidemiology of oral and oropharyngeal cancer. Oral Oncol 2009; 45(4-5):309-316.
8. Instituto Nacional de Câncer (INCA). Estimativa 2014 – Incidência de Câncer no Brasil. [accessed 2013 Nov 1]. Available from: www.inca.gov.br
9. Minas Gerais. Secretaria de Estado da Saúde de Minas Gerais. Situação do Câncer em Minas Gerais e Suas
Ma-crorregiões de Saúde. Belo Horizonte: Editora SES/MG;
2013.
10. Marshall RJ. Mapping Desease and Mortality Rates Using Empirical Bayes Estimators. Appl Statist 1991; 40(2):283-294.
11. Devine OJ, Louis TA, Halloran ME. Empirical Bayes Methods for stabilizing Incidence Rates before Map-ping. Epidemiol 1994; 5(6):622-630.
12. Antunes JLF, Borrel C, Péres G, Boing AF, Wünsch-Fil-ho V. Inequalities in mortality of men by oral and pha-ryngeal cancer in Barcelona, Spain and São Paulo, Bra-zil, 1995-2003. Int J Equity Health 2008; 7:14.
13. Chiang CT, Lian IB, Su CC, Tsai KY, LinYP, Chang TK. Spatiotemporal Trends in Oral Cancer Mortality and Potential Risks Associated with Heavy Metal Content in Taiwan Soil. Int J Environ Res Public Health 2010; 7(11):3916-3928.
14. Kenneth G, Manton KG, Woodbury MA, Stallard E, Riggan WB, Creason JP, Pellom AC. Empirical Bayes Procedures for Stabilizing Maps of U.S. Cancer Mortal-ity Rates. Journal of the American Statistical Association
1989; 84(407):637-650.
15. Instituto Brasileiro de Geografia e Estatística (IBGE).
Informações socioeconômicas do Estado de Minas Gerais.
[accessed 2014 Apr 1]. Available from: http://www. ibge.gov.br/estadosat/perfil.php?sigla=mg. Accessed: 02/2014.
16. Minas Gerais. Secretaria de Estado da Saúde de Minas Gerais. Apresentação Cartográfica das Macrorregiões
de Saúde do Estado de Minas Gerais. [accessed 2014
Jan 31]. Available from: http://www.saude.mg.gov.br/ index.php?option=com_gmg&controller=document &id=9241
17. Brasil. Ministério da Saúde (MS). Fundação Nacional de Saúde. Manual de Procedimentos do Sistema de
Infor-mações Sobre Mortalidade. Brasília: MS; 2001.
18. Minas Gerais. Secretaria de Estado de Saúde de Mi-nas Gerais. Sistema de Informação sobre a Mortalidade
(SIM). Dados sobre a mortalidade. [accessed 2014 Feb
1]. Available from: http://200.198.43.8/cgibin/def-tohtm.exe?def/Obitos_APVP_Gerais.def
19. Brasil. Ministério da Saúde (MS). Departamento de Informática do SUS. Informações de Saúde (TABNET). Estatísticas Vitais – Mortalidade e Nascidos Vivos.
Mor-talidade geral pela CID-10. Minas Gerais. [accessed
2014 Feb 1]. Available from: http://tabnet.datasus.gov. br/cgi/deftohtm.exe?sim/cnv/obt10mg.def
20. Organização Mundial da Saúde (OMS). Classificação estatística internacional de doenças e problemas relacio-nados à saúde. 10ª revisão. São Paulo: EDUSP; 1994. V.1. 21. Nogueira LT, Rêgo CFN, Gomes KRO, Campelo V. Re-liability and validity of death certificates specifying oral cancer as cause of death in Teresina, Piauí State, Brazil, 2004-2005. Cad Saude Publica 2009; 25(2):366-374. 22. Queiroz RCS, Mattos IE, Monteiro GTR, Koifman S.
Reliability and accuracy of oral cancer as the reported underlying cause of death in the Municipality of Rio de Janeiro. Cad Saude Publica 2003; 19(6):1645-1653. 23. Carvalho AXY, Silva GDM, Júnior GRA,
Albuquer-que PHM. Bayesian rates for homicide mapping in Brazilian municipalities. Cad Saude Publica 2012; 28(7):1249-1262.
24. Instituto Brasileiro de Geografia e Estatística (IBGE). Bases cartográficas do Brasil. [accessed 2014 Apr 1]. Available from: www.ibge.gov.br
25. Instituto Nacional de Pesquisas Espaciais (INPE). Pro-grama Computacional TerraView ®. [accessed 2014 Apr 1]. Available from: www.inpe.gov.br
26. Knorr-Held L, RaBer G. Bayesian Detection of Clusters and Discontinuities in Disease Maps. Biometrics 2000; 56(1):13-21.
27. Pourhoseingholi MA, Mohsen Vahedi M, Baghestani AR, Abadi A. Bayesian correction for mortality trend of oral cavity cancer. Gastroenterology and Hepatology
From Bed to Bench 2012; 5(Supl. 1):8-12.
28. Maciel SSSV, Maciel WV, Silva RB, Sobral LV, Souza IRS, Siqueira MJ. Morbidity and mortality from can-cers of the mounth and pharinx in Brazilian capitals.
Journal of the Medical Association of Rio Grande do Sul-
AMRIGS 2012; 56(1):38-45.
29. Boing AF, Peres MA, Antunes JLF. Mortality from oral and pharyngeal cancer in Brazil: trends and regional patterns, 1979-2002. Rev Panam Salud Publica 2006; 20(1):1-8.
30. Gois Santos VT, Santos VS, Carvalho RAS, Guedes SAG, Trento CL. Mortality from oral cancer in Araca-ju/SE, Brazil: 2000-2009. Journal of Dentistry of the Sao
Paulo State University - UNESP 2013; 42(3):204-210.
31. Biazevic MGH, Castellanos RA, Antunes JLF, Mi-chel-Crosato E. Trends in oral cancer mortality in the city of São Paulo, Brazil, 1980-2002. Cad Saude Publica
2006; 22(10):2105-2114.
Artigo apresentado em 09/03/2015 Aprovado em 24/11/2015