Consequences for Future Return with Earnings Management through
Real Operating Activities*
César Medeiros Cupertino
Universidade Federal de Santa Catarina, Centro Socioeconômico, Departamento de Ciências Contábeis, Florianópolis, SC, Brazil
Antonio Lopo Martinez
FUCAPE Business School, Departamento de Contabilidade, Vitória, ES, Brazil
Newton Carneiro Affonso da Costa Jr.
Universidade Federal de Santa Catarina, Centro Socioeconômico, Departamento de Economia e Relações Internacionais, Florianópolis, SC, Brazil
Received on 09.04.2015 – Desk acceptance on 09.16.2015 – 3rd version approved on 04.02.2016.
ABSTRACT
This article analyzes earnings management through real operating activities by firms in the Brazilian capital market. This way of mani-pulating outcomes takes place when managers make suboptimal decisions in terms of timing and volume of operating activities. This study tests the hypothesis that firms engaged in earnings management through real operating activities might have a negative impact on future returns. Our analysis is restricted to nonfinancial firms listed on the Brazilian Securities, Commodities, and Futures Exchange (BM&FBOVESPA) with annual data made available by the Economatica® for the years from 1989 to 2012. Empirical tests involving re-gression on panel data and estimation of future firm returns and outcomes indicate a negative impact on return on assets (ROA) related to manipulation through real operating activities. This finding is useful for several stakeholders. It demonstrates that manipulation through real operating activities takes place in the Brazilian capital market, suggesting that earnings management extends beyond discretionary accounting choices in this country. The main contribution is demonstrating a negative relation between earnings management by using real operating activities and future returns. This finding is relevant for investors, particularly for the purposes of comparison and valuation of securities.
Keywords:earnings management, operational decisions, real operating activities, future returns.
1 INTRODUCTION
outcomes, when an entity’s performance does not match forecasts.
The hypothesis underlying this study is related to the impact of RAM on organizations’ future returns. In ge-neral, earnings management distorts the financial status of a given firm, it has a negative impact on the quality of accounting figures disclosed and increases informa-tion asymmetry between managers and stakeholders (Ge, 2010). When the outcome is manipulated throu-gh operational decisions, a firm deviates from its op-timum business performance and long-term financial implications emerge (Gunny, 2010). Empirical evidence (Gunny, 2010; Roychowdhury, 2006; Li, 2010) shows that manipulation through RAM affects firms’ cash flow and it is likely to increase volatility. Future cash flow fo-recasts incorporated into share price are readjusted only when investors become aware of manipulation.
Brazil suffers from disclosure issues related both to the quality of financial statements and the consistency of their publication (Lopes & Walker, 2008). Galdi (2008) argues that powerful influence of a country’s taxation rules on financial statements and weak enforcement mechanisms are among the factors that contribute to reduce the relevance of accounting figures to a low level.
In this scenario, there is a delay before investors identify the practice of earnings management through real operating activities, and within this period they fail to adjust forecasts to firm’s performance. This fact, in turn, constitutes an incentive for manipulation. Whe-reas engaging in RAM managers may sacrifice future returns to manipulate current outcomes (Gunny, 2010), a negative relation between RAM and return on assets (ROA) is expected in subsequent periods, and this is the essence of our research hypothesis:
• There is a negative relationship between earnings
management through real operating activities and the firm’s future returns.
The next section consists in a literature review, co-vering the current state of the art and illustrating the foundations of our research hypothesis. This is followed by an explanation of the methodology and a presenta-tion of the outcomes observed. The paper is concluded with a synthesis of knowledge.
This article analyzes earnings management through real operating activities, by means of data for the years from 1989 to 2012 obtained from a sample of compa-nies listed on the Brazilian Securities, Commodities, and Futures Exchange (BM&FBOVESPA). The term “earnings management” describes the decision made by some managers to employ accounting methods or direct operating activities in order to meet specific goals con-cerning the outcomes reported in financial statements. Earnings management for such purposes is classified by considering if the methods affect the accrual-based accounting process or normal operation (Enomoto, Ki-mura, & Yamaguchi, 2015). The first approach is known as “accrual-based management” (ABM) and the second as “real activities management” (RAM).
Based on the existing literature, Martinez (2013, p. 5) defined earnings management as the practice of using discretionary accounting choices (in recognition and measurement), operational decisions, and/or crite-ria for disclosing financial statements, within the limits of accounting standards, in order to change the earnin-gs reported, for influencing perception of the under-lying economic facts.
Earnings management is a relevant subject in the academic literature (Kothari, 2001; Santos & Paulo, 2006). Dechow, Ge and Schrand (2010) stand out by contributing to raise awareness about earnings manage-ment and how this practice negatively affects the firm. One reason for this interest lies on the fact that book profit is used for several purposes, such as contractual obligations (e.g. debt covenants), asset valuation, and executive remuneration and bonus plans (e.g. executive equity compensation). Therefore, accounting data pro-vide relevant informational content that is useful for a wide range of stakeholders. For instance, creditors use the figures reported to assess aspects related to firms’ financial health, credibility, and viability (Ge, 2010). In turn, shareholders use earnings, among other indi-cators, to monitor operational performance. However, conclusions on a given entity’s performance may be er-roneous if shareholders are unable to identify and adjust the effects of earnings management embedded in finan-cial statements. This distortion becomes clear in future
2 LITERATURE REVIEW
2.1 Real Activities Management
RAM takes place when managers make suboptimal decisions on timing and volume of operational activities (Xu, 2008; Gunny, 2010). This practice differs from ma-nipulation by accruals, because it involves activities re-lated to the firm’s actual business activities. It is hard for
manipula-tion through real operating activities is more difficult than detecting ABM (Zang, 2012).
As defined by Ewert and Wagenhofer (2005, p. 1102), “real earnings management changes the timing or structuring of real transactions,” so “real earnings management implies that the manager deviates from an otherwise optimal plan of actions only to affect ear-nings, thus, imposing a real cost to the firm.” In turn, Roychowdhury (2006, p. 337) provides the following concept: “Departures from normal operational practi-ces, motivated by managers’ desire to mislead at least some stakeholders into believing certain financial re-porting goals have been met in the normal course of operations.” A wider definition has often been used; it claims that RAM is “a purposeful action to alter repor-ted earnings in a particular direction, which is achie-ved by changing the timing or structuring of an ope-ration, investment or financing transaction” (Gunny, 2010; Zang, 2012; Joosten, 2012). RAM can be achieved by restricting operational activities, such as delaying a new project that could increase production capacity or cutting discretionary expenses, e.g. expenditure on trai-ning personnel and marketing.
Graham, Harvey and Rajgopal (2005) analyzed the main factors that influence disclosure level in finan-cial reports. They found that executives assign gre-at importance to profit targets, either to meet fore-casts made public by analysts or maintain the current period’s outcomes in line with outcomes reported for previous financial periods. The authors also claim that executives aimed to manipulate outcomes through ope-rational decisions even when aware that the procedure reduces the firm’s financial value, relying on the belief that they might gain credibility by hitting outcome tar-gets. This view is proposed by Burgstahler and Dichev (1997), who claim that firms gain prestige from several stakeholders – creditors, suppliers, customers, among others – when they report expectations of future gro-wth. Graham, Harvey and Rajgopal (2005) add that exe-cutives are more keen to employ RAM if the sacrifice involved is not too big, i.e. the benefits outweigh the costs. Authors such as Demski (2004) and Ewert and Wagenhofer (2005) point out that RAM is chosen when the costs for implementing it are low when considering the risks associated with manipulation by accruals.
Zang (2012) claims that the risk of detection is lower by using RAM than ABM, since manipulation through RAM is not covered by the limits set out by the gene-rally accepted accounting principles (GAAP) (Barton & Simko, 2002). For instance, if management resorts to RAM by cutting research and development costs, this measure is not subject to scrutiny by regulating agencies or auditors. Additionally, reversal of accruals brings res-trictions to accounting flexibility, i.e. indiscriminate use of discretionary accruals is easily detected.
Although RAM offers some advantages when com-pared to manipulation by accruals, it has certain restric-tions, too. RAM has a direct impact on cash flow and,
as a result, it is more expensive from a financial pers-pective. Ge (2010) noticed how RAM masks current fi-nancial performance, destroys feasible long-term com-petitive advantages, and potentially reduces the firm’s financial value. Thus, outcomes that have been manipu-lated through RAM are unreliable measures distorting the quality of profits and they increase asymmetry be-tween managers and external stakeholders. Zang (2012) argues it is unlikely that managers restrict themselves to use RAM for manipulation.
The studies conducted in Brazil seem to be incipient regarding ABM models. Despite the pertinent criticism by Paulo (2007), most scholars have not used rather re-fined models to estimate discretionary accruals, instead they stick with the modified Jones and KS models, ex-cept for efforts to adjust by performance or sector and analysis of panel data. The same trend may be observed in the international literature, because since 2005 it has converged to models aimed at earnings management by operational decisions.
Although this subject still needs further discussion in the Brazilian literature, some recent doctoral theses address earnings management by operational decisions. Machado (2012) studied the relation of earnings mana-gement with executive compensation. In turn, Cuper-tino (2013) focused on, among other issues, investors’ perception of the effects of this manipulation type, as well as the relation between earnings management stra-tegies and their determining costs and the impact on firms’ future performance. It is also worth mentioning Almeida-Santos, Verhagem and Bezerra (2011) and Rey (2011), who incorporated operational decisions into their earnings management models.
Cupertino (2013) observed that the adoption of the International Financial Reporting Standards (IFRS) in Brazil triggered a shift from earnings management by discretionary accruals to manipulation by operational decisions. In short, there was an increase in earnings management by operational choices and a decrease in management by accruals.
Reis, Cunha and Ribeiro (2014) showed that, among the main management practices by real operating de-cisions, the companies listed on the IBrX did not use volume of sales and production levels to increase or decrease book outcomes. Moreover, manipulation of accounting accruals may have been preferred over ope-rational decisions, since it is usually not reflected on cash flows and does not influence the firms’ operational structure.
2.2 Evidence on the Consequences of RAM
Never-theless, when firms face barriers to manage earnings by accruals, it is more likely that manipulation is achieved through real operating activities. For instance, Ewert and Wagenhofer (2005) found that the more rigid the accounting rules, the greater the barriers preventing fir-ms from manipulating outcomes by accruals. In turn, this restriction induces managers to resort to real opera-ting activities in order to manipulate outcomes, despite the greater financial costs involved (Oswald & Zarowin, 2007). Consequently, earnings management is not re-duced in the presence of stricter accounting standards, rather only the modus operandi changes.
Regardless of the method chosen to deal with ear-nings management – accruals or operational decisions –, the primary goal is inducing stakeholders to an er-roneous perception of the firm’s actual financial status. Strategies differ in terms of their impact on cash flow, among other aspects. Specifically, real operating activi-ties consume resources and they divert firms from nor-mal business practices.
The biased scenario created by RAM hides the ne-gative consequences of firms’ performance (Graham, Harvey, & Rajgopal, 2005; Gunny, 2010; Roychowdhury, 2006), increases volatility of future cash flows (Ge, 2010), and reduces firm value (Xu, 2008). These conse-quences of using RAM may be illustrated by discussing some techniques employed to achieve manipulation.
A technique consists in offering discount on prices charged for goods to boost sales, which is focused on the short term and has the effect of increasing earnings for the current period. The outcome reported for the period increases and a positive profit margin remains after the discount. However, this kind of discount has an adverse effect on future earnings, since consumers are no longer willing to buy when price come back to their previous levels. According to Gunny (2010), this impact on future sales may lead to lower profit margins in subsequent periods.
Another method to boost sales is increasing credit, offering more flexible terms, such as longer settlement periods or less stringent guarantee requirements. Al-though this may improve sales during the current pe-riod, the practice also increases the risk of nonpayment (Ge, 2010) and it forces a review of cash flow mana-gement, since receipts are spread more thinly across a
larger number of installments.
Alternatively, production may be increased in order to dilute fixed costs across a larger number of units, ac-cumulating larger stocks of finished products to be sold during subsequent financial periods. However, if it is hard for the firm to sell this excessive production, i.e. if future demand is lower than the volume of products produced in previous periods, the cost to maintain sto-cks has a negative impact on the outcomes of the perio-ds affected (Xu, 2008).
Regarding the effects of these techniques, Li (2010) argues that the relation between abnormal levels of ope-rational activity and future firm performance is an em-pirical issue, since the various management techniques have different consequences for cash flow during the financial period. For instance, both cutting discretiona-ry expenses and increasing production levels consist in techniques to adjust operations in order to achieve real operating activities management. However, whereas the first method increases cash flow during the period (as-suming that discretionary expenses are paid in cash or cash equivalents), the second option reduces cash flow, assuming sale volumes are unchanged. Additionally, RAM does not always affect cash flow and profits in the same direction (Gunny, 2010). Although increasing production to reduce the cost of products may increase profits, it may reduce cash flow if the increase in sales is not enough to absorb the increase in unsold stocks.
Academic interest in the relation between RAM and profitability of shares is recent (Zang, 2012). Gunny (2010) published a pioneering study in the area, where four proxies for activities linked to manipulation throu-gh real operating activities were analyzed with data from 1988 to 2000 on U.S. firms. It was found that all proxies tested were associated with significantly lower perfor-mance both in terms of profitability of shares and future cash flow. Li (2010) confirmed the findings of Gunny (2010) by using an extended dataset from 1988 to 2008 and the study also showed that market’s inefficiency to identify RAM and correct forecasts for share prices led to abnormal return of 6% per year for a hedging strate-gy. These findings contrast with evidence reported by Bhojraj, Hribar, Picconi and McInnis (2009), where the return per share was lower in years following periods with use of RAM.
3 METHODOLOGY
3.1 Data and Sample Selection
The sample comprised companies listed on the BM&FBOVESPA for which financial and accounting data were made available by the Economatica®. Accoun-ting data were extracted from financial statements of individual companies.
sectors are heavily regulated, there is proprietary legis-lation, and these specific standards have an idiosyn-cratic effect on accounting (Gunny, 2010). Companies classified by Economatica® as “Other Sector” were also excluded, because they are not associated with sectors covered by this study.
Observations were collected on an annual basis for the period from 1989 to 2012. Although the Economa-tica® provides data going back to 1986, the small num-ber of companies tracked between 1986 and 1988 means that excluding these 3 years does not lead to relevant loss of information. Furthermore, this procedure con-siderably reduced the number of extreme observations (outliers). Thus, 1989 was chosen as the initial year of analysis. In turn, 2012 was the final year of analysis be-cause it was the last year for which data were available on the Economatica® when the research was conducted. To neutralize the effects arising from changes in the purchasing power of money, historical data was col-lected considering the adjustment for inflation. Speci-fically, historical data has been adjusted according to the Brazilian Broad National Consumer Price Index (IPCA), provided by the Brazilian Institute of
Geogra-phy and Statistics (IBGE), converted to values for May 2013.
Sample size for identifying RAM refers to the num-ber of observations in the data used for regressions to estimate the expected level of accruals and real opera-ting activities (and, as a result, for residuals, which re-present the level of earnings management).
3.2 Models of Real Activities Management
Identifying manipulation through real operating ac-tivities requires empirical application of models. These models estimate the “normal” level of operational acti-vities, thus their regression residuals represent the “ab-normal” level, i.e. they are proxies for management va-riables. In other words, the abnormal component of real operating activities consists in the difference between the actual value observed and the estimate obtained by applying the models (Gunny 2010; Roychowdhury, 2006).
The abnormal level of discretionary expenses was es-timated by using a model derived from the seminal stu-dy by Dechow, Kothari and Watts (1998), and Roycho-wdhury (2006), formulated as follows:
1
2
3
Disc
Et /At-1= α0 + α1(1/At-1) + β2(St /At-1) + εt
Prod
t /At-1= α0 + α1(1/At-1) + β1(St /At-1) + β2(ΔSt /At-1) + β2(ΔSt-1 /At-1) + εt
OCFt /At-1= α0 + α1(1/At-1) + β1(St /At-1) + β2(ΔSt /At-1) + εt
whereDiscE represents discretionary expenses, A is
total assets, and S is sale revenues. For the sake of sim-plicity, the subscript “i” was suppressed hereafter.
Equation (1) resorts to specification with panel data, considering all shares and the entire sampling period. Additionally, Hausman test was employed to detect correlated random effects. The model defines discre-tionary expenses for the current period as a function of
the current level of sales, so that the regression residual represents the magnitude of manipulation by cutting discretionary expenses (RAMDEt).
The second proxy used to capture manipulation through real operating activities is abnormal produc-tion levels (RAMPRODt), proposed by Dechow, Kotha-ri and Watts (1998) and applied by Roychowdhury (2006):
where Prod is the cost of production and Δ is the irst diference operator.
Martinez and Cardoso (2009) stress that the functio-nality of this formulation allows it to be applied to any sector. In turn, Roychowdhury (2006) explains that in-cluding the intercept standardized by total assets allows the independent variable to be diferent from zero even when there are no sales for the period t or t-1. Gunny (2010) explains that analysis according to production costs – rather than by cost of products sold or changes in inventory – is a relevant consideration to avoid the distorting inluence of ABM. For instance, a manager’s decision to delay writing of a stock of obsolete products,
to reduce the cost of products sold, might be manifested as an abnormally low cost of products sold. As a result, if cost of products sold was used as the variable of analy-sis, the efect of ABM could be erroneously classiied as the efect of RAM. In contrast, by using production costs – i.e. cost of products sold and diference in inventory –, the efect of accruals could not be confused with that of real operating activities, because the reduced cost of products sold might be compensated by an increased di-ference in inventory.
where OCF is operational cash flow.
Just as in formulas (1) and (2), regressions were analyzed with panel data specification, by using Haus-man test to detect correlated random effects. The equa-tion specified in (3) defines the expected operaequa-tional cash flow as a linear function of sale revenues and change in sale revenues.
Manipulation through real operating activities to in-crease earnings may cause one of, or a combination of, the following efects (Cohen, Dey, & Lys, 2008): abnor-mally low operational cash low; abnorabnor-mally low discre-tionary expenses; and abnormally high production costs. For the purposes of illustration, variables representing abnormal operational cash low and abnormal discretio-nary expenses were multiplied by -1. As a result, high values for the proxies for abnormal cash low (RAMCFO) and abnormal discretionary expenses (RAMDE) indicate greater degrees of RAM (Roychowdhury, 2006; Cohen, Dey, & Lys, 2008; Cohen & Zarowin, 2010; Zang, 2012). Abnormal production costs were not multiplied by -1, because high values of RAMPROD already indicate high degrees of manipulation by RAM.
These three measurements of earnings manage-ment were also combined into an aggregated metrics, in order to identify the overall effect of manipulation. This metrics is the variable RAM, which captures the total impact of manipulation through real operating activities. It comprises the sum of abnormal cash flows (RAMOCF), abnormal discretionary expenses (RAMDE), and abnormal production costs (RAMPROD). Since all of these measurements are standardized by total assets for the preceding financial period, they may be summed and the outcomes compared across companies of di-fferent sizes. Thus, high values for the variable RAM suggest intense use of real operating activities to mani-pulate the outcomes for the financial period.
As explained by Cohen, Dey and Lys (2008), diffe-rent measurements of manipulation have diffediffe-rent im-pacts on the outcomes reported, thus concentration in a single metrics could dilute and mask individual effects. Therefore, where applicable, the outcomes of the tests conducted are shown both for each variable that captu-re the individual effects of manipulation through captu-real operating activities (RAMCFO, RAMDE and RAMPROD) and for the combined metrics (RAM).
3.3 Tests of the Hypothesis
The research hypothesis predicts a negative relation between using RAM and future ROA. Gunny (2010) argues that it is not clear a priori whether there is a re-lation between using RAM and future firm
performan-ce. In this study, two indicators were chosen to test for such a relation and their behavior was analyzed within the year when manipulation is practiced and during the three periods before and after manipulation. Two proxies for future returns were chosen: profitability of shares, in the form of adjusted ROA (ROAAdj), and ad-justed operational cash flow (OCFAdj), both calculated as the difference from the median for that indicator for the same year and business sector of the security concerned.
In order to achieve a more detailed analysis, firms included in the sample were classified into subtypes in terms of whether they met benchmarks and the types of RAM employed. The classification used is based on parameters described by Gunny (2010) and it divides firms as follows:
• Beating: takes the value 1 if (a) earnings before interest and taxes (EBIT) standardized by total as-sets for the previous period are greater than 0.01; (b) change in earnings per share from t-1 to t is greater than R$ 0.10; (c) percentage variation in EBIT from
t-1 to t is greater than 1%. Otherwise, the value of this variable is 0.
• Meeting: takes the value 1 if (a) EBIT standardi-zed by total assets for the previous period ranges from 0 to 0.01; (b) change in earnings per share from t-1 to
t is greater than or equal to R$ 0.00 and lesser than R$ 0.10; (c) percentage variation in EBIT from t-1 to
t ranges from 0 to 1%; (d) Beating is not equal to 1. Otherwise, the value of this variable is 0.
• Closing: takes the value 1 if (a) EBIT standardi-zed by total assets for the previous period ranges from -0.01 to 0; (b) change in earnings per share from t-1
to t is greater than or equal to -R$ 0.10 and lesser than R$ 0.00; (c) percentage variation in EBIT from t-1 to t
ranges from -1% to 0; (d) Beating and Meeting are not equal to 1. Otherwise, the value of this variable is 0.
• Missing: takes the value 1 if (a) EBIT standardized by total assets for the previous period is lesser than -0.01; (b) change in earnings per share from t-1 to t is lesser than -R$ 0.10; (c) percentage variation in EBIT from t-1 to t is lesser than -1% and 0; (d) Beating, Me-eting, and Closing are not equal to 1. Otherwise, the value of this variable is 0.
This classification was adopted to analyze the effect of RAM both on ROAAdj and OCFAdj. Gunny (2010) warned about the difficulties to interpret the values identified in this breakdown, due to the syste-matic variation assigned to current return, firm size, or growth opportunities. Thus, the following regres-sion was estimated:
4
ROAAdj
t+1 or OCFAdjt+1= γ0 + γ1Suspiciont + γ2RAMnt +γ3Suspiciont * RAMnt + γ4ROAt + γ5LogASSETt + γ6MtBt + εt
where ROAAdj(OCFAdj) is adjusted ROA (cash low), calculated as the diference in ROA (cash low) of a
Sus-piciont is a binary variable that takes the value 1 if the irm-year observation its one of the benchmarks deined earlier in this section to indicate suspect irms, RAMnt is RAM, where n represents DE (discretionary
expen-ses), PROD (production costs) or OCF (operational cash low), LogASSET is the natural logarithm of total assets, and MtB is the market to book coeicient.
he next section describes the results.
4 ANALYSIS OF RESULTS
4.1 Impact of RAM on Future Returns
The hypothesis assumes there is a negative relation between using RAM and future firm returns. Panel A in Table 1 shows the results for ROA, adjusted by the median for corresponding year and firm business sec-tor, covering the current period and the three years before and after the year under analysis. Panel B shows the results for cash flow, adjusted in a similar manner to ROA, i.e. expressed as the difference in relation to the median for corresponding year and firm business sector. It is also worth highlighting that the indicators of returns (ROA & cash flow) were “Winsorized” to a limit of 1.5% at the extremes of the distribution to reduce the effect of outliers.
Table 1 is divided into the different types of ma-nipulation through RAM – RAM
DEt, RAMPRODt and
RAM
OCFt. Additionally, firms are also classified into
categories according to whether they met the criteria for the management benchmarks. Initially, the results are shown for returns according to adjusted ROA (Pa-nel A) and then for returns according to adjusted cash flow (Panel B). In both panels, it was found that around 11% of the instances of management by reduction of discretionary expenses (435 observations), produc-tion costs (384 observaproduc-tions), and sales manipulaproduc-tion (341 observations) met one of the benchmarks.
Except for manipulation by RAM
OCFt, adjusted
ROA for the year prior to management (t-1) for fir-ms meeting one of the benchmarks is lower than the mean for all firms in the sample (“All” row) than the mean for firms that beat (“Beating” row), margi-nally missed (“Closing” row) or significantly missed (“Missing” row) benchmarks. For instance, conside-ring manipulation by cutting discretionary expenses (RAMDEt), firms that met benchmarks had an adjusted ROA of -8.26%, compared to returns of -4.71% for all firms and compared to -3.83%, -6.86%, and -5.23% for firms classified as “Beating,” “Closing,” and “Missing,” respectively.
Considering the percentage variation (data not shown in tables) in adjusted ROA at t+1, t+2, and t+3, firms classified as “Meeting” exhibited worse return than “All,” “Beating,” “Closing,” and “Missing” fir-ms, regardless of the type of manipulation by RAM employed. The rows labeled as RAM
DEt, RAMPRODt
and RAM
OCFt contain the results for firms in the last
quintile of the distribution series for manipulation by cutting discretionary expenses, production costs, and sales manipulation, respectively. As such, the firms that mostly managed by cutting discretionary expen-ses had adjusted ROA of -6.66% during the year of manipulation and -8.14%, -9.56, and -11.31% at t+1,
t+2 and t+3, respectively. Within this subset of firms, those that met benchmarks (Meeting *RAM
DEt)
exhi-bited an adjusted ROA even worse, with -11.45% du-ring the year of manipulation and -14.77%, -16.53%, and -19.65% at t+1, t+2 and t+3, respectively. For fir-ms that met benchmarks, but were not within the last quintile for manipulation by cutting discretionary ex-penses – Meeting (without RAM
DEt) –, adjusted ROA
was -6.18%, -7.39%, -9.52%, and -9.29% at t, t+1, t+2
and t+3, respectively.
The results of analyses of other methods of mani-pulation through RAM – RAM
PRODt and RAMOCFt – led
to the same conclusions. Evidence suggests that, con-cerning ROA, firms that engage in RAM exhibit worse future returns than the average for their respective in-dustrial sectors, as well as firms that do not manipula-te their end of year outcomes.
Panel B in Table 1 displays the results of the analy-sis taking adjusted cash flow as the metrics for return. It shows that the adjusted cash flow of firms meeting the benchmarks drops over the three years following manipulation through RAM. Firms that are in the last quintile of the distribution for manipulation through RAM and also met benchmarks exhibited worse future cash flow than those in the other quintiles, during the first year after manipulation (in the case of RAM
DEt)
or the first two years after manipulation (in the case of RAM
PRODt). The same patterns were not observed
for manipulation by sales (RAMOCFt), since firms that managed most (i.e. those in the last quintile) and met benchmarks exhibited a higher cash flow to other firms (i.e. to those in quintiles 1 to 4) that met benchmarks. This evidence confirms that firms that manage earnin-gs by cutting discretionary expenses and by manipula-ting production costs have worse future cash flow than those that do not manipulate end of year outcomes. However, the same result was not observed when ma-nipulation is achieved through RAMOCF.
to systematic variation of indicators of future returns (ROA and cash flow) with current return, firm size,
and growth opportunities. Equation (4) was estimated for this reason.
Table 1 Returns (ROA and cash flow) by benchmarks and RAM categories
Mean
N Obs. Shares ROAAdjt-3 ROAAdjt-2 ROAAdjt-1 ROAAdjt ROAAdjt+1 ROAAdjt+2 ROAAdjt+3 Panel A – Adjusted ROA
RAMDEt
All 4,058 891 -0.0436 -0.0455 -0.0471 -0.0501 -0.0518 -0.0556 -0.0585
Beating 3,806 951 -0.0363 -0.0372 -0.0383 -0.0371 -0.0412 -0.0456 -0.0486
Meeting 435 1,012 -0.0742 -0.0749 -0.0826 -0.0752 -0.0923 -0.1119 -0.1167
Closing 222 498 -0.0617 -0.0800 -0.0686 -0.0813 -0.0909 -0.0618 -0.0802
Missing 2,601 775 -0.0530 -0.0562 -0.0523 -0.0898 -0.0794 -0.0816 -0.0852
RAMDEt 825 706 -0.0784 -0.0778 -0.0752 -0.0666 -0.0814 -0.0956 -0.1131
Meeting * RAMDEt 114 1,167 -0.1176 -0.1108 -0.1186 -0.1145 -0.1477 -0.1653 -0.1965
Meeting (without RAMDEt) 321 995 -0.0574 -0.0620 -0.0701 -0.0618 -0.0739 -0.0952 -0.0929 RAMPRODt
All 3,339 930 -0.0429 -0.0466 -0.0499 -0.0535 -0.0567 -0.0599 -0.0643
Beating 3,194 977 -0.0357 -0.0383 -0.0412 -0.0427 -0.0465 -0.0506 -0.0547
Meeting 384 1,008 -0.0715 -0.0778 -0.0889 -0.0844 -0.1052 -0.1284 -0.1339
Closing 185 455 -0.0616 -0.0802 -0.0704 -0.0842 -0.0938 -0.0613 -0.0934
Missing 2,139 800 -0.0530 -0.0584 -0.0566 -0.0950 -0.0864 -0.0881 -0.0925
RAMPRODt 683 761 -0.0560 -0.0614 -0.0789 -0.0902 -0.0872 -0.0738 -0.0748
Meeting * RAMPRODt 77 920 -0.1082 -0.1204 -0.1657 -0.1577 -0.1646 -0.1667 -0.1227
Meeting (without RAMPRODt) 307 1,034 -0.0621 -0.0667 -0.0693 -0.0656 -0.0907 -0.1196 -0.1363 RAMOCFt
All 3,225 1,027 -0.0215 -0.0248 -0.0272 -0.0311 -0.0377 -0.0425 -0.0453
Beating 3,103 1,051 -0.0188 -0.0209 -0.0231 -0.0241 -0.0311 -0.0366 -0.0392
Meeting 341 1,174 -0.0136 -0.0172 -0.0127 -0.0149 -0.0398 -0.0484 -0.0551
Closing 160 564 -0.0205 -0.0390 -0.0224 -0.0409 -0.0634 -0.0424 -0.0551
Missing 2,066 920 -0.0259 -0.0311 -0.0282 -0.0634 -0.0621 -0.0639 -0.0689
RAMOCFt 659 893 -0.0272 -0.0399 -0.0527 -0.0777 -0.0698 -0.0646 -0.0718
Meeting * RAMOCFt 58 1,099 -0.0243 -0.0346 -0.0459 -0.0461 -0.0542 -0.0774 -0.0976
Meeting (without RAMOCFt) 283 1,179 -0.0115 -0.0136 -0.0060 -0.0084 -0.0367 -0.0422 -0.0461 N Obs. Shares OCFAdjt-3 OCFAdjt-2 OCFAdjt-1 OCFAdjt OCFAdjt+1 OCFAdjt+2 OCFAdjt+3
Panel B – Adjusted cash flow RAMDEt
All 4,058 891 -0.0013 -0.0028 -0.0026 -0.0019 -0.0010 0.0002 -0.0003
Beating 3,806 951 -0.0002 -0.0018 -0.0009 0.0020 0.0010 0.0011 0.0010
Meeting 435 1,012 0.0030 -0.0036 0.0078 0.0113 0.0057 0.0004 0.0050
Closing 222 498 -0.0162 -0.0008 -0.0072 -0.0159 -0.0131 0.0124 -0.0051
Missing 2,601 775 -0.0042 -0.0013 -0.0030 -0.0228 -0.0106 -0.0078 -0.0068
RAMDEt 825 706 -0.0051 -0.0081 -0.0078 0.0067 0.0010 0.0000 -0.0070
Meeting * RAMDEt 114 1,167 -0.0267 -0.0250 0.0020 0.0129 -0.0058 0.0051 0.0306
Meeting (without RAMDEt) 321 995 0.0151 0.0041 0.0098 0.0108 0.0092 -0.0010 -0.0017 RAMPRODt
All 3,339 930 -0.0015 -0.0024 -0.0017 0.0007 -0.0000 -0.0000 -0.0009
Beating 3,194 977 -0.0003 -0.0015 -0.0001 0.0026 0.0009 0.0006 -0.0005
Meeting 384 1,008 0.0030 -0.0036 0.0053 0.0142 0.0074 -0.0015 -0.0022
Closing 185 455 -0.0169 -0.0006 -0.0054 -0.0142 -0.0096 0.0135 -0.0045
Missing 2,139 800 -0.0042 -0.0011 -0.0019 -0.0214 -0.0096 -0.0087 -0.0086
RAMPRODt 683 761 -0.0002 -0.0163 -0.0169 -0.0483 -0.0136 -0.0063 0.0022
Meeting * RAMPRODt 77 920 -0.0123 -0.0329 -0.0270 -0.0307 -0.0337 -0.0292 0.0045
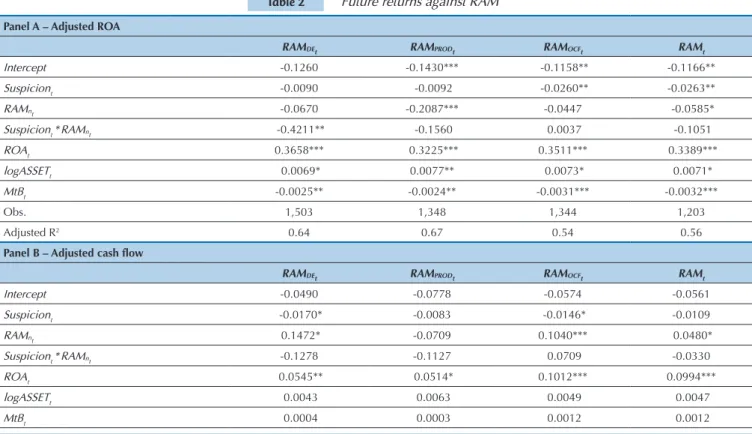
In turn, Table 2 shows the coefficients estimated by the regression of future returns against measurements of RAM. Panel A shows the results when adjusted ROA (difference in relation to the median for the respective business segment) was used as a metrics for return and Panel B shows the results of regression by using adjus-ted cash flow. Suspiciont * RAMnt represents the
inte-raction term for firms that met benchmarks and mani-pulated by using RAMnt, where n may be DE, PROD or
OCF. Since the purpose is testing for the overall effect of RAM, analyses were focused on the dependent varia-ble RAMt. Nevertheless, coefficients for manipulation broken down by the different types of RAM are also provided.
Table 1 Cont.
The sample comprises firm-year observations for 1989-2012. For each measurement of real activities management (RAMDEt, RAMPRODt and RAMOCFt), firms were
classi-fied into the following categories:
- Beating: takes the value 1 if (a) EBIT standardized by total assets for the previous period is greater than 0.01; (b) change in Earnings per share from t-1 to t is greater than R$ 0.10; (c) percentage variation in EBIT from t-1 to t is greater than 1%. Otherwise, the value of this variable is 0.
- Meeting: takes the value 1 if (a) EBIT standardized by total assets for the previous period ranges from 0 to 0.01; (b) change in Earnings per share from t-1 to t is greater than or equal to R$ 0.00 and lesser than R$ 0.10; (c) percentage variation in EBIT from t-1 to t ranges from 0 to 1%; (d) Beating is not equal to 1. Otherwise, the value of this variable is 0.
- Closing: takes the value 1 if (a) EBIT standardized by total assets for the previous period ranges from -0.01 to 0; (b) change in Earnings per share from t-1 to t is greater than or equal to -R$ 0.10 and lesser than R$ 0.00; (c) percentage variation in EBIT from t-1 to t ranges from -1% to 0; (d) Beating and Meeting are not equal to 1. Otherwise, the value of this variable is 0.
- Missing: takes the value 1 if (a) EBIT standardized by total assets for the previous period is lesser than -0.01; (b) change in Earnings per share from t-1 to t is lesser than -R$ 0.10; (c) percentage variation in EBIT from t-1 to t is lesser than -1% and 0; (d) Beating, Meeting, and Closing are not equal to 1. Otherwise, the value of this variable is 0.
RAMnt= takes the value 1 if RAMnt (where n may be DE [discretionary expenses], PROD [production costs], or OCF [operational cash flow]) falls within the last
quinti-le. Otherwise, the value of this variable is 0.
ROA_Adj is adjusted return on assets, calculated as the difference in ROA for a specific firm from the median for the same year and the same business sector as the one where the firm operates.
OCF_Adj is adjusted cash flow calculated as the difference in cash flow for a specific firm from the median for the same year and the same business sector as the one where the firm operates.
RAMOCFt
All 3,225 1,027 0.0003 0.0000 -0.0015 -0.0008 0.0002 -0.0001 0.0014
Beating 3,103 1,051 0.0012 0.0009 0.0006 0.0014 0.0012 0.0004 0.0017
Meeting 341 1,174 0.0099 0.0019 0.0124 0.0127 0.0101 0.0048 0.0029
Closing 160 564 -0.0135 0.0001 -0.0106 -0.0162 -0.0126 0.0140 -0.0022
Missing 2,066 920 -0.0014 0.0022 -0.0016 -0.0219 -0.0097 -0.0076 -0.0050
RAMOCFt 659 893 0.0115 0.0086 -0.0021 -0.1229 0.0016 0.0032 0.0126
Meeting * RAMOCFt 58 1,099 0.0395 0.0045 0.0288 -0.1115 0.0374 0.0187 0.0255
Meeting (without RAMOCFt) 283 1,179 0.0038 0.0013 0.0089 0.0396 0.0040 0.0018 -0.0021
Table 2 Future returns against RAM
Panel A – Adjusted ROA
RAMDEt RAMPRODt RAMOCFt RAMt
Intercept -0.1260 -0.1430*** -0.1158** -0.1166**
Suspiciont -0.0090 -0.0092 -0.0260** -0.0263**
RAMnt -0.0670 -0.2087*** -0.0447 -0.0585*
Suspiciont *RAMnt -0.4211** -0.1560 0.0037 -0.1051
ROAt 0.3658*** 0.3225*** 0.3511*** 0.3389***
logASSETt 0.0069* 0.0077** 0.0073* 0.0071*
MtBt -0.0025** -0.0024** -0.0031*** -0.0032***
Obs. 1,503 1,348 1,344 1,203
Adjusted R2 0.64 0.67 0.54 0.56
Panel B – Adjusted cash flow
RAMDEt RAMPRODt RAMOCFt RAMt
Intercept -0.0490 -0.0778 -0.0574 -0.0561
Suspiciont -0.0170* -0.0083 -0.0146* -0.0109
RAMnt 0.1472* -0.0709 0.1040*** 0.0480*
Suspiciont *RAMnt -0.1278 -0.1127 0.0709 -0.0330
ROAt 0.0545** 0.0514* 0.1012*** 0.0994***
logASSETt 0.0043 0.0063 0.0049 0.0047
Tabela 2 Cont.
*, **, and *** indicate that the difference observed between the first and fifth quintiles is different from zero with significance at 10%, 5%, and 1%, respectively. Coefficients were estimated for observations that comprised the sample from 1989 to 2012 by using panel data. Where applicable, the presence of unit roots was duly dealt with. The regression employed was as follows:
Panel A shows the results for analyses using adjusted ROA (difference from median for the firm’s business sector) as a measurement for returns, while Panel B shows the results for analyses using adjusted cash flow. Suspiciont * RAMnt represents the combined effect when firms meet Benchmarks and manipulate by using RAMnt,
where n may be DE, PROD or OCF.
he coeicients calculated for the variables Suspicionte
RAMnt shown in Panel A are negative and signiicant, de-monstrating that irms that meet benchmarks and those that resort to RAM have negative returns at t+1. he com-bined efect of these variables (Suspiciont * RAMnt) is not signiicant, indicating there is no marginal impact resulting from the interaction between these factors. In contrast, the coeicients in Panel B are not signiicant, except for a
signi-icant and positive relation between RAMt and cash low at
t+1. his result is intriguing and it goes against the initial assumptions, showing that RAM has a positive impact on irms’ future cash low. Taken together, this evidence par-tially conirms the hypothesis H1. Speciically, when the measurement of future returns is ROA, a negative relation with earnings management is detected, but the same is not true when the measurement for return is cash low.
Obs. 1,269 1,138 1,184 1,059
Adjusted R2 0.14 0.18 0.14 0.17
4
ROAAdj
t+1 or OCFAdjt+1= γ0 + γ1Suspiciont + γ2RAMnt +γ3Suspiciont * RAMnt + γ4ROAt + γ5LogASSETt + γ6MtBt + εt
5 CONCLUSIONS
The hypothesis formulated and tested in this article predicted there would be a negative relation between the use of earnings management through real operating activities and firms’ future returns. The measurements of future returns were ROA and cash flow. In the case of both measurements for return, the metrics analyzed was deviation from the respective median for the firm’s business sector. Analyses covered returns during ye-ars before and after manipulation and during the year when RAM was used. Additionally, regressions were es-timated for the measurements for return at t+1 with re-gard to the metrics for RAM, controlling the systematic effects of profitability, firm size, and growth opportuni-ties. The results observed provide mixed evidence, par-tially supporting the hypothesis H1. Specifically, when the measurement for future returns is ROA, a negative relation with RAM is detected, but the same is not true when the measurement for returns is cash flow.
The results of this study are useful for stakehol-ders. First, the findings demonstrate the occurrence of manipulation through real operating activities in the Brazilian capital market, indicating that earnings ma-nagement in Brazil goes beyond manipulation through accounting choices. Thus, users of financial statements should not only consider the effects of discretionary ac-cruals, but also observe the effects of operational prac-tices that affect end of year outcomes. This insight is
relevant, because adjustments aimed at pricing in ma-nipulation tend to be effective in proportion to aware-ness of the management techniques applied to disclose data.
Another significant contribution was demonstrating that there is a negative relation between use of earnin-gs management through real operating activities and ROA. This finding is relevant for investors, particularly for the purposes of comparison and valuation of secu-rities, since profitability is an indicator often used when deciding to provide funding and comparing returns be-tween firms in the same sector, among other uses.
References
Almeida-Santos, P. S. A. D., Verhagem, J. A., & Bezerra, F. A. (2011). Gerenciamento de resultados por meio de decisões operacionais e a governança corporativa: análise das indústrias siderúrgicas e metalúrgicas brasileiras. Revista de Contabilidade e Organizações, 5(13), 55-74.
Badertscher, B. A. (2011). Overvaluation and the choice of alternative earnings management mechanisms. he Accounting Review, 86(5), 1491-1518.
Barton, J., & Simko, P. J. (2002). he balance sheet as an earnings management constraint. he Accounting Review, 77(Supplement), 1-27.
Bhojraj, S., Hribar, P., Picconi, M., & McInnis, J. (2009). Making sense of cents: an examination of irms that marginally miss or beat analyst forecasts. he Journal of Finance, 64(5), 2361-2388.
Burgstahler, D., & Dichev, I. (1997). Earnings management to avoid earnings decreases and losses. Journal of Accounting and Economics Properties of Accounting Earnings, 24(1), 99-126.
Cohen, D. A., Dey, A., & Lys, T. Z. (2008). Real and accrual-based earnings management in the pre- and post-Sarbanes-Oxley periods. Accounting Review, 83(3), 757-787.
Cohen, D. A., & Zarowin, P. (2010). Accrual-based and real earnings management activities around seasoned equity oferings. Journal of Accounting and Economics, 50(1), 2-19.
Cupertino, C. M. (2013). Gerenciamento de resultados por decisões operacionais no mercado de capitais brasileiro (Doctoral hesis). Florianópolis, SC: Universidade Federal de Santa Catarina. Dechow, P. M., Ge, W., & Schrand, C. M. (2010). Understanding
earnings quality: a review of proxies, their determinants and their consequences. Journal of Accounting and Economics, 50(2-3), 344-401. Dechow, P. M., Kothari, S. P., & Watts, R. L. (1998). he relation between
earnings and cash lows. Journal of Accounting and Economics, 25(2), 133-168.
Demski, J. S. (2004). Endogenous expectations. he Accounting Review, 79(2), 519-539.
Enomoto, M., Kimura, F., & Yamaguchi, T. (2015, in press). Accrual-based and real earnings management: an international comparison for investor protection (Working Paper). Retrieved from http://dx.doi. org/10.2139/ssrn.2066797
Ewert, R., & Wagenhofer, A. (2005). Economic efects of tightening accounting standards to restrict earnings management. Accounting Review, 80(4), 1101-1124.
Galdi, F. C. (2008). Estratégias de investimento em ações baseadas na análise de demonstrações contábeis: é possível prever o sucesso?
(Doctoral hesis). São Paulo, SP: Universidade de São Paulo. Ge, W. (2010). Essays on real earnings management (Doctoral hesis).
Montreal, Canadá: McGill University.
Graham, J. R., Harvey, C. R., & Rajgopal, S. (2005). he economic implications of corporate inancial reporting. Journal of Accounting
and Economics, 40(1-3), 3-73.
Gunny, A. K. (2010). he relation between earnings management using real activities manipulation and future performance: evidence from meeting earnings benchmarks. Contemporary Accounting Research, 27(3), 855-888.
Joosten, C. (2012). Real earnings management and accrual-based earnings management as substitutes (Master’s Dissertation). Tilburg, Holanda: Tilburg University.
Kothari, S. P. (2001). Capital markets research in accounting. Journal of Accounting and Economics, 31(1-3), 105-231.
Li, X. (2010). Real earnings management and subsequent stock returns. Retrieved from http://dx.doi.org/10.2139/ssrn.1679832 Lopes, A. B., & Walker, M. (2008). Firm-level incentives and the
informativeness of accounting reports: an experiment in Brazil. Retrieved from http://dx.doi.org/10.2139/ssrn.1095781 Machado, D. G. (2012). Inluência da política de remuneração dos
executivos no nível de gerenciamento de resultados em empresas industriais brasileiras, estadunidenses e inglesas (Doctoral hesis). Blumenau, SC: Universidade Regional de Blumenau.
Martinez, A. L. (2013). Earnings management in Brazil: a survey of the literature. Brazilian Business Review, 10(4), 1-29.
Martinez, A. L., & Cardoso, R. L. (2009). Gerenciamento de resultados contábeis no Brasil mediante decisões operacionais. Revista Eletrônica de Administração, 15(3), 1-27.
Oswald, D. R., & Zarowin, P. (2007). Capitalization of R&D and the informativeness of stock prices. European Accounting Review, 16(4), 703-726.
Paulo, E. P. (2007). Manipulação das informações contábeis: uma análise teórica e empírica sobre os modelos operacionais de detecção de gerenciamento de resultados (Doctoral hesis). São Paulo, SP: Universidade de São Paulo.
Reis, E. M., Cunha, J. V. A., & Ribeiro, D. M. (2014). Análise do gerenciamento de resultados por meio de decisões operacionais nas empresas componentes do IBrX – Índice Brasil. Advances in Scientiic and Applied Accounting, 7(2), 201-223.
Rey, J. M. R. (2011). Gerenciamento de resultados baseado em escolhas contábeis e por decisões operacionais: estudo do impacto da Lei Sarbanes-Oxley em empresas brasileiras emissoras de ADRs (Master’s Dissertation). Vitória, ES: Fucape Business School.
Roychowdhury, S. (2006). Earnings management through real activities manipulation. Journal of Accounting and Economics, 42(3), 335-370. Santos, A., & Paulo, E. (2006). Diferimento das perdas cambiais como
instrumento de gerenciamento de resultados. Brazilian Business Review, 3(1), p. 15-31.
Xu, Z. (2008). hree essays on real earnings management (Doctoral hesis). Tuscaloosa, AL: he University of Alabama.
Zang, A. (2012). Evidence on the tradeof between real manipulation and accrual manipulation. he Accounting Review, (2), 675-703.
Correspondence Address:
César Medeiros Cupertino
Universidade Federal de Santa Catarina, Campus Reitor João David Ferreira Lima, Departamento de Ciências Contábeis Rua Engenheiro Agronômico Andrei Cristian Ferreira, s/n - CEP: 88040-900