DOI: http://dx.doi.org/10.5007/1980-0037.2016v18n4p381
1 University of Brasília. Brasília, DF. Brazil.
2 Federal University of Vale do São Francisco. Petrolina, PE. Brazil.
Received: 24 April 2016 Accepted: 01 August 2016
Comparisons between body adiposity indexes
and cutoff values in the prediction of functional
disability in older women
Comparações entre índices de adiposidade corporal e
pontos de corte na predição de incapacidade funcional
em mulheres idosas
André Bonadias Gadelha1
Silvia Gonçalves Ricci Neri1
Marisete Peralta Safons1
Sérgio Rodrigues Moreira2
Ricardo Moreno Lima1
Abstract – he aim of this study was to compare body adiposity indexes and to identify
cutof values in the prediction of disability in older women. Eighty-seven volunteers (67.27±6.45 years) underwent body composition assessment using dual-energy X-ray absorptiometry (DXA) and had ive anthropometric indexes measured (Waist Circum-ference, WC; Waist-to-Height Ratio, WHtR; Body Mass Index, BMI; Body Adiposity Index, BAI; and conicity index). Functionality was assessed from three Senior Fitness Test Battery protocols: 30-second chair stand, 8-foot up-and-go, and 6-minute walk. Pearson’s correlation was conducted to identify the relationship between body adiposity indexes and functionality results. Cutof values to predict disability were obtained from ROC curves and odds ratio were calculated for the same outcome. Disability prevalence was 36.8%. Scores in the 30-second chair stand, 8-foot up-and-go, and 6-minute walk tests showed stronger associations with WC (r=-0.345; p<0.01), WHtR (r=-0.417; p<0.01) and BAI (r=0.296; p<0.01), respectively. he cutof values identiied were 89.5cm, 39.2%, 26.93kg/m2, 34.6%, 0.51cm and 1.23 for WC, DXA-derived body fat percentage, BMI, BAI, WHtR and conicity index, respectively. WC showed greater odds ratio for disability outcome (odds ratio: 3.16; CI: 1.3–7.8).WC showed strong relationship with functional tests and its cutof values exhibited predicting skill for disability in older women.
Key words: Aging; Obesity; Physical itness.
Resumo – Objetivou-se comparar índices de adiposidade corporal e identiicar pontos de corte na
Aging, obesity and functional disability Gadelha et al.
INTRODUCTION
he aging process is associated with important changes in the various physiological systems. Changes in body composition are already well documented in literature, such as body fat accumulation, which can com-promise health and quality of life1,2. Increased body fat has been associated
with negative health indicators, such as cardiometabolic diseases in various populations, including in the elderly2.
Among the current methods that assess adiposity, the dual energy x-ray absorptiometry (DXA) is considered the gold standard3. Although
showing satisfactory results, the use of DXA becomes impractical for clinical evaluations in numerous populations4. herefore, there is growing
interest in investigating the predictive power of low-cost and easy-appli-cation clinical evaluations. In this scenario, some body adiposity indexes have been widely used to predict various risk factors of the population as a whole2. In an efort to improve the methods commonly used to estimate
body fat percentage, Bergman et al.5 proposed the body adiposity index
(BAI), which was consistently associated (r = 0.85) with fat percentage measured by DXA. However, its ability to identify conditions related to excess body fat needs further investigations in speciic populations2.
Other indexes are commonly used to identify health risks, but studies are needed in the context of functional disability. Although body mass index (BMI) is widely used to classify obesity, this index has been criticized for not considering body fat distribution6. In this sense, indexes that
con-sider body fat distribution to the central region of the body such as waist circumference (WC), Waist-to-Height Ratio (WHtR) and the conicity index (CI) have also been used to classify obesity2.
Increased risk of cardiovascular and metabolic diseases is among the conditions imposed on health as efects of obesity2,7-9. Furthermore, excess
body mass has been reported as a negative inluence on the functionality of individuals with advanced age, representing an increased risk of disability in this population. It has well established that obesity assessed by BMI and / or WC is associated with reduced mobility in elderly individuals10-14. In
this sense, Angleman et al.15 showed that the body fat distribution appears
to be an important indicator of mobility, valuing the evaluation of WC in relation to BMI for presenting positive correlation with the visceral adipose tissue of men and women16. herefore, body adiposity measures that
con-sider body fat distribution in the central region of the body can signiicantly predict the functional disability in older adults15. Currently, there is a gap
Sample
Two hundred women aged over 60 years participated in a project aimed at assessing body composition of residents in the Federal District, Brazil. Participants were recruited by convenience by announcement in posters ixed on sites with high incidence of the target audience, such as churches, parks and community centers. Of the most comprehensive sample, 87 vol-unteers were selected for this study, which is characterized as an analytical cross-sectional study. Exclusion criteria were: being unable to walk without assistance, to have metallic prosthesis, to have unilateral or bilateral hip prosthesis, and to show abnormality of conduction or cardiac perfusion that would contraindicate the practice of physical activities.
his study was approved by the Ethics Research Committee on Human Beings of FS / UnB (Protocol No. 001/13) and all participants signed the Informed Consent Form. Data collection was conducted at the laboratories of the University of Brasilia, Brasilia, Federal District, Brazil.
General health assessment
Initially, anamnesis was applied to identify metabolic abnormalities, smok-ing and use of drugs. hen, the short-version IPAQ17 was used to verify
the level of physical activity of volunteers.
Assessment of body adiposity indexes
Volunteers were submitted to anthropometric measurements to obtain the following measures: body weight, height, and waist circumference (WC). Body mass was measured by a digital scale (model E150-INAN Filizola, São Paulo, Brazil), with 0.1 kg accuracy; height was measured using a sta-diometer, model Wood with speciicity of 0.1 cm (WCS / CARDIOMED, Curitiba, Paraná, Brazil); and waist and hip circumferences were measured using Sanny® anthropometric tape, adopting the umbilicus and the point of maximum extension of the buttocks, respectively, as reference 2. From
the measurements obtained, BMI, WHtR, CI and BAI were calculated according to the following formulas:
Body Composition Assessment
Body composition was measured by DXA (General Electric-GE model 8548 BX1L, 2005, DPX lunar type, Encore 2010 software), using proce-dures previously described2. After analysis of the entire body area, tissues
Aging, obesity and functional disability Gadelha et al.
speciic values for trunk and limbs were provided. A single individual was evaluated for six consecutive days and its variation coeicient was 0.9% and 1.9% for fat-free mass and bone, and fat mass, respectively.
Functional capacity assessment
To evaluate functional performance, three Senior Fitness Test Battery validated protocols were used18. Tests were conducted in the morning in
the following order: 1) 30-second chair stand; 2) 8-foot up-and-go; and 3) 6-minute walk. An interval of four to six minutes between protocols was adopted; and before starting the test battery, light and global warm-up exer-cises consisting of calisthenics and stretching, with ive minutes of duration, was conducted by an experienced professional18. In addition, volunteers were
instructed on the use of light and comfortable clothing. Tests were performed in the gymnasium of the Olympic Centre of the Physical Education School.
he classiication of the functional disability outcome was based on norma-tive values previously published by Rikli and Jones18. In the present study, were
classiied with this outcome, participants who presented values below the refer-ence in at least two of the three tests applied were classiied with this outcome.
Statistical analysis
To check the normality of data, the Kolmogorov-Smirnov test was applied. After identiication of normal distribution, parametric tests were applied. he Pearson correlation was used to test the association between body adiposity indexes and the Senior Fitness Test Battery. he same correlation was used between WC and trunk and lower limb fat. A cutof point was then calculated for each body adiposity index through the Receiver Operating Characteristic (ROC) to identify the functional disability condition. After the classiication of body adiposity indexes, the mean values of groups were compared using the t test for independent samples. Descriptive statistics (cross-tabs), followed by of chi-square and risk selection were used to generate odds ratio and conidence interval, considering the functional disability outcome according to each body adiposity classiication. hen, the odds ratio was adjusted for age, level of physical activity and smoking. he signiicance level was set at p ≤ 0.05 and the software used for analysis was the Statistical Package for Social Sciences (version 20.0).
RESULTS
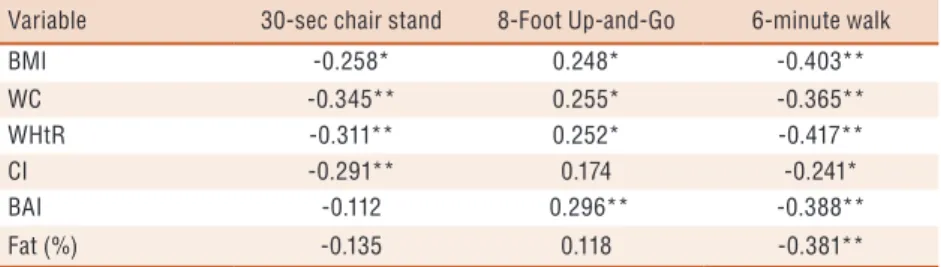
signiicant and inverse association with the 30-second chair stand test. he 8-foot up-and-go test showed positive and signiicant correlation with BMI, WC, WHtR and BAI. he 6-minute walk test, in turn, showed a signiicant inverse correlation with all body adiposity indexes.
Table 1. Correlation between body adiposity indexes and functional tests
Variable 30-sec chair stand 8-Foot Up-and-Go 6-minute walk
BMI -0.258* 0.248* -0.403**
WC -0.345** 0.255* -0.365**
WHtR -0.311** 0.252* -0.417**
CI -0.291** 0.174 -0.241*
BAI -0.112 0.296** -0.388**
Fat (%) -0.135 0.118 -0.381**
BMI: Body Mass Index; WC: Waist Circumference; WHtR: Waist-to-Height Ratio; CI: Conicity Index; BAI: Body Adiposity Index; Fat (%): Fat Percentage measured by DXA. * P <0.05; ** P <0.01.
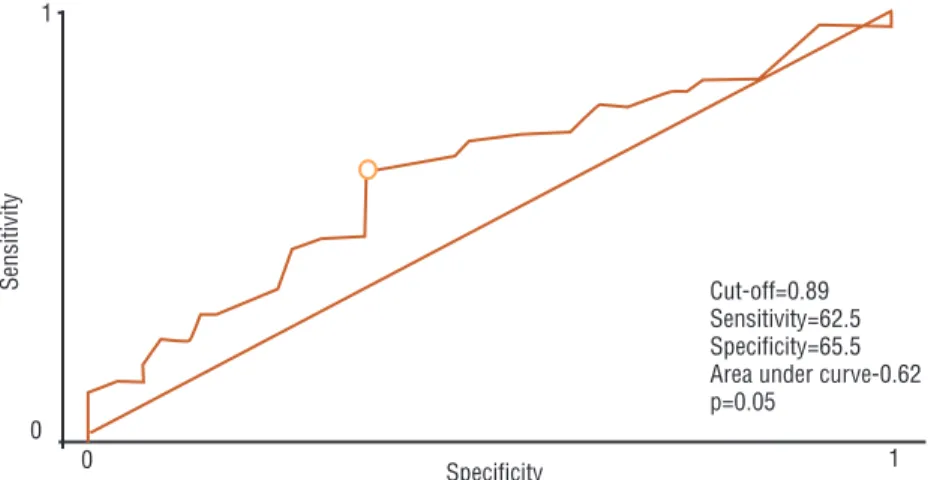
Table 2 shows the area under the ROC curve of each body adiposity index for the Senior Fitness Test Battery protocols. BMI, WC and WHtR showed discrimi-natory performance for all outcomes of the above battery tests. When considering only the 30-second chair stand test, the CI also showed signiicantly greater area under the curve (p <0.01) when compared to the reference curve (0.5). For the 6-minute walk test, the BAI and total fat percentage also showed signiicantly greater area under the curve (p <0.01) when compared to the reference curve (0.5). WC presented higher area under the ROC curve for the 30-second chair stand test (0.712; p <0.01). However, no signiicant diferences were observed for the area under the ROC curve among body adiposity indexes, considering the Senior Fitness Test Battery protocols individually (Table 2). However, considering the functional disability outcome, WC was the only body adiposity index showing signiicant importance for its sensitivity and speciicity (Figure 1). Furthermore, the same index showed signiicant diference for the functional disability outcome when compared to other body adiposity indexes (p = 0.05). Figure 2 shows the association between WC and the fat distribution of trunk and lower limbs. It was observed that WC presented strong association with trunk fat (r = 0.863, p <0.01) and moderate with lower limb fat (r = 0.583, p <0.01) (Figure 2).
Table 2. Area under the ROC curve (95% confidence interval) of each body adiposity index for
the Senior Fitness Test Battery protocols
BMI 30-sec chair stand 8-Foot Up-and-Go 6-minute walk
WC 0.650 (0.540-0.749)* 0.640 (0.530-0.740)* 0.703 (0.595-0.796)*
WHtR 0.712 (0.605-0.804)** 0.624 (0.514-0.726)* 0.664 (0.555-0.762)**
CI 0.655 (0.546-0.754)* 0.620 (0.510-0.722)* 0.685 (0.577-0.780)**
BAI 0.695 (0.587-0.789)** 0.598 (0.487-0.702) 0.559 (0.488-0.703)
Fat (%) 0.519 (0.409-0.627) 0.578 (0.468-0.684) 0.674 (0.566-0.771)**
BMI 0.549 (0.439-0.656) 0.547 (0.437-0.654) 0.678 (0.569-0.774)**
Aging, obesity and functional disability Gadelha et al.
Figure 1. ROC curve according to the sensitivity and specificity of Waist Circumference with the Functional Disability outcome
Figure 2. Correlation between waist circumference and fat distribution measured by DXA. A) trunk fat; B) lower limb fat.
Table 3 shows cutofs for each body adiposity index related to functional disability. WC was the only index used that presented increased and signiicant odds ratio with and without adjustment for the functional disability outcome. However, after adjusting for age, level of physical activity and smoking, BMI was also due to increased and signiicant chances to the above outcome.
Table 3. Cutoff points (sensitivity, specificity) for each body adiposity index regarding the presence of functional disability and Odds Ratio (95% Confidence Interval) for the functional disability outcome according to the cutoff points for body adiposity classifications.
Variable Cutoff point Odds Ratio Adjusted Odds Ratio
BMI (kg/m2) 26.93 (59.4;63.6) 2.37 (0.97-5.77) 2.49 (1.01-6.09)*
WC (cm) 89.50 (62.5;65.5) 3.16 (1.28-7.82)** 3.07 (1.24-7.61)*
WHtR(cm/cm) 0.51 (96.9;20.0) 7.75 (0.95-63.17) 7.93 (0.93-64.67)
CI (UA) 1.23 (78.1;43.6) 2.57 (0.95-6.94) 2.46 (0.91-6.67)
BAI (%) 34.60 (53.1;61.8) 1.70 (0.71-4.10) 1.65 (0.68-3.98)
Fat (%) 39.20 (75.0;41.8) 2.17 (0.82-5.64) 2.23 (0.85-5.84)
Anthropometric indexes were more consistently related with functional tests than body fat measured by DXA, especially those that considered ab-dominal adiposity in their calculations. By observing participants classiied with high adiposity, the odds ratio for the functional disability outcome was increased for both WC and BMI. In addition, WC was the only measure that had discriminatory power for the functional disability outcome.
Anthropometric measures are important indicators of functionality during the aging process, as it has been reported that excess adiposity negatively inluences the functionality of elderly individuals. In this sense, Angleman et al.15 have evaluated for the irst time the association of ive
anthropometric measurements (body weight, BMI, WC, BAI and waist-to-hip ratio) with the risk of functional disability in elderly subjects. Among female participants (n = 1030; 55-74 years), body fat distribution was presented as an important indicator of mobility, valuing the WC measure in relation to the other measures for being directly related to visceral fat
15. he results of this study corroborate the above indings, conirming
that there is a more consistent relationship between WC and trunk fat (r = 0.863, p <0.01) compared with lower limb fat (r = 0.583, p <0.01). Similarly, Oliveira et al.16 demonstrated a signiicant association between
WC and the visceral adipose tissue area of older women (r = 0.677; p = 0.01). Gomes et al.19 also demonstrated an association between the same
anthropometric index with the trunk fat distribution of older women. In addition, increased WC presented higher odds ratio for diiculties in performing activities of the daily living (ADLs).
Recently, Lisko et al. 20 examined whether obesity (measured by BMI
and / or WC) would be associated with functional disability in Finn no-nagenarians (n = 569; 416 women). Functionality was assessed using the Barthel Index and the chair stand test. Corroborating the indings previ-ously presented, it was observed that subjects with higher WC had worse functional performance. he same was observed in Asian nonagenarians regarding the relationship between WC and ADLs21.
When considering BMI, WC, bioimpedance and triceps skinfold thickness, Donget al.22 found association between obesity and functionality
of individuals with advanced age. However, among the above measures, the authors observed that only WC was related with the instrumental ac-tivities of octogenarian individuals, corroborating the results of this study. In addition, when comparing the physical function of normal weight (n = 30), overweight (n = 29) and obese women (n = 24), classiied according to BMI, there was less functionality among obese women only compared with those with normal weight22, which reinforces the need to identify
cutofs for speciic populations, as proposed in this study.
Aging, obesity and functional disability Gadelha et al.
association is not yet entirely clear. Angleman et al.15 point out that, when in
excess, omental and mesenteric adipose tissue compromise the metabolism of macronutrients and negatively inluence the cardiovascular system. In this sense, these cardiometabolic alterations may impair the functionality of individuals with visceral obesity. Another possible explanation for the above-mentioned condition is the fact that obesity imposes a direct physical overload23, contributing both to the wear of locomotor system structures
and to a more sedentary lifestyle and consequent reduction of the overall itness of obese individuals24.
Fat iniltration in organs such as liver and striated skeletal muscle25
is also observed, which could impair the metabolism and speciic torque (muscle quality)26 during the functional demands of obese older individuals.
Furthermore, it is known that central obesity is a risk factor for coronary heart diseases, diabetes and other cardiometabolic disorders, which, in turn, can contribute, even if indirectly, to functional disability27. Finally,
these indings can also be explained by biomechanical changes imposed by the excessive increase in central adiposity, as this condition changes the individual’s center of gravity, imposing an anterior postural overload, which damages the maintenance of balance, changes the gait patterns and inluences the functionality of individuals with central obesity outcome28.
he limitations of this study should be stressed. First, the sample size does not represent the population of older women living in the Federal District. However, the procedure adopted included assessment of body composition made by DXA, which hindered the sample expansion. In addition, functionality was assessed using a battery of ield tests18, unlike
most previously published studies in which this evaluation was conducted through self-reports and questionnaires. In this sense, it was decided to increase the internal validity of the study. Based on the results obtained, it is suggested the development of studies with larger samples. In addition, the cross-sectional nature of the study does not establish a cause and efect relationship, making it impossible to identify the impact of excess body fat according to diferent adiposity indexes on the functional disability of volunteers. herefore, further longitudinal studies comparing the body adiposity indexes and identifying the importance of these measures on the functional disability of older women should be carried out.
CONCLUSIONS
Acknowledgments
he authors would like to thank the Coordination for the Improvement of Higher Education Personnel (CAPES).
REFERENCES
1. Canning KL, Brown RE, Jamnik VK, Kuk JL. Relationship between obesity and obesity-related morbidities weakens with aging. J Gerontol A Biol Sci Med Sci 2014;69(1):87-92.
2. Gadelha AB, Myers J, Moreira S, Dutra MT, Safons MP, Lima RM. Comparison of adiposity indices and cut-of values in the prediction of metabolic syndrome in postmenopausal women. Diabetes Metab Syndr 2016;10(3):143-8.
3. Cornier MA, Després JP, Davis N, Grossniklaus DA, Klein S, Lamarche B, et al. Assessing adiposity a scientiic statement from the American Heart Association. Circulation 2011;124(18):1996-2019.
4. Villareal DT, Apovian CM, Kushner RF, Klein S. Obesity in older adults: technical review and position statement of the American Society for Nutrition and NAASO, he Obesity Society. Am J Clin Nutr 2005;82(5):923-1934.
5. Bergman RN, Stefanovski D, Buchanan TA, Sumner AE, Reynolds JC, Sebring NG, et al. A better index of body adiposity. Obesity 2011;19(5):1083-9.
6. Müller M, Lagerpusch M, Enderle J, Schautz B, Heller M, Bosy‐Westphal A. Beyond the body mass index: tracking body composition in the pathogenesis of obesity and the metabolic syndrome. Obes Rev 2012;13(S2):6-13.
7. Mancini M, Geloneze B, Salles J, Lima J, Carra M. Tratado de Obesidade. Itapevi: AC Farmacêutica. 2010.
8. Chughtai HL, Morgan TM, Hamilton CA, Charoenpanichkit C, Ding J, Brinkley TE, et al. Intraperitoneal fat is associated with thickening of the thoracic aorta in individuals at high risk for cardiovascular events. Obesity 2011;19(9):1784-90. 9. Hirani V. Generalised and abdominal adiposity are important risk factors for
chronic disease in older people: results from a nationally representative survey. J Nutr Health Aging 2011;15(6):469-78.
10. Ensrud KE, Nevitt MC, Yunis C, Cauley JA, Cauley JA, Seeley DG, Fox KM, et al. Correlates of impaired function in older women. J Am Geriatr Soc 1994;42(5):481-9.
11. Hubert HB, Bloch DA, Fries JF. Risk factors for physical disability in an aging cohort: the NHANES I Epidemiologic Followup Study. Journal Rheumatol 1993;20(3):480-8.
12. Galanos AN, Pieper CF, Cornoni-Huntley JC, Bales CW, Fillenbaum, GG. Nutrition and function: is there a relationship between body mass index and the functional capabilities of community-dwelling elderly? J Am Geriatr Soc 1994;42(4):368-73.
13. Launer LJ, Harris T, Rumpel C, Madans J. Body mass index, weight change, and risk of mobility disability in middle-aged and older women: the epidemiologic follow-up study of NHANES I. JAMA 1994;271(14):1093-8.
14. Jenkins KR. Obesity’s efects on the onset of functional impairment among older adults. Gerontologist 2004;44(2):206-16.
15. Angleman S, Harris T, Melzer D. he role of waist circumference in predicting disability in periretirement age adults. Int J Obes 2006;30(2):364-73.
predic-Aging, obesity and functional disability Gadelha et al.
CORRESPONDING AUTHOR
André Bonadias Gadelha Universidade de Brasília (UnB), Campus Universitário Darcy Ribeiro, Faculdade de Educação Física, Brasília – Distrito Federal – Brasil. CEP: 70910-900.
E-mail: [email protected]
17. Matsudo S, Araújo T, Matsudo V, Andrade D, Andrade E, Oliveira LC, et al. Questinário internacional de atividade física (IPAQ ): estudo de validade e re-produtibilidade no Brasil. Rev Bras Ativ Fís Saúde 2001;6(2):5-18.
18. Rikli RE, Jones CJ. Development and validation of criterion-referenced clinically relevant itness standards for maintaining physical independence in later years. Gerontologist 2013;53(2):255-67.
19. Gomes MA, Rech CR, Gomes MBA, Santos DL. Correlação entre índices an-tropométricos e distribuição de gordura corporal em mulheres idosas. Rev Bras Cineantropom Desempenho Hum 2006;8(3):16-22.
20. Lisko I, Stenholm S, Raitanen J, Hurme M, Hervonen A, Jylhä M, et al. Associa-tion of body mass index and waist circumference with physical funcAssocia-tioning: the vitality 90+ study. J Gerontol A Biol Sci Med Sci 2015;70(7):885-91.
21. Yang M, Jiang J, Li H, Wu H, Dong B. Association between waist circumfer-ence and self‐reported disability among Chinese adults aged 90 years and older. Geriatrics Gerontol Int 2015;15(12):1249-57.
22. Dong H-J, Marcusson J, Wressle E, Unosson M. Obese very old women have low relative handgrip strength, poor physical function, and diiculties in daily living. J Nutr Health Aging 2015;19(1):20-5.
23. Koster A, Ding J, Stenholm S, Caserotti P, Houston DK, Nicklas BJ, et al. Does the amount of fat mass predict age-related loss of lean mass, muscle strength, and muscle quality in older adults? J Gerontol A Biol Sci Med Sci 2011;66(8):888-95. 24. Stenholm S, Alley D, Bandinelli S, Griswold ME, Koskinen S, Rantanen T, et al.
he efect of obesity combined with low muscle strength on decline in mobility in older persons: results from the InCHIANTI study. Int J Obes 2009;33(6):635-44. 25. Visser M, Goodpaster BH, Kritchevsky SB, Newman AB, Nevitt M, Rubin SM,
et al. Muscle mass, muscle strength, and muscle fat iniltration as predictors of incident mobility limitations in well-functioning older persons. J Gerontol A Biol Sci Med Sci 2005;60(3):324-33.
26. Gauche R, Gadelha AB, Paiva FML, Oliveira PFA, Lima RM. Strength, muscle quality and markers of cardiometabolic risk in older women. Rev Bras Cineantro-pom Desempenho Hum 2015;17(2):186-94.
27. Murphy RA, Reinders I, Register TC, Ayonayon HN, Newman AB, Satterield S, et al. Associations of BMI and adipose tissue area and density with incident mobility limitation and poor performance in older adults. Am J Clin Nutr 2014;99(5):1059-65.