Original article
density in postmenopausal women: a cross-sectional study
La relación entre el espesor mío-intimal y la densidad mineral ósea en las mujeres
posmenopáusicas: un estudio transversal
Daniela Fodor
I, Cosmina Bondor
II, Adriana Albu
III, Laura Muntean
IV, Siao-pin Simon
V, Laura Poanta
VI, Alexandra Craciun
VII“Iuliu Hatieganu” University of Medicine and Pharmacy, Cluj-Napoca, Romania
IMD, PhD. Rheumatologist and Associate Professor in Second Internal Medicine Clinic, “Iuliu Hatieganu” University of Medicine and Pharmacy, Cluj-Napoca, Romania. IIStatistician. Assistant Professor, Department of Medical Informatics and Biostatistics, “Iuliu Hatieganu” University of Medicine and Pharmacy, Cluj-Napoca, Romania. IIIMD, PhD. Clinician and Associate Professor in Second Internal Medicine Clinic, “Iuliu Hatieganu” University of Medicine and Pharmacy, Cluj-Napoca, Romania. IVMD. Rheumatologist and Assistant Professor in Rheumatology Clinic, “Iuliu Hatieganu” University of Medicine and Pharmacy, Cluj-Napoca, Romania. VMD, PhD. Rheumatologist and Lecturer in Rheumatology Clinic, “Iuliu Hatieganu” University of Medicine and Pharmacy, Cluj-Napoca, Romania. VIMD, PhD. Clinician and Lecturer in SecondInternal Medicine Clinic, “Iuliu Hatieganu” University of Medicine and Pharmacy, Cluj-Napoca, Romania.
VIIMD, PhD. Laboratory Medicine Specialist and Associate Professor, Department of Biochemistry, “Iuliu Hatieganu” University of Medicine and Pharmacy, Cluj-Napoca, Romania.
ABSTRACT
CONTEXT AND OBJECTIVES: Controversy exists regarding the relationship between atherosclerosis and osteoporosis. The aim of this study was to determine the relationship between intima-media thickness (IMT) of the common carotid artery (CCA), presence of calciied atherosclerotic plaques and bone mineral density (BMD) evaluated by dual energy X-ray absorptiometry (DXA), in postmenopausal women.
DESIGN AND SETTING: Cross-sectional study at Second Internal Medicine Clinic, Cluj-Napoca, Romania.
METHODS: We studied the IMT (left and right CCA and mean IMT) and T-score (lumbar spine L2-L4, femoral neck and total hip) in 100 postmenopausal women (mean age 64.5 years). The presence of calciied atherosclerotic plaque and osteoporotic vertebral fractures was also noted.
RESULTS: IMT in the left and right CCA and mean IMT were signiicantly associated with T-score measured for the lumbar spine L2-L4, femoral neck and total hip, with lower T-score, in the osteoporotic group than in the normal and osteopenic groups (P < 0.05). IMT had a signiicantly negative correlation with the lumbar spine T-score and femoral neck T-score; and mean IMT with lowest T-score. Mean IMT (P < 0.001), high blood pressure (P = 0.005) and osteoporotic vertebral fractures (P = 0.048) showed statistical signiicance regarding the likelihood of developing atherosclerotic plaque.
CONCLUSIONS: In women referred for routine osteoporosis screening, the relationship between CCA, atherosclerosis and osteoporosis can be demonstrated using either cortical or trabecular BMD. Vertebral fractures may be considered to be a likelihood factor for atherosclerotic plaque development.
RESUMÉN
CONTEXTO Y OBJETIVOS: Hay controversias en cuanto a la relación entre la arterioesclerosis y la osteoporosis. El objetivo del estudio fue determinar la relación entre el espesor mío-intimal (EMI) de la arteria carótida común (ACC), la presencia de placas arterioescleróticas calciicadas, y la densidad mineral ósea (DMO) evaluada a través de absorciometría de rayos X de energía dual (DEXA) en mujeres posmenopáusicas.
DISEÑO Y ENTORNO: Estudio transversal en la Segunda Clínica de Medicina Interna, Cluj-Napoca, Rumania.
MÉTODOS: Hemos estudiado el EMI (ACC izquierda y derecha y EMI promedio) y el T-score (espina lumbar L2-L4, cuello femoral y cadera total) en 100 mujeres posmenopáusicas (edad promedia 64.5 años). Se ha observado también la presencia de las placas arterioescleróticas calciicadas y de la fractura vertebral osteoporótica.
RESULTADOS: El EMI en ACC izquierda y derecha, como también el EMI promedio se ha asociado sobre todo con el T-score medido en la espina lumbar L2-L4, cuello femoral y cadera total o el valor más bajo del T-score, en el grupo osteoporótico, en comparación con el grupo normal y el osteopénico (P < 0.05). Se ha registrado una correlación signiicativamente negativa entre el EMI y el T-score de espina lumbar, el T-score del cuello femoral, y el EMI promedio con el T-score más bajo. El EMI promedio (P < 0.001), la alta presión (P = 0.005), y las fracturas vertebrales osteoporóticas (P = 0.048) demostraron tener una importancia estadística con respecto a la probabilidad de formación de placas arterioescleróticas.
CONCLUSIONES: En el caso de las mujeres sometidas a screening rutinario para la osteoporosis, la relación entre ACC, arterioesclerosis y osteoporosis se puede demostrar utilizando sea la DMO cortical o trabecular. Las fracturas vertebrales se pueden considerar como un factor de probabilidad para el desarrollo de las placas arterioescleróticas.
KEY WORDS:
Bone density. Carotid artery, common. Atherosclerosis. Osteoporosis. Postmenopause.
INTRODUCTION
Osteoporosis and cardiovascular diseases are known to be major causes of morbidity and mortality in postmenopausal women.1,2 A large
number of studies have demonstrated a relationship between bone pa-thology and vascular disease, thus suggesting that there are common pathways that afect negatively bone metabolism and the vasculature,3-6
and that the presence of one is a predictor for the other.7 However, the
nature of the association between osteoporosis and atherosclerosis re-mains unknown.
Measurement of intima-media thickness (IMT) in the distal com-mon carotid artery is increasingly being used as an independent risk fac-tor for the development of cardiovascular events due to atherosclerosis.8,9
Carotid atherosclerosis has been associated with lumbar spine bone mass in postmenopausal women10 and calciication of the atherosclerotic
plaques with low bone mineral density (BMD),11 which suggests that
women with osteoporosis are at a higher risk of having cardiovascular events. Low BMD has been associated with an increased risk of echo-genic calciied atherosclerotic plaque,12 and elderly women with
echogen-ic carotid plaque are at a higher risk of nonvertebral fractures than are women without plaque.13 An association between lower BMD and
struc-tural and functional measurement of atherosclerosis (as assessed by the ankle-brachial index and IMT) has also been established in men.14
Stan-dardization of carotid IMT measurements and recommendations for a carotid ultrasound scanning protocol were recently published,14,15
there-by enabling homogenous data collection and analysis.
OBJECTIVE
he aims of the present study were to determine the relationship be-tween IMT, presence of calciied atherosclerotic plaque and BMD meas-ured at diferent sites, in postmenopausal women referred for routine bone density screening; and to establish whether there is any relation-ship between calciied atherosclerotic plaque in the carotid artery and osteoporotic vertebral fractures.
MATERIAL AND METHOD
One hundred postmenopausal white women were consecutively en-rolled from among patients presenting for BMD measurement in the Rheumatology Clinic of the “Iuliu Hatieganu” University of Medicine and Pharmacy, Cluj-Napoca, Romania, between September 2009 and February 2010. Women were eligible if menopause had occurred at least two years prior to their visit. Patients using hormone replacement ther-apy or medication afecting bone metabolism (corticosteroids, anticon-vulsants or oral anticoagulants) were excluded. We also excluded sub-jects with any condition that might interfere with bone metabolism, such as thyroid disorders, malabsorption, chronic renal and liver dis-eases or alcoholism. None of the subjects had disdis-eases (fractures, etc.) that interfered with their activities of normal daily life. In this group, 65 patients had hypertension, 35 patients had non-insulin-dependent dia-betes and 28 had both diseases. Of these subjects, 31 were being treated
with angiotensin-converting enzyme inhibitors, 25 with calcium antag-onists, 15 with beta-blockers, four with angiotensin II type I receptor blockers, 19 with statins and two with ibrates.
Written informed consent for participation was obtained from each subject prior to enrolment. he Ethics Committee of our University approved the study protocol (ANCS 42107/2008 PNII grant). All the measurements were performed on the same day.
Clinical assessments
Demographic and clinical variables were recorded, including age, weight, height, body mass index (BMI = weight/height2, kg/m2) and
time elapsed since menopause. We also recorded the patients’ medica-tion histories and associated diseases, including hypertension and dia-betes. heir blood pressures were measured using a sphygmomanom-eter on the right arm of the subject, after 10 minutes of resting in the supine position.
Assays
Blood samples were drawn from the antecubital vein in the morn-ing after the subject had fasted for 12 hours. he serum concentrations of total cholesterol, triglycerides, creatinine and glucose were deter-mined by means of standard laboratory techniques (Cobas Mira Plus analyzer).
BMD measurements
BMD was measured in the lumbar spine (L2-L4) and femoral neck by means of dual energy X-ray absorptiometry (DXA), using the Lunar Prodigy Advance apparatus (GE Healthcare, United States). he same densitometer was used for all BMD measurements. he results were expressed as T-scores, i.e. the standard deviation (SD) from the peak adult BMD. he women were classiied in three groups: normal BMD; osteopenia or low bone mass, i.e. a BMD value that was 1-2.5 SDs be-low the mean value for young adults; or osteoporosis, i.e. more than 2.5 SDs below the mean value for young adults (according to the World Health Organization’s criteria for diagnosing osteoporosis).16 hree sites
for BMD assessment were considered:17,18 lumbar spine (L2-L4),
femo-ral neck and total hip. Because the total hip T-score values were greater than or equal to the femoral neck values in all cases, only the T-score values from the femoral neck were used in the statistical analysis. All the measurements were made by two operators. he inter- and intra-opera-tor coeicients of variation were less than 1.3%.
To evaluate the prevalence of vertebral fractures, lateral radiographs (from T4 to L5) were used. A vertebral fracture was deined as a reduc-tion of ≥ 20% in the anterior, middle and/or posterior height of the vertebral body.19
Carotid IMT measurements
Perpen-dicularity between the ultrasound beam and the far wall ensured good viewing of the IMT as two parallel echoic lines (the lumen-intima in-terface and media-adventitia inin-terface). In all cases, three measurements of the common carotid artery far wall were made: at 10, 15 and 20 mm proximally to the bifurcation. If there was any atherosclerotic plaque in the region of interest, the measurement was made outside of the edges of the plaque. For each subject, the mean value of the three measurements was considered to be the current wall thickness of the distal common ar-tery. he mean value between the right and left carotid artery IMT was also taken into account for the study. he variability of the ultrasono-graphic measurements was assessed by making two measurements on 15 volunteers over a one-week period. he reproducibility of the IMT measurement was 10%.
Calciied atherosclerotic plaque was deined as high echogenic focal widening of the carotid wall with protrusion into the lumen, associated with posterior shadow. Plaque was recorded as present or absent on the common, internal and external carotid artery walls.
Statistical analysis
he data were expressed as the mean ± SD and standard error (SE). he 95% conidence intervals for the means were calculated. he chi-square test or Fisher exact test was used to compare categorical data. he Pearson or Spearman correlation coeicient was used between quanti-tative variables, according to their distribution. Means were compared using the t-test, Anova (analysis of variance) test, Mann-Whitney test or Kruskal-Wallis test, depending on variable distribution. he Anova test was followed by Schefe post-hoc analysis. he test for normal distribu-tion was the Kolmogorov-Smirnov test.
Multiple linear regression analysis was used to examine the rela-tionship between IMT as the dependent variable and BMI, age and T-scores for the lumbar spine (L2-L4) and femoral neck as the indepen-dent variables. he results from the multiple stepwise linear regression technique (only the signiicant variables for predictions of the depen-dent variable were entered in the model) were presented as non-stan-dardized regression coeicients (b) with standard error, P-value and 95% conidence interval. he same multiple linear regression analy-sis was used with the T-score for the lumbar spine, the T-score for the femoral neck and the lowest T-score for the lumbar spine and femoral neck as the dependent variables and BMI, age and IMT as the inde-pendent variables.
Multiple logistic regression analysis was used to examine the likeli-hood of developing atherosclerotic plaques based on several indepen-dent variables: hypertension, diabetes, osteoporotic vertebral fractures, T-scores for the lumbar spine (L2-L4) and femoral neck, and IMT. he results from the multiple forward logistic regression technique (only the signiicant variables for predictions of the dependent variable were en-tered in the model) were presented as odds ratios (OR), 95% conidence intervals (95% CI) for odds ratios and P-values.
P ≤ 0.05 was considered statistically signiicant. he statistical anal-ysis was performed using the Statistical Package for the Social Sciences (SPSS) software, version 13.00.
RESULTS
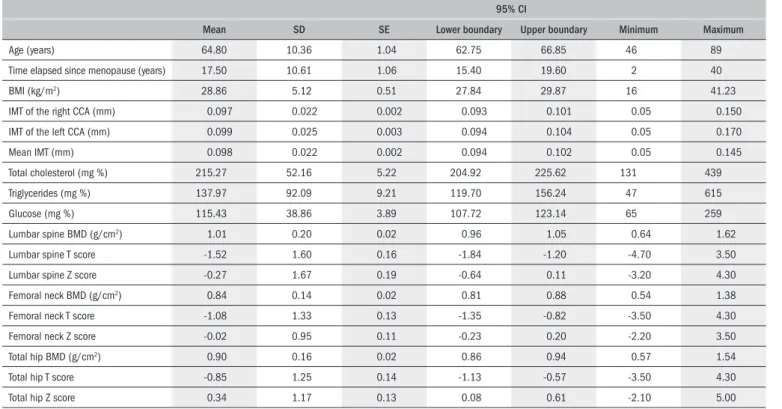
he study group characteristics are summarized in Table 1. he mean age was 64.5 years and 18% were current smokers. It was found
Table 1. Characteristics of the study group (100 patients)
95% CI
Mean SD SE Lower boundary Upper boundary Minimum Maximum
Age (years) 64.80 10.36 1.04 62.75 66.85 46 89
Time elapsed since menopause (years) 17.50 10.61 1.06 15.40 19.60 2 40
BMI (kg/m2) 28.86 5.12 0.51 27.84 29.87 16 41.23
IMT of the right CCA (mm) 0.097 0.022 0.002 0.093 0.101 0.05 0.150
IMT of the left CCA (mm) 0.099 0.025 0.003 0.094 0.104 0.05 0.170
Mean IMT (mm) 0.098 0.022 0.002 0.094 0.102 0.05 0.145
Total cholesterol (mg %) 215.27 52.16 5.22 204.92 225.62 131 439
Triglycerides (mg %) 137.97 92.09 9.21 119.70 156.24 47 615
Glucose (mg %) 115.43 38.86 3.89 107.72 123.14 65 259
Lumbar spine BMD (g/cm2) 1.01 0.20 0.02 0.96 1.05 0.64 1.62
Lumbar spine T score -1.52 1.60 0.16 -1.84 -1.20 -4.70 3.50
Lumbar spine Z score -0.27 1.67 0.19 -0.64 0.11 -3.20 4.30
Femoral neck BMD (g/cm2) 0.84 0.14 0.02 0.81 0.88 0.54 1.38
Femoral neck T score -1.08 1.33 0.13 -1.35 -0.82 -3.50 4.30
Femoral neck Z score -0.02 0.95 0.11 -0.23 0.20 -2.20 3.50
Total hip BMD (g/cm2) 0.90 0.16 0.02 0.86 0.94 0.57 1.54
Total hip T score -0.85 1.25 0.14 -1.13 -0.57 -3.50 4.30
that 56% of the patients had unilateral or bilateral carotid calciied ath-erosclerotic plaque, 13% had osteoporotic vertebral fractures (as seen radiographically).
he characteristics of the study subjects assigned to the normal, osteopenic and osteoporotic groups using T-score values for the lum-bar spine (L2-L4) are summarized in Table 2. here were signiicant diferences between the osteoporotic and osteopenic groups (P < 0.05) and between the osteopenic and normal groups with regard to age (P < 0.05), but the T-score was not signiicantly correlated with age (r = -0.17, P = 0.10). here was a signiicance diference in relation to time elapsed since the menopause only when comparing the osteo-porotic group with the normal group (P < 0.01), and the T-score was signiicantly correlated with this period of time (r = -0.24, P = 0.02). here was no signiicant diferent regarding BMI in the three groups, and no correlation with T-score was found (r = 0.18, P = 0.07). IMT in the right CCA (common carotid artery), IMT in the left CCA or mean IMT was signiicantly associated with T-score in the osteoporo-tic group, in comparison with the other two groups (P < 0.05). he ca-rotid IMT was also signiicantly negatively correlated with the T-score (r = -0.26, P = 0.01 for IMT in the right CCA; r = -0.34, P = 0.001 for IMT in the left CCA; and r = -0.32, P = 0.001 for mean IMT). No signiicant P values were obtained in relation to the presence or ab-sence of atherosclerotic plaque in the three groups.
he characteristics of the study subjects assigned to the normal, osteopenic and osteoporotic groups using the T-score values for the
femoral neck are summarized in Table 3. Signiicant diferences in age were found between the groups (P < 0.05 for osteopenia versus nor-mal; and P < 0.01 for osteoporosis versus normal) and the T-score had a signiicantly negative correlation with age (r = -0.40, P < 0.001). he time elapsed since the menopause had a signiicantly negative correla-tion with the T-score (r = -0.46, P < 0.001) and signiicant diferences between the osteopenia and normal groups (P < 0.01) and between the osteoporosis and normal groups (P < 0.01) were established. here was a signiicant diference in BMI only between the osteopenic and normal groups (P < 0.05), but there was no signiicant correlation with the T-score (r = 0.20, P = 0.04). IMT in the right CCA, IMT in the left CCA or mean IMT was signiicantly associated with the T-score in the osteoporotic group, in comparison with the osteopenic group (P < 0.05) and normal group (P < 0.01 for IMT in right CCA and mean IMT and P < 0.05 for IMT in left CCA). he carotid IMT was signiicantly negatively correlated with the T-score (r = -0.36, P < 0.001 for the right CCA; r = -0.31, P = 0.001 for the left CCA; and r = -0.35, P < 0.001 for mean IMT). No signiicant P values were ob-tained in relation to the presence or absence of atherosclerotic plaque in the three groups.
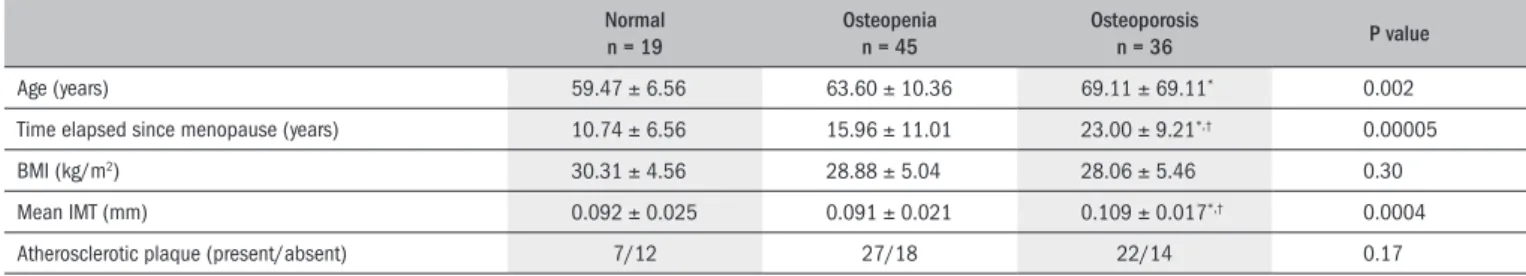
Taking into account the lowest values of the T-scores for the lumbar spine (L2-L4) and femoral neck (Table 4), there was a sig-niicant diference in the patients’ ages between the osteopenic and normal groups (P < 0.01). he Pearson correlation between T-score and age revealed a signiicant correlation (r = -0.32, P = 0.001). he
Table 2. Characteristics of the study subjects assigned to the normal, osteopenic and osteoporotic groups using the T-score values for the lumbar spine (L2-L4)
Normal n = 36
Osteopenia n = 32
Osteoporosis
n = 32 P value
Age (years) 62.75 ± 9.76 63.03 ± 9.98* 68.88 ± 10.50† 0.03
Time elapsed since menopause (years) 13.83 ± 9.27 16.59 ± 11.58 22.53 ± 9.27† 0.002
BMI (kg/m2) 29.52 ± 4.93 29.20 ± 4.81 27.77 ± 5.59 0.34
IMT of the right CCA (mm) 0.093 ± 0.024 0.092 ± 0.022 0.106 ± 0.016*,† 0.01
IMT of the left CCA (mm) 0.093 ± 0.026 0.093 ± 0.022 0.113 ± 0.023‡,§ 0.001
Mean IMT (mm) 0.093 ± 0.024 0.092 ± 0.021 0.110 ± 0.018‡,§ 0.001
Atherosclerotic plaque (present/absent) 17/19 20/12 19/13 0.402
*P < 0.05 versus normal, †P < 0.05 versus osteopenia, ‡P < 0.01 versus normal, §P < 0.01 versus osteopenia.
IMT = intima-media thickness; BMI = body mass index; CCA = common carotid artery.
Table 3. Characteristics of the study subjects assigned to the normal, osteopenic and osteoporotic groups using the T-score values for the femoral neck
Normal n = 35
Osteopenia n = 50
Osteoporosis
n = 15 P value
Age (years) 60.26 ± 7.35 65.78 ± 10.49* 72.13 ± 11.38† 0.001
Time elapsed since menopause (years) 11.77 ± 7.95 19.42 ± 10.77† 24.47 ± 9.43† 0.00005
BMI (kg/m2) 30.52 ± 5.07 27.67 ± 4.88* 28.93 ± 5.28 0.04
IMT of the right CCA (mm) 0.090 ± 0.022 0.097 ± 0.020 0.113 ± 0.018†,‡ 0.003
IMT of the left CCA (mm) 0.092 ± 0.023 0.099 ± 0.026 0.115 ± 0.022*,‡ 0.02
Mean IMT (mm) 0.091 ± 0.021 0.098 ± 0.022 0.114 ± 0.018†,‡ 0.004
Atherosclerotic plaque (present/absent) 16/19 31/19 9/6 0.312
*P < 0.05 versus normal, †P < 0.01 versus normal, ‡P < 0.05 versus osteopenia.
Table 5. Characteristics of study groups depending on the presence or absence of carotid atherosclerotic plaque
Atherosclerotic plaque n Mean SD SE 95% CI P value Lower boundary Upper boundary Lower boundary
Age (years) Absent 44 60.30 9.34 1.41 57.46 63.13 < 0.001
Present 56 68.34 9.79 1.31 65.72 70.96
Time since menopause (years) Absent 44 13.02 10.15 1.53 9.94 16.11 < 0.001
Present 56 21.02 9.66 1.29 18.43 23.61
BMI (kg/m2) Absent 44 27.72 5.08 0.77 26.18 29.27 0.05
Present 56 29.75 5.02 0.67 28.40 31.09
Mean IMT (mm) Absent 44 0.09 0.02 0.00 0.08 0.09 < 0.001
Present 56 0.11 0.02 0.00 0.10 0.11
T-score for the lumbar spine (L2-L4) Absent 44 -1.38 1.70 0.26 -1.90 -0.86 0.36
Present 56 -1.63 1.53 0.20 -2.04 -1.22
T-score for the femoral neck
Absent 44 -0.75 1.53 0.23 -1.22 -0.29
0.07
Present 56 -1.34 1.09 0.15 -1.63 -1.05
Total cholesterol (mg %)
Absent 44 209.16 55.18 8.32 192.38 225.94
0.11
Present 56 220.07 49.63 6.63 206.78 233.36
Triglycerides (mg %)
Absent 44 136.00 105.28 15.87 103.99 168.01
0.38
Present 56 139.52 81.20 10.85 117.77 161.26
IMT = intima-media thickness; BMI = body mass index; SD = standard deviation; SE = standard error; CI = conidence interval.
time elapsed since the menopause was signiicantly diferent between the osteoporotic and osteopenic groups (P < 0.05) and between the osteoporotic and normal groups (P < 0.01). In the latter case, a sig-niicant negative correlation with T-score was obtained (r = -0.37, P = 0.000). here was no signiicant diference (P = 0.30) and no correlation (r = 0.18, P = 0.07) in the relationship with BMI. here was a signiicant diference in mean IMT between the osteoporotic and normal groups (P < 0.01) and between the osteopenic and nor-mal groups (P < 0.05). he T-score was signiicantly negatively cor-related with mean IMT (r = -0.33, P = 0.001).
Multiple linear regression analysis (stepwise linear regression) revealed that mean IMT (OR: -23.92; 95% CI: -37.42 to -10.42; P < 0.001) and BMI (OR: 0.06; 95% CI: 0.01 to 0.12; P = 0.03) were associated with the T-score for the lumbar spine; age (OR: -0.05; 95% CI: -0.07 to -0.03; P < 0.001) was correlated with the T-score for the femoral neck; and mean IMT (OR: -20.23; 95% CI: -31.26 to -9.20; P < 0.001) and BMI (OR: 0.053; 95% CI:
0.005 to 0.10; P = 0.03) significantly predicted the lowest T-score for the lumbar spine (L2-L4) and femoral neck. Mean IMT was de-pendent on age (OR: 0.001; 95% CI: 0.001 to 0.001; P < 0.001) and T-score for the lumbar spine (OR: 0.003; 95% CI: -0.006 to -0.001; P = 0.003).
Atherosclerotic plaque was signiicantly associated with age (P < 0.001), time elapsed since menopause (P < 0.001) and mean IMT (P < 0.001). No signiicant P value was obtained in association with the T-score for the lumbar spine or femoral neck, or with total cholesterol and triglyceride levels (Table 5). From multiple logistic regression to exam-ine the likelihood of developing atherosclerotic plaque based on sev-eral independent variables (hypertension, diabetes, osteoporotic verte-bral fractures, T-score for the lumbar spine L2-L4 and femoral neck, and IMT), we found that the mean IMT (P < 0.001, OR 4.96E+26, E = 3.38 x 10+25), high blood pressure (P = 0.005, OR 4.54) and
os-teoporotic vertebral fractures (P = 0.048, OR 0.21) presented statisti-cal signiicance.
Table 4. Characteristics of the study subjects assigned to the normal, osteopenic and osteoporotic groups using the lowest T-score for the lumbar spine
(L2-L4) and femoral neck
Normal n = 19
Osteopenia n = 45
Osteoporosis
n = 36 P value
Age (years) 59.47 ± 6.56 63.60 ± 10.36 69.11 ± 69.11* 0.002
Time elapsed since menopause (years) 10.74 ± 6.56 15.96 ± 11.01 23.00 ± 9.21*,† 0.00005
BMI (kg/m2) 30.31 ± 4.56 28.88 ± 5.04 28.06 ± 5.46 0.30
Mean IMT (mm) 0.092 ± 0.025 0.091 ± 0.021 0.109 ± 0.017*,† 0.0004
Atherosclerotic plaque (present/absent) 7/12 27/18 22/14 0.17
*P < 0.01 versus normal, †P < 0.05 versus osteopenia.
DISCUSSION
In the present study, we showed that carotid IMT was greater in postmenopausal women with osteoporosis than in those with low bone mass or normal bone mass. At the same time, we showed that the asso-ciation between IMT and BMD was independent of the sites of IMT measurement (right, left or mean CCA) and BMD measurement (T-scores for L2-L4 and femoral neck, and lowest T-score value at these sites). We also found that the presence of osteoporotic vertebral frac-tures acted as an independent risk factor for development of atheroscle-rotic plaque in carotid arteries.
Since 1986, when Pignoli et al.20 described a double line at the
inner wall of the carotid artery in B-mode ultrasound, which was identified histologically as the intima and media layers of the ves-sel, numerous extensive studies have demonstrated a correlation between IMT and the presence of systemic atherosclerosis.8,9,21-23
These two lines represent the lumen-intima and media-adventitia interfaces. There is currently a slight disagreement regarding the location at which the measurements should be taken, but recom-mendations for carotid ultrasound scanning protocols14,15 were
pub-lished recently in order to improve the power of clinical studies. Be-cause of the lack of systems for semi-manual, automated readings15
or radiofrequency multiple M-line analysis,24 which could provide
the mean value of IMT in a very short time, the method used in our study for IMT measurement followed the consensus statements al-ready mentioned above.
To interpret the T-scores using DXA measurements, the World Health Organization’s criteria for diagnosing osteoporosis16 were
used. Because the measurements were made at multiple skeletal sites, analysis of the recorded data using the lowest T-score for the lumbar spine L2-L4, femoral neck and total hip was also performed.25
In-terestingly, no value obtained from the total hip measurement was lower than the values from the femoral neck, so in fact, the lowest score was chosen between the lumbar spine and femoral neck T-score values.
he observed association between low bone mineral density and IMT is consistent with previous studies. Hmamouchi et al.26
report-ed a negative correlation between BMD and IMT in postmenopaus-al Moroccan women, independent of confounding factors, thus sug-gesting that there is a need for bone status evaluation in patients with vascular diseases. Tamaki et al.27 found that low spinal bone mass or
presence of vertebral fractures were independently associated with in-creased IMT at the carotid bifurcation among women in their irst 10 postmenopausal years. Uyama et al.28 indicated that there was an
as-sociation between atherosclerosis and BMD for the total body, but not the spine.
he sites used for BMD measurement by means of DXA have difered: lumbar spine,10,29,30 distal and ultradistal radius,12 lumbar
spine and total hip,11,27 and lumbar spine and all hip sites.26 In some
studies, an opinion was formed that there was an independent asso-ciation between BMD at cortical sites and vascular calciication,26,28
while in others the relationships between cortical/trabecular bone
and carotid artery plaque were shown to be unconnected to the mea-surement sites.11,12 In our study, we used the lumbar spine T-score
(trabecular bone), the femoral neck T-score (cortical bone) and the lowest T-score of these sites, for comparisons. In all these situations, IMT in the right CCA or left CCA or the mean IMT was signii-cantly associated with the T-score in osteoporotic patients, in com-parison with the normal and osteopenic groups. Also, the T-score had a signiicant negative correlation with the mean IMT. Our re-sults suggested that the association between atherosclerosis and os-teoporosis was independent of the sites for DXA T-score and CCA IMT determinations.
Our multiple logistic regression analysis on the presence of athero-sclerotic plaque in relation to T-scores showed that there was a statisti-cally signiicant likelihood that osteoporotic vertebral fractures might develop. he association between calciied atherosclerotic plaque and BMD was previous conirmed in other studies,11,12,26,31 which suggests
that calciication of the atherosclerotic plaque may be a regulated proc-ess similar to that of osteogenesis. Some recent studies have implicated osteoprotegerin (an indirect inhibitor of osteoclastogenesis and indica-tor of bone remodeling) in the process of human atherogenesis.32,33 It is
unclear whether osteoprotegerin should be considered to be an indepen-dent risk factor for cardiovascular diseases11 or to be a defense
mecha-nism for atherosclerotic progression.30
here are several limitations to our study. he irst limitation relates to its cross-sectional design, which implies that no causal inferences can be drawn. he study group was selected from among patients who had undergone DXA and not from the community, thus explaining the rela-tively high incidence of osteoporosis. Secondly, the presence of athero-sclerotic plaque was correlated only with total cholesterol, and not with LDL-cholesterol. Finally, we did not quantify the atherosclerotic plaque and we did not take into account the atherosclerotic efects of anti-hypertensive lipid- and glucose-lowering drugs.
CONCLUSIONS
In conclusion, among women referred for routine osteoporo-sis screening, the relationship between atheroscleroosteoporo-sis (as assessed by IMT and calciied plaque in carotid arteries) and osteoporosis (as-sessed by DXA) can be demonstrated. his relationship is valuable for comparisons between either cortical or trabecular bone and the left, right or mean CCA IMT. here was also a statistically signiicant rela-tionship between the presence of calciied atherosclerotic plaque and osteoporotic vertebral fractures. hese indings support the hypoth-esis that there are common pathological pathways involved in these two diseases.
REFERENCES
1. Mosca L, Manson JE, Sutherland SE, et al. Cardiovascular disease in women: a statement for healthcare professionals from the American Heart Association. Writing Group. Circulation. 1997;96(7):2468-82.
3. Bagger YZ, Tankó LB, Alexandersen P, Qin G, Christiansen C; Prospective Epidemiological Risk Factors Study Group. Radiographic measure of aorta calciication is a site-speciic predictor of bone loss and fracture risk at the hip. J Intern Med. 2006;259(6):598-605. 4. Hak AE, Pols HA, van Hemert AM, Hofman A, Witteman JC. Progression of aortic calciication
is associated with metacarpal bone loss during menopause: a population-based longitudi-nal study. Arterioscler Thromb Vasc Biol. 2000;20(8):1926-31.
5. Tankó LB, Christiansen C, Cox DA, et al. Relationship between osteoporosis and cardiovas-cular disease in postmenopausal women. J Bone Miner Res. 2005;20(11):1912-20. 6. von der Recke P, Hansen MA, Hassager C. The association between low bone mass at the
menopause and cardiovascular mortality. Am J Med. 1999;106(3):273-8.
7. Anagnostis P, Karagiannis A, Kakaika AI, et al. Atherosclerosis and osteoporosis: age-dependent degenerative processes or related entities? Osteoporos Int. 2009;20(2): 197-207.
8. Devine PJ, Carlson DW, Taylor AJ. Clinical value of carotid intima-media thickness testing. J Nucl Cardiol. 2006;13(5):710-8.
9. Lorenz MW, Markus HS, Bots ML, Rosvall M, Sitzer M. Prediction of clinical cardiovascular events with carotid intima-media thickness: a systematic review and meta-analysis. Circula-tion. 2007;115(4):459-67.
10. Sumino H, Ichikawa S, Kasama S, et al. Relationship between carotid atherosclero-sis and lumbar spine bone mineral density in postmenopausal women. Hypertens Res. 2008;31(6):1191-7.
11. Frost ML, Grella R, Millasseau SC, et al. Relationship of calciication of atherosclerotic pla-que and arterial stiffness to bone mineral density and osteoprotegerin in postmenopausal women referred for osteoporosis screening. Calcif Tissue Int. 2008;83(2):112-20. 12. Jørgensen L, Joakimsen O, Rosvold Berntsen GK, Heuch I, Jacobsen BK. Low bone mineral
density is related to echogenic carotid artery plaques: a population-based study. Am J Epidemiol. 2004;160(6):549-56.
13. Jørgensen L, Joakimsen O, Mathiesen EB, et al. Carotid plaque echogenicity and risk of nonvertebral fractures in women: a longitudinal population-based study. Calcif Tissue Int. 2006;79(4):207-13.
14. Stein JH, Korcarz CE, Hurst RT, et al. Use of carotid ultrasound to identify subclinical vascular disease and evaluate cardiovascular disease risk: a consensus statement from the American Society of Echocardiography Carotid Intima-Media Thickness Task Force. Endorsed by the Society for Vascular Medicine. J Am Soc Echocardiogr. 2008;21(2):93-111; quiz 189-90. 15. Touboul PJ, Hennerici MG, Meairs S, et al. Mannheim carotid intima-media thickness
consensus (2004-2006). An update on behalf of the Advisory Board of the 3rd and 4th Watching the Risk Symposium, 13th and 15th European Stroke Conferences, Mannheim, Germany, 2004, and Brussels, Belgium, 2006. Cerebrovasc Dis. 2007;23(1):75-80. 16. Assessment of fracture risk and its application to screening for postmenopausal
osteoporo-sis. Report of a WHO Study Group. World Health Organ Tech Rep Ser. 1994;843:1-129. 17. Lewiecki EM, Watts NB, McClung MR, et al. Oficial positions of the international society for
clinical densitometry. J Clin Endocrinol Metab. 2004;89(8):3651-5.
18. Kanis JA, McCloskey EV, Johansson H, et al. A reference standard for the description of osteoporosis. Bone. 2008;42(3):467-75.
19. Genant HK, Wu CY, van Kuijk C, Nevitt MC. Vertebral fracture assessment using a semiquan-titative technique. J Bone Miner Res. 1993;8(9):1137-48.
20. Pignoli P, Tremoli E, Poli A, Oreste P, Paoletti R. Intimal plus medial thickness of the arterial wall: a direct measurement with ultrasound imaging. Circulation. 1986;74(6):1399-406. 21. Bampi AB, Rochitte CE, Favarato D, Lemos PA, da Luz PL. Comparison of non-invasive
metho-ds for the detection of coronary atherosclerosis. Clinics (Sao Paulo). 2009;64(7):675-82. 22. Engström G, Melander O, Hedblad B. Carotid intima-media thickness, systemic
inlam-mation, and incidence of heart failure hospitalizations. Arterioscler Thromb Vasc Biol. 2009;29(10):1691-5.
23. Grifin M, Nicolaides A, Tyllis T, et al. Carotid and femoral arterial wall changes and the prevalence of clinical cardiovascular disease. Vasc Med. 2009;14(3):227-32.
24. Schreuder FH, Graf M, Hameleers JM, Mess WH, Hoeks AP. Measurement of common carotid artery intima-media thickness in clinical practice: comparison of B-mode and RF-based technique. Ultraschall Med. 2009;30(5):459-65.
25. Baim S, Binkley N, Bilezikian JP, et al. Oficial Positions of the International Society for Clinical Densitometry and executive summary of the 2007 ISCD Position Development Con-ference. J Clin Densitom. 2008;11(1):75-91.
26. Hmamouchi I, Allali F, Khazzani H, et al. Low bone mineral density is related to atherosclero-sis in postmenopausal Moroccan women. BMC Public Health. 2009;14;9:388. 27. Tamaki J, Iki M, Hirano Y, et al. Low bone mass is associated with carotid atherosclerosis
in postmenopausal women: the Japanese Population-based Osteoporosis (JPOS) Cohort Study. Osteoporos Int. 2009;20(1):53-60.
28. Uyama O, Yoshimoto Y, Yamamoto Y, Kawai A. Bone changes and carotid atherosclerosis in postmenopausal women. Stroke. 1997;28(9):1730-2.
29. Tekin GO, Kekilli E, Yagmur J, et al. Evaluation of cardiovascular risk factors and bone mi-neral density in post menopausal women undergoing coronary angiography. Int J Cardiol. 2008;131(1):66-9.
30. Siepi D, Marchesi S, Vaudo G, et al. Preclinical vascular damage in white postmenopausal women: the relevance of osteoprotegerin. Metabolism. 2008;57(3):321-5.
31. Hyder JA, Allison MA, Barrett-Connor E, et al. Bone mineral density and atherosclerosis: the Multi-Ethnic Study of Atherosclerosis, Abdominal Aortic Calcium Study. Atherosclerosis. 2010;209(1):283-9.
32. Anand DV, Lahiri A, Lim E, Hopkins D, Corder R. The relationship between plasma osteopro-tegerin levels and coronary artery calciication in uncomplicated type 2 diabetic subjects. J Am Coll Cardiol. 2006;47(9):1850-7.
33. Vik A, Mathiesen EB, Notø AT, et al. Serum osteoprotegerin is inversely associated with carotid plaque echogenicity in humans. Atherosclerosis. 2007;191(1):128-34.
Contributors: DF: conception, design, interpretation and coordination of the work, and writing the manuscript. CB: execution of the statistical analysis and interpretation of the study. AA: recruitment of subjects, revision of the manuscript; LM: execution of BMD, revision of the manuscript; SS: execution of BMD; LP: recruitment of subjects; AC: execu-tion of biochemical studies and interpretaexecu-tion of the results. All authors revised the inal version of the manuscript.
Sources of funding: This study was carried out with funds from ANCS (Romanian National Authority for Scientiic Research) 42107/2008 PNII grant
Conlict of interest: None
Date of irst submission: June 17, 2010
Last received: December 5, 2010
Accepted: February 21, 2011
Address for correspondence:
Daniela Fodor Clinica Medicală II 2-4
Clinicilor str 400006, Cluj-Napoca, Romania Tel: +4 0264 591942/442