The response of zooplankton
assemblages to variations in the water
quality of four man-made lakes in
semi-arid northeastern Brazil
WANESSA SOUSA1, JOSE´ LUIZ ATTAYDE1*, ELINEZ DA SILVA ROCHA1AND ENEIDA MARIA ESKINAZI-SANT’ANNA2
1
DEPARTAMENTO DE BOTAˆ NICA,ECOLOGIA E ZOOLOGIA,CENTRO DE BIOCIEˆ NCIAS,UNIVERSIDADE FEDERAL DO RIO GRANDE DO NORTE,CAMPUS UNIVERSITA´ RIO,59072-970NATAL,RN,BRAZIL AND2DEPARTAMENTO DE OCEANOGRAFIA E LIMNOLOGIA,CENTRO DE BIOCIEˆ NCIAS,UNIVERSIDADE FEDERAL DO RIO GRANDE DO NORTE,PRAIA DE MA˜ E LUIZA,59014-100NATAL,RN,BRAZIL
*CORRESPONDING AUTHOR: attayde@cb.ufrn.br
Received November 12, 2007; accepted in principle February 18, 2008; accepted for publication; February 26, 2008; published online February 28, 2008
Corresponding editor: Roger Harris
The response of zooplankton assemblages to variations in the water quality of four man-made lakes, caused by eutrophication and siltation, was investigated by means of canonical correspon-dence analysis. Monte Carlo simulations using the CCA eigenvalues as test statistics revealed that changes in zooplankton species composition along the environmental gradients of trophic state and abiogenic turbidity were highly significant. Brachionus calyciflorus, Thermocyclops sp. and Argyrodiaptomus sp. were good indicators of eutrophic conditions, whereas B. dolabratus, Keratella tropica and Hexarthra mira were good indicators of high turbidity due to suspended sediments. Overall, our results showed that changes in the water quality of man-made lakes in a tropical semi-arid region have significant effects on the structure of zooplankton assemblages that can poten-tially affect the functioning of these ecosystems.
I N T RO D U C T I O N
Dry lands are located in arid, semi-arid or dry subhumid climatic zones, comprising 41% of all continental areas of the Earth’s surface and are home to more than 2 billion people, or approximately one-third of the world population. In Brazil, the dry lands cover an area
equiv-alent to 11% of the national territory, where 13% of
the Brazilian population lives. It is estimated that around 20% of the dry lands of the planet are already completely desertified and that the desertified areas will increase considerably in the coming decades (Millennium Ecosystem Assessment, 2005).
In tropical semi-arid regions, the droughts and the highly irregular rainfall, together with high evaporation rates, cause the loss of a great part of the surface waters. As a result, almost the entire hydrologic network is
intermittent, which constitutes a severe problem for the supply and storage of this essential resource. Therefore, many reservoirs are constructed in these regions with the main purpose of storing water for multiple uses.
In order to guarantee a certain minimum volume of water in these reservoirs, the drainage basins of the reservoirs must occupy an area much larger than the area of the reservoir itself. Thus, an important distinc-tive characteristic of reservoirs in semi-arid regions is the high ratio between the area of the drainage basin and the area of the reservoir itself (Thornton and Rast, 1993). This important morphometric characteristic of reservoirs in semi-arid regions, together with a negative balance between precipitation and evaporation rates, affects several ecological processes in these ecosystems. They tend to have high concentrations of nutrients,
at Universidade Federal de Ouro Preto on October 31, 2012
http://plankt.oxfordjournals.org/
suspended solids and salts, favoring eutrophication, silta-tion and salinizasilta-tion.
The frequent alterations in trophic state, turbidity and salinity in these reservoirs represent an important selective factor for the success of potentially colonizing species. Furthermore, these reservoirs are relatively shallow environments, highly vulnerable to wind action and to oscillations in climatic conditions, which rep-resent other important selective factors for the biota. Hence, the composition and the relative abundance of species in the aquatic communities must be strongly influenced by the variations in the trophic state, turbid-ity and salinturbid-ity of the water and can theoretically be used as parameters to indicate the environmental alterations.
Zooplankton has been recommended as regional bioindicators of lake eutrophication (Attayde and
Bozelli, 1998; Pinto-Coelho et al., 2005a, b; Burns and
Galbraith, 2007; Stemberg and Lazorchack 1994;
Straile and Geller 1998), acidification (Pinel-Alloulet al.,
1990), watershed disturbances by agriculture (Dodson et al., 2005, 2007) or logging and wildfire (Patoineet al., 2002). Although zooplankton are usually considered to be good indicators of environmental changes and have a fundamental role in energy flow and nutrient cycling
in aquatic ecosystems, these organisms have been little studied in aquatic ecosystems in tropical semi-arid regions. Therefore, their potential value as indicators of alterations in the water quality of reservoirs in these regions needs to be assessed. Also, there is an increasing demand by environmental monitoring programs for bioindicators of water quality.
This study attempted to investigate how the trophic state, turbidity and salinity affect the structure of the zooplankton communities in four reservoirs in a tropical semi-arid region. We then assessed the potential of the zooplankton as a bioindicator of the main alterations in the water quality of these reservoirs.
M E T H O D
Study area
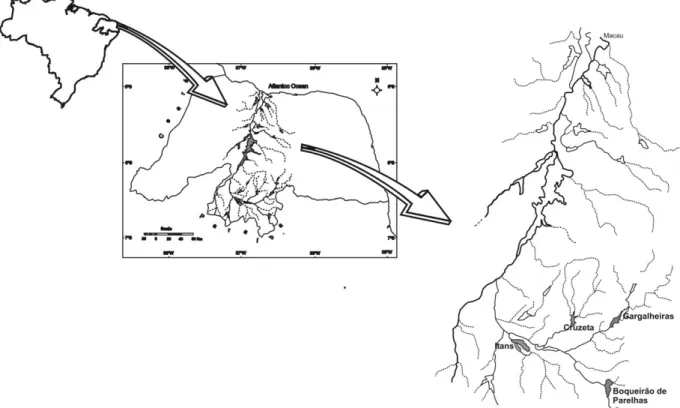
The present study was carried out in the Gargalheiras, Cruzeta, Itans and Boqueira˜o de Parelhas reservoirs, all of which are located in the Serido´ region of the state of Rio Grande do Norte, Brazil (Fig. 1). The four reser-voirs are located in the basin of a river of the same name, the Serido´ River, which is one of the main
Fig. 1. Location of the study area, highlighting the Gargalheiras, Cruzeta, Itans and Boqueira˜o de Parelhas reservoirs, state of Rio Grande do Norte, Brazil.
at Universidade Federal de Ouro Preto on October 31, 2012
http://plankt.oxfordjournals.org/
tributaries of the Piranhas-Assu River. This hydro-graphic basin lies entirely in a semi-arid region, with a mean annual rainfall of 500 mm and a great spatial – temporal irregularity in its rainy season. In general, pre-cipitation levels above 100 mm are only reached between February and May, and the remaining months are marked by an almost complete lack of precipitation. The soil of the areas surrounding these reservoirs is shallow and highly susceptible to erosion during the rainy periods.
Sampling
Water sampling was carried out monthly from March to December 2005, covering both the dry and rainy seasons of the region. Samples were taken at three different points along the longitudinal axis of the reser-voir: one in the zone nearest the delta of the main tributary, one in the center of the reservoir and another in the zone nearest the dam.
The water samples were collected with a Van Dorn bottle at 1 m vertical depth intervals and integrated for the collection of 2 L subsamples from each collection
point. pH and conductivity were measuredin situwith a
HORIBA model U-23 multiparameter probe. The values of conductivity were used as an approximation for the estimation of salinity. Water transparency was measured with a Secchi disk. Concentrations of
chloro-phylla(Chla) were determined with a Turner TD 700
fluorometer after filtration of the water through fiber-glass filters (Whatman 934-AH) and extraction of the
pigments with ethanol at room temperature for 20 h
(Jespersen and Christoffersen, 1988). The concentrations of total phosphorus were determined after digestion of the samples with potassium persulfate by the ascorbic acid method (APHA, 1989). In order to determine the concentrations of total suspended solids (STS), the water samples were filtered with Whatman 934-AH filters previously dried and weighed. The filters
contain-ing the particulate matter were again dried at 1058C
for 1 h and then weighed on an analytical balance.
This procedure was repeated until a stable weight was established. In order to determine the concentrations of fixed suspended solids (SFS), the filters were incinerated
in a muffle furnace at 5508C for 15 min and their ashes
were weighed. Volatile suspended solids (SVS) were determined by the difference between the STS and the SFS according to the APHA (APHA, 1989).
The zooplankton samples were collected with a
68mm mesh plankton net towed vertically. The volume
of filtered water was calculated as the product of the net mouth area and the tow depth, assuming a 100% filter-ing efficiency of the net. The collected material was
stored in polyethylene bottles and fixed with Lugol’s sol-ution. The organisms were counted after the integration of the samples from the three points of each reservoir, totaling 35 samples of zooplankton, or one integrated sample per month for each reservoir. For abundance estimates, the integrated samples were mixed and 1 mL
subsamples were taken with a Stempel pipette.
Counting was carried out using an optical microscope in a Sedgwick-Rafter chamber with 1 mL capacity until the coefficients of variation of the most abundant species were lower than 20%.
Statistical analyses
We performed an ANOVA and the Tukey HSD (hon-estly significant difference) test to test for differences in limnological features between the reservoirs. The data were transformed to natural logarithms to satisfy the premises of homogeneity of variances and normality of the analyses. A principal components analysis (PCA) was used to ordinate the 35 sample units and 9 environmental variables on a few factorial axes with the purpose of reducing the dimensionality of the data and describing the relationships between these variables. The PCA was performed from the linear correlation matrix of the environmental variables after logarithmic transformation of the data, except for the pH data.
A canonical correspondence analysis (CCA) was per-formed in order to detect the relations between the abundance of the zooplankton species and the environ-mental variables analyzed. The ordination analyses were performed with the program CANOCO version 4 (Ter Braak, 1986; Ter Braak and Smilauer, 1998). To evaluate the significance of the CCA axes and of the environmental variables which defined these axes, Monte Carlo tests were performed with 999 unrest-ricted permutations, using the eigenvalues of the axes as test statistics (Ter Braak and Prentice, 1988). Thus, it was possible to test the significance of the environ-mental variables in determining the ordination patterns of the species and to assess the potential of certain groups of species as indicators of environmental con-ditions in these reservoirs.
To determine the relationship between the
zooplank-ton community structure and the environmental
variables indicating eutrophication, salinization and siltation, we used abundance-weighted averaging to
calculate taxon-specific optima along gradients of Chla,
conductivity and suspended fixed solids respectively (Ter Braak and Smilauer 1998). Calculations of weighted average optima (WAopt) of zooplankton taxa were
at Universidade Federal de Ouro Preto on October 31, 2012
http://plankt.oxfordjournals.org/
carried out using the following equation:
WAopt¼
Pn
iPðAiViÞ n iAi
where Ai is the taxon’s abundance in sample i, Vi the
abundance/concentration of the environmental variable
in sampleiandnthe number of samples.
R E S U LT S
Environmental variables
High concentrations of total phosphorus were observed in the water of the reservoirs, especially in Gargalheiras and Cruzeta (Table I). Nevertheless, the reservoirs
con-tained very different concentrations of Chl a, clearly
indicating that there is a high variability in the response of the planktonic algae when faced with high con-centrations of phosphorus in these environments. Gargalheiras Reservoir contained a high phytoplankton biomass, while the remaining reservoirs contained low
concentrations of Chl a, despite their high
concen-trations of total P (Table I). Therefore, Gargalheiras Reservoir is the only one that can be safely classified as eutrophic, as in addition to its high concentrations of
total P, it has equally high concentrations of Chl a and
suspended particulate organic matter. The major part of the STS in Gargalheiras Reservoir was composed of organic matter, as indicated by the results of SVS. On the other hand, in Cruzeta Reservoir, the STS were mostly of inorganic origin, as indicated in the results for the SFS. The remaining reservoirs showed a more even
distribution of the two fractions of suspended solids. The high concentrations of SFS in Cruzeta Reservoir are probably related to its shallow depth, which facili-tates re-suspension of the sediments, thus reducing water transparency. The mean pH values did not differ among the reservoirs. The mean values of conductivity were significantly higher in Boqueira˜o de Parelhas and Gargalheiras (Table I).
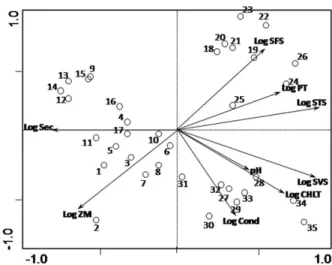
In the PCA, the two first factors together explained 72.4% of the total variance of the environmental
vari-ables data. The first factorial axis (l1¼0.493) explained
49.3% of the variance of the data, whereas the second
axis (l2¼0.231) explained 23.1% of this variance. The
ordination diagram shows the coordinates of the sample units and of the environmental variables on the two first factorial axes (Fig. 2). In the PCA, the coordinates of the environmental variables represent the angular coef-ficients of the linear functions that describe the relation-ships between these variables and the factorial axes of the ordination. Thus, the position of the coordinate of a given environmental variable in relation to the origin (0,0) of the diagram indicates the variation rate of this variable along each axis. The vector which links the point of origin (0,0) of the diagram to the point refer-ring to the coordinate of the variable in question points to the sample units where the value of this variable increases more rapidly.
For the interpretation of the factorial axes, the corre-lations of the environmental variables with the respect-ive axes were calculated (Table II). The concentrations
of total and volatile solids, total P and Chlashowed the
highest positive correlation with the first axis, whereas the Secchi disk depth and the mean depth showed strong negative correlations with this axis. The second axis showed a strong positive correlation with the
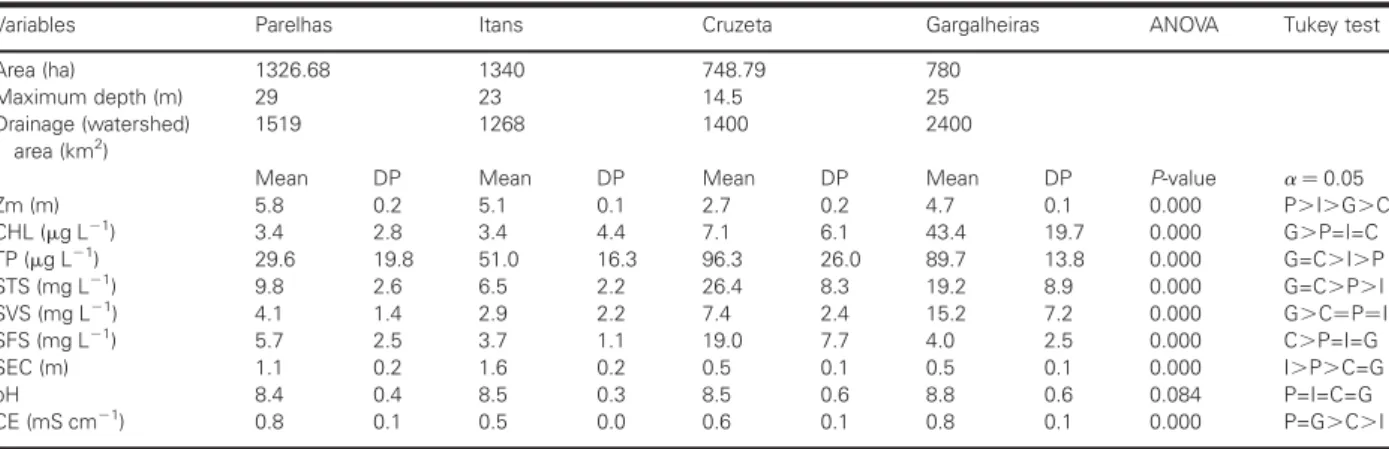
Table I: Means and standard deviations of the limnological variables in the four reservoirs
Variables Parelhas Itans Cruzeta Gargalheiras ANOVA Tukey test
Area (ha) 1326.68 1340 748.79 780
Maximum depth (m) 29 23 14.5 25
Drainage (watershed) area (km2)
1519 1268 1400 2400
Mean DP Mean DP Mean DP Mean DP P-value a¼0.05
Zm (m) 5.8 0.2 5.1 0.1 2.7 0.2 4.7 0.1 0.000 P.I.G.C
CHL (mg L21) 3.4 2.8 3.4 4.4 7.1 6.1 43.4 19.7 0.000 G
.P=I=C TP (mg L21) 29.6 19.8 51.0 16.3 96.3 26.0 89.7 13.8 0.000 G=C
.I.P STS (mg L21
) 9.8 2.6 6.5 2.2 26.4 8.3 19.2 8.9 0.000 G=C.P.I
SVS (mg L21) 4.1 1.4 2.9 2.2 7.4 2.4 15.2 7.2 0.000 G
.C¼P¼I
SFS (mg L21) 5.7 2.5 3.7 1.1 19.0 7.7 4.0 2.5 0.000 C
.P=I=G
SEC (m) 1.1 0.2 1.6 0.2 0.5 0.1 0.5 0.1 0.000 I.P.C=G
pH 8.4 0.4 8.5 0.3 8.5 0.6 8.8 0.6 0.084 P=I=C=G
CE (mS cm21) 0.8 0.1 0.5 0.0 0.6 0.1 0.8 0.1 0.000 P=G
.C.I
Results of the ANOVA and the Tukey test for differences in the variables between the reservoirs. Zm, mean depth; CHL, chlorophylla; TP, total phosphorus; STS, suspended total solids; SVS, suspended volatile solids; SFS, fixed suspended solids; Sec, Secchi disk depth; CE, conductivity.
at Universidade Federal de Ouro Preto on October 31, 2012
http://plankt.oxfordjournals.org/
concentrations of SFS and a strong negative correlation with conductivity and mean depth. It can be observed in the ordination diagram (Fig. 2) that the sample units from Gargalheiras (27 – 35) and Cruzeta (18 – 26) were positively correlated with the first PCA axis, whereas the sample units from Itans (9 – 17) and Boqueira˜o de Parelhas (1 – 8) were negatively correlated with this axis. In relation to the second axis of the PCA, the sample units from Gargalheiras and Parelhas were negatively correlated, whereas those from Cruzeta and Itans were positively related to this axis.
These results indicate that the sample units from Gargalheiras Reservoir were strongly associated with
the highest concentrations of Chl a and SVS and with
the highest values of conductivity, whereas the sample units from Cruzeta Reservoir were strongly associated with the highest concentrations of SFS and with the lower mean depths. The highest concentrations of total
P and STS were strongly associated with these two reservoirs, and, due to this fact, the vectors of these two variables were positioned between the coordinates of the sample units of these reservoirs. The sample units of Boqueira˜o de Parelhas Reservoir were strongly associ-ated with the highest values of mean depth and the lowest concentrations of total P and of total and SFS. The sample units of Itans Reservoir were strongly associated with the lowest concentrations of total and
SVS and with the lowest concentrations of Chl a.
Overall, the pattern of variation found in the limnologi-cal variables among the four reservoirs is well repro-duced by these first two PCA ordination axes.
Zooplankton community
During the study period, 21 zooplankton species were recorded. The occurrence frequencies and mean den-sities of the taxa found in the four reservoirs are shown in Table III. The species that occurred generally with
the highest frequencies were: Brachionus falcatus,
Brachionus sp., Filinia terminalis, Hexarthra mira, Keratella americana,K. tropica,B. dolabratus,B. havanensis,Ceriodaphnia cornuta, Diaphanosoma spinulosum, Moina minuta, Notodiaptomus cearensis, Mesocyclops sp., Thermocyclops sp. and calanoid and cyclopoid copepodids and nauplii. However, the species occurring with the highest fre-quencies were not always the same as those with the highest densities. Among the species with the highest
densities were: Brachionus sp., K. tropica, B. dolabratus,
F. terminalis, H. mira, C. cornuta, N. cearensis (adults, cope-podids and nauplii). Overall, Itans and Cruzeta reser-voirs supported the highest densities of rotifers, whereas Parelhas and Gargalheiras supported the highest den-sities of copepods.
A CCA was used to investigate the response of each species to the environmental variables analyzed. Among the nine environmental variables, only conductivity,
mean depth, Secchi disk depth, Chl a and SFS were
selected for inclusion in the CCA regression model. The remaining variables did not explain any meaning-ful proportion of the residual variance, and were there-fore excluded from the analysis (Table IV). The results of the CCA indicate that the first two axes of the ordi-nation defined by the five environmental variables selected explained collectively 42.5% of the variance in the weighted mean of the species (Table V). The Monte Carlo test with 999 permutations demonstrated that
both the first canonical axis (l1¼0.607;
F-ratio¼12.219) and the sum of all canonical axes
(trace¼1.053; F-ratio¼6.131) were highly meaningful
(P¼0.001).
Fig. 2. Ordination diagram by PCA of the 35 sample units based on the correlation matrix of the nine environmental variables. Sample units of Boqueira˜o de Parelhas (1 – 8), Itans (9 –17), Cruzeta (18 –26) and Gargalheiras (27 – 35) reservoirs (see Table I for abbreviations).
Table
II: Correlation
coefficients
between
environmental variables and the first two PCA
axes
Axis 1 Axis 2
TP 0.75 0.25
Zm 20.67 20.66
CHL 0.67 20.58
STS 0.95 0.16
SVS 0.84 20.40
SFS 0.49 0.71
SEC 20.91 0.05
pH 0.35 20.20
CE 0.39 20.70
See Table I for abbreviations.
at Universidade Federal de Ouro Preto on October 31, 2012
http://plankt.oxfordjournals.org/
Figure 3 shows the CCA ordination diagram with only the two first and most important ordination axes. This diagram shows the patterns of variation in the specific composition of the community, which can be explained by the five environmental variables, and also shows the distribution patterns of the species along each
environmental variable or gradient. The vectors of the
environmental variables shown in this diagram
explained collectively 82.7% of the variance in the weighted means of the species in relation to the five environmental variables (Table V).
Based on Fig. 3, it can be inferred thatArgyrodiaptomus
sp., Thermocyclops sp. and B. calyciflorus were principally found in more eutrophic habitats, in this case Gargalheiras Reservoir. On the other hand, the projec-tion of the species in the vector which represents a gradient of the concentrations of SFS shows that
Table III: List of zooplankton taxa found in the four reservoirs
Species Boqueira˜o de Parelhas Reservoirs Itans Cruzeta Gargalheiras
Protozoa Protozoa
Testate amoebae 100.0 (92.4) 100.0 (28.9) 66.7 (1.5) 88.9 (284.8)
Rotifera Rotifera
B. calyciflorus 22.2 (0.3) 44.4 (3.3) 44.4 (10.8)
B. dolabratus 12.5 (0.2) 77.8 (3.49) 100.0 (46.7) 44.4 (0.4)
B. falcatus 100.0 (8.1) 88.9 (2.3) 100.0 (6.8) 44.4 (0.6)
B. havanensis 12.5 (0.1) 44.4 (0.4) 100.0 (5.7) 88.9 (8.5)
Brachionussp. 37.5 (0.5) 100.0 (256.8) 100.0 (130.7) 33.3 (0.2)
F. terminalis 37.5 (2.6) 100.0 (15.0) 100.0 (44.6) 100.0 (14.5)
F. opoliensis 44.4 (0.8) 77.8 (2.9)
Hexarthrasp. 75.0 (4.6) 100.0 (14.4) 100.0 (109.1) 55.5 (1.3)
K. americana 100.0 (25.0) 100.0 (16.4) 22.2 (0.2)
K. tropica 12.5 (0.2) 100.0 (88.0) 100.0 (230.2) 66.7 (11.9)
Lecanesp.1 12.5 (0.1) 22.2 (0.2) 11.1 (0.4) 22.2 (0.3)
Lecanesp. 2 100.0 (51.3) Cladocera
Cladocera
C. cornuta 100.0 (25.8) 100.0 (9.0) 77.8 (3.9) 22.2 (3.1)
D. spinulosum 100.0 (12.2) 88.9 (2.1) 100.0 (8.0) 77.8 (2.5)
M. minuta 75.0 (6.1) 100.0 (6.1) 100.0 (9.9) 22.2 (0.3)
Neonats 87.5 (3.1) 77.8 (1.6) 66.7 (1.2) 11.1 (0.2)
Copepoda Copepoda
Argyrodiaptomus sp. 44.4 (0.6)
Calanoida Copepodites 87.5 (8.1) 100.0 (24.2) 100.0 (8.6)
Cyclopoida Copepodites 33.3 (0.7) 22.2 (1.0)
Mesocyclopssp. 87.5 (2.2) 100.0 (3.4) 88.9 (7.6) 77.8 (7.8)
Calanoida Nauplii 100.0 (27.9) 100.0 (51.4) 100.0 (128.0) 100.0 (33.7)
Ciclopoida Nauplii 100.0 (0.7) 100.0 (4.7) 8.9 (1.0)
Notodiaptomussp. 100.0 (63.1) 100.0 (32.0) 100.0 (27.1) 100.0 (85.4)
Thermocyclopssp. 33.3 (0.7) 100.0(13.7)
Other taxa Other taxa
Chaoborussp. 33.3 (0.2) 66.7 (1.1) 22.2(0.1)
Values are relative frequency of occurrence (%) and in parenthesis mean density (ind. L21) of each taxon over all samples.
Table IV: Results of the Monte Carlo test
with 999 permutations for the selection of the
environmental variables which could explain a
significant proportion of the variance of the
species
Variables Variance explained FF-ratio PP-value
CE 0.42 8.56 0.0010
Zm 0.30 7.26 0.0010
SEC 0.14 3.68 0.0010
CHL 0.10 2.80 0.0030
TP 0.04 1.08 0.3180
pH 0.05 1.47 0.1360
STS 0.03 0.86 0.5370
SVS 0.02 0.54 0.8440
SFS 0.09 2.56 0.0160
See Table I for abbreviations.
Table V: Eigenvalues of the first four CCA
axes and their respective cumulative proportions
of the variance of the species
Axis 1 Axis 2 Axis 3 Axis 4
Eigenvalues 0.60 0.26 0.09 0.06
% Variance 29.6 42.5 47.0 50.2
Correlations 0.96 0.83 0.82 0.87
% Variance 57.7 82.7 91.5 97.6
Species-environment correlations and cumulative proportions of the variance of the relationships between the species and the environmental variables.
at Universidade Federal de Ouro Preto on October 31, 2012
http://plankt.oxfordjournals.org/
B. dolabratus, K. tropica and H. mira were predominantly found in more turbid habitats, specifically in Cruzeta Reservoir. Thus, the approximate species composition in each sample unit can be inferred by the proximity of the coordinates of the species to the coordinates of the sample units. In order to identify the distribution pat-terns of the species along the environmental gradients, the coordinates of the species are projected perpendicu-larly along the vectors of the environmental variables. The projection order of the points in the vectors corre-sponds approximately to the ranks of the weighted means of the species in relation to the variable in ques-tion. Hence, the projection of the points of the species in the vectors of each environmental variable allows for an approximate visualization of the distribution centers of the species along the environmental gradient in ques-tion (ter Braak, 1986).
The abundance and distribution of each zooplankton taxon along the environmental gradients of eutrophica-tion, salinization and siltation in the reservoirs can also be investigated by calculating their abundance-weighted
optima of Chl a, conductivity and suspended fixed
solids, respectively. For example, the copepods
Argyrodiaptomus sp. and Thermocyclops sp. and the rotifers B. calyciflorus and B. havanensisshowed their abundance-weighted optima at the highest levels of algal biomass,
whereas other species of rotifers (Brachionus sp, F.
opolien-sis, K. americana and H. mira) and the cladocerans C. cornuta andM. minutawere generally more abundant
at much lower concentrations of Chl a (Table VI). A
similar pattern was found for conductivity, which is highly correlated with the trophic state of the reservoirs. On the other hand, these results confirm that the rotifer B. dolabratus showed its abundance-weighted optima at the highest concentration of suspended fixed solids,
whereas the copepods Thermocyclops, Argyrodiaptomus and
Notodiaptomus were more abundant in less turbid waters (Table VI).
D I S C U S S I O N
It has long been recognized that an increase in phos-phorus concentration can cause an increase in phyto-plankton productivity, resulting in the eutrophication of lakes and reservoirs. However, a discrepancy was observed between the concentrations of total phos-phorus and the phytoplankton biomass in the reservoirs
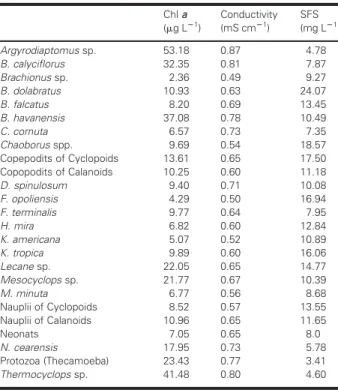
Table VI: Abundance-weighted optima of Chl
a and fixed suspended solids concentrations
and of electric conductivity for the zooplankton
taxa found in the four reservoirs
Chlaa
(mg L21)
Conductivity (mS cm21)
SFS (mg L21)
Argyrodiaptomussp. 53.18 0.87 4.78
B. calyciflorus 32.35 0.81 7.87
Brachionussp. 2.36 0.49 9.27
B. dolabratus 10.93 0.63 24.07
B. falcatus 8.20 0.69 13.45
B. havanensis 37.08 0.78 10.49
C. cornuta 6.57 0.73 7.35
Chaoborusspp. 9.69 0.54 18.57 Copepodits of Cyclopoids 13.61 0.65 17.50 Copopodits of Calanoids 10.25 0.60 11.18
D. spinulosum 9.40 0.71 10.08
F. opoliensis 4.29 0.50 16.94
F. terminalis 9.77 0.64 7.95
H. mira 6.82 0.60 12.84
K. americana 5.07 0.52 10.89
K. tropica 9.89 0.60 16.06
Lecanesp. 22.05 0.65 14.77
Mesocyclopssp. 21.77 0.67 10.39
M. minuta 6.77 0.56 8.68
Nauplii of Cyclopoids 8.52 0.57 13.55 Nauplii of Calanoids 10.96 0.65 11.65
Neonats 7.05 0.65 8.0
N. cearensis 17.95 0.73 5.78
Protozoa (Thecamoeba) 23.43 0.77 3.41
Thermocyclopssp. 41.48 0.80 4.60 Fig. 3. Ordination diagram by CCA of the zooplankton species and
of the sample units of Boqueira˜o de Parelhas (1 –8), Itans (9 –17), Cruzeta (18 – 26) and Gargalheiras (27 – 35) reservoirs. Circles represent the sample units, triangles the species and vectors the environmental variables. The vectors of the environmental variables
are: CHL, chlorophylla; Sec, Secchi disk depth; Cond, conductivity;
ZM, mean depths. The taxa shown are: Diaspi, Diaphanosoma
spinulosum; Tecame, Thecamebae; Kertro, Keratella tropica; Hexart,
Hexarthra sp.; Moimin, Moina minuta; Cercor, Ceriodaphnia cornuta; Neonat, neonata; CopCal, copepodids of Calanoida; CopCic, copepodids of Cyclopoida; NauCal, Naupii of Calanoid; NauCic,
Nauplii of Cyclopoida; Notod, Notodiaptomus cearensis; Mesocy,
Mesocyclops sp.; Brasp, Brachionus sp.; Lecane, Lecane sp.; Bradol,
Brachionus dolabratus; Brafal, Brachionus falcatus; Filopo, Filinia opoliensis;
Kerame, Keratella americana; Chaobo, Chaoborussp.; Brahav, Brachionus
havanensis; Thermo, Thermocyclops sp.; Bracal, Brachionus calyciflorus;
Argyro,Argyrodiaptomussp. Filter,Filinia terminalis.
at Universidade Federal de Ouro Preto on October 31, 2012
http://plankt.oxfordjournals.org/
studied. The availability of light and/or nitrogen might possibly also be important factors limiting primary pro-duction in some of these environments (Canfield and Bachmann, 1981; Smith, 1982). According to more adequate trophic classification criteria for semi-arid
regions, concentrations above 60mg L21
total
phos-phorus and 12mg L21
Chl a are indicative of an
eutrophic state (Thornton and Rast, 1993). Therefore, we can classify Gargalheiras, Cruzeta and Itans reser-voirs as eutrophic and Boqueira˜o de Parelhas Reservoir as mesotrophic, based on the average concentrations of total phosphorus. If the trophic classification is based on
the average values of Chl a, then we can still classify
Gargalheiras Reservoir as eutrophic, the other reservoirs can be considered to be mesotrophic.
The ordination of the zooplankton community by CCA showed that the community variation patterns were significantly related to the environmental hetero-geneity patterns observed in the reservoirs. The five
environmental variables, Chl a, conductivity, mean
depth, Secchi disk depth and SFS, significantly explained the principal variations in the species com-position of the zooplankton community. Our hypoth-esis that the trophic state, turbidity and salinity would be determining factors for the community organization was confirmed by the results of the ordination.
The ordination of the community with the CCA technique allowed for an examination of the zooplank-ton community distribution patterns of the different species in the sample units, a direct evaluation of the species’ response to the environmental variation pat-terns, and therefore the evaluation and testing of the indicative properties of certain groups of zooplankton species to some important environmental factors in the reservoirs. Thus, the species distribution patterns along
the main environmental gradients showed that
Argyrodiaptomus sp., Thermocyclops sp. and B. calyciflorus had abundance peaks in environments with higher
con-centrations of Chl a, that is, more eutrophic
environ-ments; whereas B. dolabratus, K. tropica andH. mira were
more abundant in more turbid environments, with
higher concentrations of SFS, andC. cornutaandN.
cear-ensis had higher densities in environments with greater mean depths.
The responses of the zooplankton community along a spatial gradient of trophic level, salinity and turbidity can be used for practical purposes in environmental monitoring. The attempt to use organisms as indicators of environmental conditions provides early signs of environmental stress in the ecosystems from obser-vations of the responses of these organisms to certain natural or anthropogenic disturbances (Schindler, 1987).
However, there is no intention to substitute the conven-tional methods for the measurement of the environ-mental variables, which can be measured directly by monitoring the physical and chemical variables of the environment, but to make use of the studies of the zoo-plankton community as an auxiliary method in the monitoring of these areas.
Among the species identified as indicators of eutro-phication in these reservoirs as well as in other regions,
the rotiferB. calyciflorusstands out for its great tolerance
to extremely eutrophic environments (Sla´decek, 1983) and to high conductivity (Berzins and Pjeler, 1989). Studies by Bernardi and Giussani (Bernardi and Giussani, 1990) and Gilbert (Gilbert, 1994) demon-strated that the feeding and reproductive rates of these rotifers in the presence of cyanobacteria in eutrophic environments are not affected, which means that their tolerance to these factors explains their high densities in Gargalheiras Reservoir.
On the other hand, in relation to the calanoid cope-pods, research carried out principally in temperate
regions by Quintanaet al. (Quintanaet al., 1998) and in
some tropical reservoirs (Boneckeret al., 2007) indicated
that populations of calanoids tend to be reduced in eutrophic environments. Studies in tropical regions by
Rochaet al. (Rocha et al., 1997) and Pinto-Coelho et al.
(Pinto-Coelhoet al. 2005a, b) agree with the general
pat-terns described in the literature. However, the results obtained by Tundisi and Matsumura-Tundisi (Tundisi and Matsumura-Tundisi, 1990), Matsumura-Tundisi and Tundisi (Matsumura-Tundisi and Tundisi, 2005) and in the present study point to other structural pat-terns of the zooplankton communities. Calanoids are found both in mesotrophic and in eutrophic
environ-ments, as is the case of N. cearensis, found in high
den-sities both in the mesotrophic Boqueira˜o de Parelhas Reservoir and in the eutrophic Gargalheiras Reservoir, and Argyrodiaptomus sp., found only in Gargalheiras Reservoir, indicating that perhaps these patterns are not valid for all regions, neither for tropical nor much less for semi-arid regions. Thus, studies by Reid (Reid,
1989) and Panosso et al. (Panosso et al., 2003) indicated
that the species of the genusNotodiaptomus, as well as the
cyclopoid genusThermocyclops, is able to reach high
den-sities in eutrophic environments, dominated by cyano-bacteria, by making use of small colonies as a feeding resource besides other groups of phytoplankton and protozoa.
On the other hand, the high abiogenic turbidity present in these reservoirs allows rotifers to become more abundant in relation to cladocerans (Pedrozo and Rocha, 2005). Among the cladocerans, the species of
the genus Moina and Diaphanosoma is generally favored
at Universidade Federal de Ouro Preto on October 31, 2012
http://plankt.oxfordjournals.org/
(Cuker and Hudson, 1992; Maia-Barbosa and Bozelli,
2006). Thus, the rotifer species B. dolabratus, K. tropica
and Hexarthra sp., identified as indicators of turbid environments, are found in higher densities mainly in Cruzeta Reservoir, where the shallow depth and the wind action promote a high re-suspension of sediments into the water column. The tolerance of this group to these environments is due to their ability to avoid the ingestion of inorganic particles, through sensor cells present in the mouth region (Pedrozo and Rocha, 2005), promoting a greater adaptive success of this group in relation to the others. Moreover, according to Thorp and Mantovani (Thorp and Mantovani, 2005) rotifers probably do better in turbid waters because the negative effects of competition and predation are par-tially alleviated by high suspended sediment loads, which affects substantially their predators (e.g. cyclopoid copepods) and food competitors (cladocera).
Finally, we observed a major differentiation in the structure of the zooplankton community in these reser-voirs. On the one hand, Itans and Cruzeta reservoirs support dense populations of rotifers, and on the other, Gargalheiras and Boqueira˜o de Parelhas support high densities of copepods. The later reservoirs, despite exhi-biting different trophic states, had a greater conductivity which might have selected against rotifers in favor of copepods.
To conclude, our results confirm our hypothesis that zooplankton communities significantly respond to major changes in the water quality of reservoirs in semi-arid regions driven mainly by eutrophication, siltation and salinization due to evaporation. Therefore, they should be used in biomonitoring programs of water quality in these dry lands, where the sparse water resources often limit both human and wildlife development.
AC K N O W L E D G E M E N T S
We thank Reinaldo Luiz Bozelli and Renata Panosso for their suggestions to improve the quality of this manuscript, and Susanna Paggi for confirmation of some rotifer species. We thank Edson Santana for helping us with the sampling.
F U N D I N G
The financial support was received from the Brazilian agencies CAPES and CNPq.
R E F E R E N C E S
APHA (1989)Standard Methods for the Examination of Water and Wastewater.
American Public Health Association, Washington, DC.
Attayde, J. L. and Bozelli, R. L. (1998) Assessing the indicator proper-ties of zooplankton assemblages to disturbance gradients by canonical
correspondence analysis.Can. J. Fish. Aquat. Sci.,55, 1789–1797.
Bernardi, R. and Giussani, G. (1990) Are blue-green algae a suitable
food for zooplankton? An overview.Hydrobiologia,200/201, 29 – 41.
Berzins, B. and Pjeler, B. (1989) Rotifer occurrence and trophic
degree.Hydrobiologia,182, 171 – 180.
Bonecker, C. C., Nagae, M. Y., Bletller, M. C. M. et al. (2007)
Zooplankton biomass in tropical reservoirs in southern Brazil.
Hydrobiologia,579, 115 – 123.
Burns, C. W. and Galbraith, L. M. (2007) Relating planktonic microbial food web structure in lentic freshwater ecosystems to
water quality and land use.J. Plankton Res.,29, 127 – 139.
Canfield, D. E., Jr and Bachmann, R. W. (1981) Prediction of total phosphorus concentrations, chlorophyll a, and Secchi depths in
natural and artificial lakes.Can. J. Fish. Aquat. Sci,38, 414–423.
Cuker, B. E. and Hudson, L., Jr (1992) Type of suspended clay
influ-ences zooplankton response to phosphorus loading.Limnol. Oceanogr,
37, 566 – 576.
Dodson, S. I., Lillie, R. A. and Will-Wolf, S. (2005) Land use, water chemistry, aquatic vegetation, and zooplankton community structure
of shallow lakes.Ecol. Appl.,15, 1191– 1198.
Dodson, S. I., Everhart, W. R., Jandl, A. K. et al. (2007) Effect of
watershed land use and lake age on zooplankton species richness.
Hydrobiologia,579, 393 – 399.
Gilbert, J. J. (1994) Susceptibility of plankton rotifers to a toxic strain ofAnabaena flos- aquae.Limnol. Oceanogr,39, 1286– 1297.
Jespersen, A. M. and Christoffersen, K. (1988) Measurements of
chlorophyll-a from phytoplankton using ethanol as extraction
solvent.Arch. Hydrobiol,109, 445 – 454.
Maia-Barbosa, P. M. and Bozelli, R. L. (2006) Community structure and temporal dynamics of cladocerans in an Amazonian lake (lake
Batata, PA, Brazil) impacted by bauxite tailings. Acta Limnol.
Brasililencia,18, 67 – 75.
Matsumura-Tundisi, T. and Tundisi, J. G. (2005) Plankton richness in
a eutrophic reservoir (Barra Bonita Reservoir, SP, Brazil).
Hydrobiologia,542, 367 – 378.
Millennium Ecosystem Assessment (2005)Ecosystems and Human Well Being:
Desertification Synthesis. World Resources Institute, Washington, DC.
Panosso, R., Carlsson, P., Kozlowsky-Suzuki, B.et al. (2003) Effect of
grazing by a neotropical copepod,Notodiaptomus, on a natural
cyano-bacterial assemblage and on toxic and non- toxic cyanocyano-bacterial
strains.J. Plankton Res.,25, 1169 – 1175.
Patoine, A., Pinel-Allou, B. and Prepas, E. E. (2002) Influence of catchment deforestation by logging and natural forest fires on crus-tacean community size structure in lakes of the Eastern Boreal
Canadian forest.J. Plankton Res.,24, 601 – 616.
Pedrozo, C. S. and Rocha, O. (2005) Zooplankton and water quality of lakes of the Northern Coast of Rio Grande do Sul State, Brazil.
Acta Limnol. Brasiliensia,17, 445 – 464.
Pinel-Alloul, B., Me´thot, G., Verreault, G. et al. (1990) Zooplankton
species associations in Quebec lakes: variation with abiotic factors,
including natural and anthropogenic acidification. Can. J. Fish.
Aquat. Sci.,47, 110 – 121.
at Universidade Federal de Ouro Preto on October 31, 2012
http://plankt.oxfordjournals.org/
Pinto-Coelho, R. M., Bezerra-Neto, J. F. and Morais, C. A., Jr (2005a) Effects of eutrophication on size and biomass of crustacean
zoo-plankton in a tropical reservoir.Braz. J. Biol.,65, 325 – 338.
Pinto-Coelho, R., Pinel-Alloul, B., Me´thot, G. et al. (2005b)
Crustacean zooplankton in lakes and reservoirs of temperate and
tropical regions: variation with trophic status.Can. J. Fish. Aquatic
Sci.,62, 348 – 361.
Quintana, X. D., Comı´n, F. A. and Amich, R. M. (1998) Nutrient and plankton dynamics in a Mediterranean salt marsh dominated by incidents of flooding. Part 2. Response of the zooplankton
com-munity to disturbances.J. Plankton Res.,20, 2109– 2127.
Reid, J. W. (1989) The distribution of species of the genusThermocyclops
(Copepoda, Cyclopoida) in the western hemisphere, with description ofT. parvus, new species.Hydrobiologia,175, 149 – 174.
Rocha, O., Matsumura-Tundisi, T. and Sampaio, E. C. (1997) Phytoplankton and zooplankton community structure and pro-duction related to trophic state in some Brazilian lakes and
reser-voirs.Ver. Int. Ver. Limnol.,26, 599 – 604.
Schindler, D. W. (1987) Detecting ecosystem responses to
anthropo-genic stress.Can. J. Fish. Aquatic Sci.,44, 6 – 25.
Sla´decek, V. (1983) Rotifers as indicators of water quality.Hydrobiologia,
100, 169 – 201.
Smith, D. (1982) The nitrogen and phosphorus dependence of algal
biomass in lakes: an empirical and theoretical analysis. Limnol.
Oceanogr.,27, 1101– 1112.
Stemberg, R. S. and Lazorchak, J. M. (1994) Zooplankton
assem-blages responses to disturbance gradients.Can. J. Fish. Aquat. Sci.,
51, 2435 – 2447.
Straile, D. and Geller, W. (1998) Crustacean zooplankton in Lake Constance from 1920 to 1995: response to eutrophication and
re-oligotrophication.Archiv. Hydrobiol.,53, 255 – 274.
Ter Braak, C. J. F. (1986) Canonical correspondence analysis: a new eigenvector technique for multivariate direct gradient analysis.
Ecology,67, 1167– 1179.
Ter Braak, C. J. F. and Prentice, I. C. (1988) A theory of gradient
analysis.Adv. Ecol. Res.,18, 271 – 313.
Ter Braak, C. J. F. and Smilauer, F. (1998) CANOCO reference manual and user’s guide to CANOCO for Windows: software for canonical community ordination (version 4). Microcomputer Power, Ithaca, New York.
Thornton, J. A. and Rast, W. (1993) A test of hypotheses relating to the comparative limnology and assessment of eutrophication in semi-arid man-made lakes. In Straskraba, Y., Tundisi, J. G. and
Duncan, A. (eds), Comparative Reservoir Limnology and Water Quality
Management. Kluwer Academic Publishers, London, pp. 1 – 24.
Thorp, J. H. and Mantovani, S. (2005) Zooplankton of turbid and
hydrologically dynamic prairie rivers.Fresh. Biol.,50, 1474– 1491.
Tundisi, J. G. and Matsumura-Tundisi, T. (1990) Limnology and eutrophication of Barra Bonita reservoir, S. Paulo State, Southern
Brazil.Arch. Hydrobiol.,33, 661 – 676.
at Universidade Federal de Ouro Preto on October 31, 2012
http://plankt.oxfordjournals.org/