Spectroscopic ellipsometry as a complementary tool for studying
luminescent polymers: Poly(
p
-phenylenevinylene) as a particular case
Rodrigo F. Bianchi
a, Débora Gonçalves
b,*aDepartmento de Física, Universidade Federal de Ouro Preto, Campus Morro do Cruzeiro s/n, 35400-000 Ouro Preto, MG, Brazil bInstituto de Física de São Carlos, Universidade de São Paulo, Av. Trabalhador São-Carlense 400, CP 369, 13560-970 São Carlos, SP, Brazil
h i g h l i g h t s
Novel approach for studying poly(p-phenylenevinylene) by ellipsometry. Comparative analyseseoptical properties of light-emitting polymers. Accurate optical parameters of light-emitting polymersePPV and derivatives. Properties of electroluminescentfilms discussed in terms of spectroscopic results.
a r t i c l e
i n f o
Article history:
Received 13 September 2012 Received in revised form 19 June 2013
Accepted 25 June 2013
Keywords: Polymers Thinfilms Luminescence Optical properties
a b s t r a c t
A novel approach for studying the thermal conversion of poly-p-xylylidene tetrahydrothiophenium chloride (PTHT) into poly(p-phenylenevinylene) (PPV)films has been proposed on the basis of calculated optical parameters. Spin-cast PTHTfilms were thermally converted into partially conjugated PPVfilms over conversion temperatures ranging from 22C to 200C. A strong correlation between refractive index (n) and damping constant extinction coefficient (k) was verified by spectroscopic ellipsometry (SE) for thefilms studied in the visible range of energy. The conversion temperature has a strong influence on the values ofnandk, which were theoretically modeled using a Lorentz harmonic oscillator analysis. The films were also studied by spectroscopic techniques (photoluminescence, FTIR, and UVeVIS), and it was verified that the values ofndecrease with increasing the amount of C]C groups present along the polymer chains, as a strong evidence that both structure and optical properties of thermally converted PPVfilms can be directly compared. The optical properties of the PPVfilms were also compared with those of two electroluminescent derivatives in which side chains are introduced into the phenyl ring of PPV, poly(2-methoxy-5-hexyloxy)-p-phenylenevinylene) (MH-PPV) and poly(3-methoxy-5-dodecyloxy-p-phenyleneevinylene) (MD-PPV).
Ó2013 Elsevier B.V. All rights reserved.
1. Introduction
Conjugated polymers have attracted a considerable interest over the last decade mainly because they become useful for application in high-contrast light-emitting devices and low-cost photovoltaic cells[1,2]. With continued innovation in novel structures aiming at devices based on the use of conjugated polymers, a considerable rise is likely to see in long-term performance of solution-processed polymers. In fact, correlations between structure and properties are of great importance for studies focusing scientific and technological developments of novel organic light-emitting displays. Among the
conjugated polymers most used for making electroluminescent devices, poly(p-phenylenevinylene) (PPV) and its derivatives show good durability and stability in air[1]. PPV emits an intense green-yellow light, that is interesting for application in devices, and also, exhibits reasonable mechanical properties; however, its solubility in common organic solvents is limited, making it difficult to pre-pare cast or coated thin PPVfilms. The preparation of PPVfilms has often been made using a water-soluble precursor polyelectrolyte. In this case, thefirst step of a so-called precursor route is the synthesis of a sulphonium salt intermediate, followed by its polymerization in strongly basic medium [3,4]. The most common precursor strategy yields a water-soluble polymer, poly-p-xylylidene tetra-hydrothiophenium chloride (PTHT), which can be easily coated on a suitable substrate; after a process of thermal conversion, uniform, flexible PPVfilms are obtained. The conversion of PTHT to PPV
*Corresponding author. Tel./fax:þ55 16 3373 9825. E-mail address:[email protected](D. Gonçalves).
Contents lists available atSciVerse ScienceDirect
Materials Chemistry and Physics
j o u r n a l h o m e p a g e : w w w . e l s e v i e r . c o m / l o c a t e / m a t c h e m p h y s
involves a thermally controlled elimination reaction of sulphonium groups of the precursor polymer in the solid state. Thin PPVfilms with partially or fully conjugated structures can be obtained, depending on the conditions chosen in the conversion process (temperature and time). When the PTHTfilm is heated at a tem-perature range from 140C to 220C under vacuum, a partially
conjugated structure is expected for PPV after a partial elimination reaction; for higher temperatures, such as at 300C, a fully
con-jugated structure[5,6]. Although these protocols may seem rela-tively well known, the use of a precursor polymer evokes problems with reproducibility of results once the optical properties of con-jugated PPVs, which have been obtained by thermal conversion, may vary drastically. As a consequence, attempts have been made in order to obtain PPV films with well-defined characteristics including structure, molecular weight, and optical properties[1].
In the present work we were interested in studying the thermal conversion of PTHT to PPV by using a powerful tool, spectroscopic ellipsometry (SE). By means of SE, accurate optical parameters for PPV were obtained when compared with values that have been obtained by using spectroscopic techniques and theoretical meth-odologies. Casting PPVfilms were characterized and compared to poly((2-methoxy-5-hexyloxy)-p-phenylenevinylene) (MH-PPV) and poly(3-methoxy-5-dodecyloxy-p-phenyleneevinylene) (MD-PPV)films.
2. Experimental section
Poly-p-xylylidene tetrahydrothiophenium chloride (PTHT) was chemically synthesized according to the precursor route[3]. After being freshly obtained by dialyses, PTHT was dissolved in water at 1.2 mg mL 1, and then, spin-coated on the substrate surface, either vacuum evaporated Au plates or transparent quartz glass plates, for ellipsometric and absorbance measurements, respectively. The deposition process yielded uniformfilms, with no visible surface defects. The conversion of PTHT to PPV was studied atfixed con-version temperatures which were kept constant for 2 h under vacuum in a homemade heater cavity coupled to a Hitachi U-2001 UVeVIS spectrophotometer. The Au plates were previously pre-pared by evaporatingca100 nm of Au layers on the top ofca60 nm of adhesive Cr layers deposited on microscope glass plates.
Poly(2-methoxy-5-hexyloxy)-p-phenylenevinylene) (MH-PPV) and poly(3-methoxy-5-dodecyloxy-p-phenyleneevinylene) (MD-PPV) were prepared according to modifications of a route for the synthesis of poly(2-methoxy-5-(2-ethyl-hexyloxy)-p -phenyl-enevinylene] (MEH-PPV); details on these procedures are given in our previous works [7,8]. MH-PPV and MD-PPVfilms were pre-pared by dissolving the polymers at 1.0 mg mL 1in chloroform, and then, spin coating these solutions on Au plates (2 2 cm2) at 3000 rpm for 90 s. In order to eliminate solvent residues, the spin-coatedfilms were dried in an oven at 50C for 30 min.
The optical properties of the films were obtained by photo-luminescence spectroscopy (PL) by using a 458 nm line of an Arþ
laser with an average excitation density ofca5 mW cm 2. A pho-tomultipler mounted on a 0.5 m monochromator and operating in the lock-in mode was used for detection. FTIR measurements were performed with a Nicolet Magna-IR 560 spectrometer in a trans-mission mode. A total of 128 scans was acquired at a spectral res-olution of 4 cm 1over a wavenumber range of 500e4000 cm 1. The films were deposited on silicon wafers, and a background spectrum was collected using a clean silicon surface.
Ellipsometric measurements were performed at different sam-ple positions in order to eliminate effects of photodegradation and/ or nonuniformity of thefilms. However, since no significant dif-ference among the experimental data was observed, it was assumed no contribution from photodegradation due to the Xe arc
lamp used in the ellipsometer. For obtaining the ellipsometric data, a homemade rotating analyzer ellipsometer (RAE) was used and described in details in the literature[9]. A typical RAE requires a source of unpolarized light (Xe arc lamp), a polarizer, an analyzer, and a photodetector. After reflection from the surface, light upon emerging from analyzer has a time varying intensity that can be detected.
Spectroscopic ellipsometry (SE) allows one to obtain the optical parameters of either absorbing or transparent layers after using suitable substrate/film/ambient optical models. A typical ellips-ometer measures the phase difference (D) of the two components of the electricfield of light, and the change in the ratio of their amplitudes as given by tan
J. For a bare re
flecting surface,D
andJ
are:D
¼d
rpd
rsand tanJ
¼rp
=jrsj, whererpandrsare the Fresnel coefficients for the components p and s of light [9]. The resulting change in polarization, after reflection from a sur-face, can be measured through a complex reflection coefficient,
r
¼ tanðJ
ÞeðiDÞ ¼rp=rs, which for a model substrate/film/ambient can be obtained as
r
¼f(N0,N1,N2,l,
L1,4), where
N0,N1 andN2are the indexes of refraction for ambient (0),film (1), and substrate (2), respectively[9]. Usually,N0,l
and4
(angle of inci-dence of light) are known, andN1,N2, andL1(thickness of thefilm) can be independently obtained. The complex refractive indexN represents the real and imaginary parts of the refractive index N¼nþik, wherenis the refractive index andkis the damping constant, which describe a change in the phase velocity and amplitude, respectively, of the electromagnetic wave propagating through a medium. For transparent materials, due to the high penetration depths of light,kvalues are very close to zero, and so thatNyn.3. Results and discussion
The conversion of PTHT to PPV was studied over a wide range of temperatures, allowing us to notice a change in coloration for the films from greenish yellow (PTHT) to yellow (PPV) and a gradual change in intensity for their absorbance bands (Fig. 1a). The UVeVIS spectra of thesefilms indicate that when the conjugation length of the polymer chains increases, the absorption edge red-shifts. In this case, a well-defined band at 450 nm can be seen in the spectra at higher conversion temperatures (see arrows inFig. 1a), suggesting that a partially converted structure for PPV is obtained at a con-version temperature of 200C.
The photoluminescence (PL) spectra of thesefilms exhibited well-defined bands (Fig. 1b), in particular at a higher conversion temperature, 200C. If one considers the temperature range chosen
here, up to reach 200C, it can be expected a partially conjugated
structure for the PPVfilm. The most relevant component of the PL emission of PPV appears at 525 nm, a band which becomes better defined in the spectra of thefilm converted at 200C. In the case of
using a conversion temperature higher than those used here, such as 300C, the PL bands for PPV become to decrease in intensity
because of a fully totally conjugated PPV structure is achieved un-der higher temperatures[6]. Here, we decided to study the con-version of PTHT to PPV at temperatures lower than 230C because
partially conjugated PPV (obtained at 200e230C) still contains sulfur in its structure, and exhibits favorableflexibility and con-ductivity[10].
(see arrows). The band at 964 cm 1, assignable to the out-of-plane bending of thetrans-vinylene CeH of PPV[11,12], can be considered as one of the most important bands in the spectrum of PPV. During the conversion process, the bands at 964 cm 1and 835 cm 1gain intensity (see arrows in Fig. 2a), and the latter band can be assignable to the out-of-plane bending of the phenylene CeH of PPV. The loss of the freeeOH groups in the PTHT structure becomes evident after increasing the temperature in Fig. 2b (band at 3394 cm 1); this band decreases in intensity for thefilms converted at higher temperatures, and it is not seen for thefilms converted at 200C and 230 C. In the absence of a band assignable to the
presence of C]O groups in the polymer structure, atca1690 cm 1, one infers that thefilms converted here at temperatures lower than 230 C show no significant conjugation defects. The band at
1513 cm 1, which can be assigned to a ring stretching vibration, remains practically unaltered, independently of the conversion temperature.
After characterizing thefilms by using common spectroscopic techniques (UVeVIS, PL, and FTIR), we have chosen SE for a detailed study of their optical characteristics. The optical constants,nandk, of thefilms converted at different temperatures were obtained by fitting the values of
D
andJ, and they are shown in
Fig. 3. For analyzing these results, the thickness (L) of a thick PPVfilm con-verted at 230C were initially obtained by profilometry giving avalue of (500 50) nm; taking into account that this value of thickness was sufficiently high, thisfilm was considered as infi -nitely thick. WithLalready known, the values of
D
andJ
were fitted for this thick PPVfilm, and a new database was created and saved by using an ambient/film/substrate optical model. The same procedure was used for analyzing the SE results for MH-PPV and MD-PPVfilms. This methodology is known as a multiple sample850 900 950
1420
3394 1513
964
2300C
900C
260C 900C
260C
1350C 260
C
1350C
900 C
2300C
260C
835
1300 1400 1500 1600 3200 3400 3600
1660 1617
Ab
so
rp
tio
n
(a
.u
.)
Wavenumber (cm-1)
Fig. 2.FTIR spectra for PPVfilms converted at different temperatures.
Fig. 3.Evolution ofnandkfor PPVfilms converted at different temperatures.
200 250 300 350 400 450 500 550 600
200 oC
140 oC
22 oC
80 oC
200 oC
80 oC
Absorbance (a.
u
.)
500 550 600 650 700
22 oC
Phot
ol
umi
nescence (a.
u
.)
Wavelength (nm) 140 oC
analysis, which has been frequently used for analyzing absorbing polymerfilms by SE[9].
The values ofnas a function of the wavelength are shown in
Fig. 3a for thefilms converted at different temperatures. The values ofnvary from 1.8 at 250 nm, which decreases in intensity with increasing the conversion temperature, to 2.0 for temperatures lower than 90 C, and 3.0 at even higher temperatures. The
maximum for k is also coincident with an isosbestic point at 400 nm, and increases abruptly its value at temperatures higher than 90 C (Fig. 3b). Therefore, these results indicate that the
conjugation along the polymer chain enhances effectively only when thefilm is converted at temperatures higher than 90C. This
conversion temperature alters the values ofnand implicates on higher values ofk, which are directly proportional to the absorption coefficient. As a consequence, it can be inferred that the conversion of PTHT to PPV can be efficiently conducted only at temperatures higher than 90C.
In order to compare the effect of temperature on the structural and optical properties of thefilms studied here, we show inFig. 4
how the values ofnat afixed value of wavelength, 290 nm, var-ies with the relative ratio of the C]C groups, area at 964 cm 1, taken from the FTIR spectra (Fig. 2). At 290 nm, the values ofnare at least three times larger than the values ofk, justifying this chosen wavelength. As a consequence, it can be clearly seen in thisfigure howndecreases with increasing the conversion temperature and with the relative ratio of the C]C groups of PPV, as a strong evi-dence that structure and optical properties of PPV can be directly compared. As it was previously shown inFig. 3, the optical prop-erties vary effectively only for thefilms converted at temperatures higher than 90C; more precisely at 135C, which indicates the
exact crossing point inFig. 4.
A parameter also analyzed here was the dielectric response function, ε (or pseudodielectric function, <ε>), which can be
related to the complex reflection coefficient,
r, by
ε orhεi ¼sin2
f
½1þtan2f
½ð1r
Þ=ð1þr
Þ2 where ε ¼ε1þiε2. Thereal (ε1) and imaginary (ε2) parts ofεcan be expressed asε1 ¼n2 k2andε
2 ¼2nk[9], and the values ofε1andε2for thefilms
con-verted at different temperatures are shown inFig. 5. Theε1curves
display a similar feature, showing relatively low values of ε1 at
higher energies at 90 C, 135 C, 200 C, and even at a higher
0
50
100
150
200
250
1.1
1.2
1.3
1.4
1.5
1.6
0.0
0.2
0.4
0.6
0.8
1.0
1.2
Temperature of conversion/
oC
n
(at 290 nm)
Relative a
rea at 964 cm
-1 (a.u.)
Fig. 4.Values ofnat an incident photon energy of 290 nm (4.9 eV) (wherekis much lower thann), and relative area obtained from the FTIR spectra at 964 cm1for PPV
films converted at different temperatures.
temperature, 230C, and practically constant values for energies
higher than 3.2 eV. Theε2curves show a maximum value at 2.8 eV,
in particular for thefilms converted at 200C and 230C.
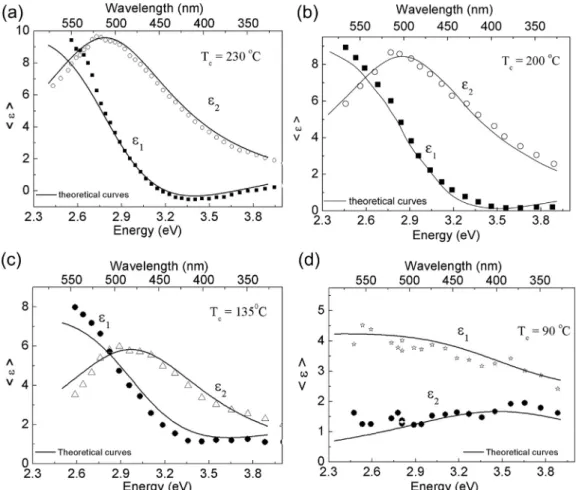
Theε1andε2data taken fromFig. 5were theoretically modeled
using a Lorentz harmonic oscillator, which describes a molecular electronic cloud vibrating around afixed nucleus expressed by an analytical formula:hεi ¼ε
NþA2=½E20 EðEþi
n
Þ[13e15]. In thismodel,Eis the incident beam energy,Ais the oscillation ampli-tude,E0is the resonance energy,ε
Nis the permittivity outside the region of resonance, and
n
is the damping coefficient [15]. The Lorentz oscillator model has been used in order to adjust experi-mental results obtained by SE for polymers such as poly(3-hexilthiophenes) [15] and poly(2-methoxy-5-hexyloxy)-p -phe-nylenevinylene[16].A single harmonic oscillator function gave a reasonablefit for the<ε>curves (shown as full lines inFig. 5), in particular for the
films converted at higher temperatures (200C and 230C). Except
for a deviation at low energies (long wavelengths), which can be related to effects of signal-to-noise ratio on the quality of the curves, we obtained a very good agreement between experiment and the Lorentz harmonic oscillator model for polymerfilms with very strong absorption in the visible range of energy. The param-eters
n,
E0,AandεNwere obtained from thesefittings, and shown in Fig. 6, where one notes thatE0(resonance energy) and
n
(damping coefficient) decrease with increasing the conversion temperature, withA(oscillator amplitude) andεN(permittivity) behaving in an opposite way. These results are comparable to those fromFig. 1a, with the maximum absorption intensity increasing with the con-version temperature. After taking a look on the parameter
n, which
reflects a dissipative frictional effect arising from interactions be-tween free polymer chains, its lower values at higher conversion temperatures indicate smaller chain interactions, and conse-quently, a larger number of C]C bonds for a conjugated PPV structure converted at temperatures higher than 135C; for theparameterE0it can be expected a similar behavior. For theε NandA parameters, it is evident that the conversion reaction of PTHT to PPV is, in fact, complete at a conversion temperature of 200C,
when it can be expected that a partially conjugated PPV structure be formed.
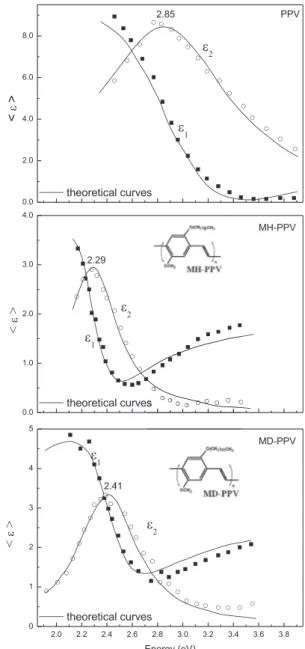
The dielectric function (<ε>) for PPV were compared to those
obtained for two soluble derivatives, MH-PPV (soluble in chloro-form) and MD-PPV (soluble in several organic solvents). These derivatives, MH-PPV and MD-PPV, are also interesting for further SE studies since they can be easily prepared at room temperature by using common organic solvents.
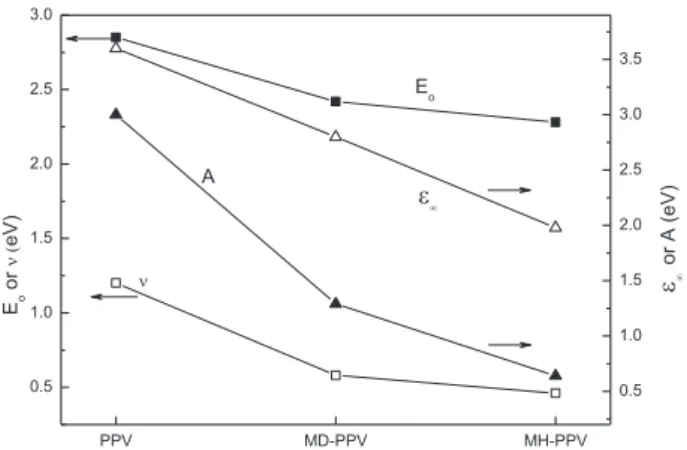
InFig. 7we compare the absorption and PL spectra of PPV, MH-PPV, and MD-PPV. Also, for comparison purposes,Fig. 8shows the
<ε>curves for these polymers with the parameters
n,
E0,A, andε N being presented in Fig. 9. Comparatively, the presence of alkoxy80 100 120 140 160 180 200 220 240 1.0
1.5 2.0 3.0 3.5
Eo
or
(eV
)
Eo
Conversion temperature (oC)
PPV film
1.8 2.1 2.4 2.7 3.0 3.3 3.6
or A (eV)
A
ν
ν
ε
∞
Fig. 6.ParametersA,E0,ε
Nandnobtained for PPV assuming a Lorentz harmonic
oscillator model.
300 400 500 600 700
Phot
oluminescence (a.
u
.)
MD-PPV
MH-PPV
PPV
Absorbance (a.
u
.)
Wavelength (nm)
Fig. 7.UVeVIS absorption and photoluminescence spectra for PPV (converted at 200C), MH-PPV and MD-PPV.
groups introduced into the derivative structure seems to have a decisive influence on the absorption and PL spectra of thesefilms, since greater is the number of carbon atoms (12 for MD-PPV, and 6 for MH-PPV), smaller is the value of E0 (resonance energy). In addition, bulky pendant groups yield polymers with lower values of absorption,
n,
E0,A, andεNas shown inFigs. 7e9.
The values ofE0was obtained from the UVeVIS curves at the maximum values of energy; by comparing results obtained for PPV, MH-PPV, and MD-PPV, one infers that these values are very close to those obtained for EABS (Fig. 1a), which undergoes a red shift for MH-PPV, and MD-PPV, thus independently of the size of the pendant group. The values ofε
N, on the other hand, showed to be very close to the values ofε2obtained at higher energies. The higher
solubility of MH-PPV, and MD-PPV is a consequence of bulky, polar pendant groups which gives more space to the polymer chains, minimizing chain-to-chain interactions, in other words, decreasing the parameter
n, as it can be clearly seen in
Fig. 9.The optical parameters of PPV have been calculated more often by using UV photoelectron spectroscopy (UPS)[17], UVeVIS spec-troscopy [18,19], and cyclic voltammetry [19] aiming at deter-mining its energy levels, optical bandgap, and electrochemical energy gap. Different approaches have been used for determining the energy gap of PPV, which was assumed to be 2.8 eV[20], a value higher than that obtained from theoretical modeling[21], and also, electrochemical and optical measurements[19], i.e. 2.4 eV. Here, we obtained more precise values for the optical parameters of PPV and its derivatives, extending the possibilities of using SE as a technique for characterizing novel electroluminescent polymer films, after creating a database of optical constants for thicker absorbingfilms.
4. Conclusions
A substrate/film/ambient optical model was chosen here in or-der to represent thermal converted PPV films deposited on Au
substrates, with the Lorentz harmonic oscillator model offering a reasonablefit to the experimental data obtained by SE. Comple-mentary spectroscopic techniques (FTIR, UVeVIS, and photo-luminescence) were used in order to compare structure and optical properties of thefilms. A comparative study of the optical proper-ties of PPV and its derivatives was carried out, and it was mainly related to structural modifications of the polymers. Ellipsometry have yielded the evolution ofnandkas the conversion temperature changed for a substrate/film/ambient optical model. The values ofk increased with the conversion temperature, and a higher absorp-tion coefficient was noticed for PPV films converted at tempera-tures higher than 90C. A partially conjugated structure for PPV
was obtained at conversion temperatures higher than 200 C.
Concomitantly, the values ofndecreased with increasing the con-version temperature and with the relative ratio of C]C groups in the polymer structure. Precise values of the optical parameters of PPV and its derivatives, MD-PPV and MH-PPV, were obtained by using SE.
Acknowledgments
The authors wish to thank Prof. Eugene A. Irene and Prof. Rob-erto M. Faria for their valuable contributions to this work. The research was supported by these Brazilian agencies and programs: CNPq, PDE-CNPq (200682/2011-3), Rede Nanobiomed/CAPES, Fapitec-SE/CNPq-NExSEN Fapitec-SE/CNPq, Fapemig (PPM-00596-11, PPM-00306-09 and APQ-04124-10), INEO/CNPq, and FAPESP.
References
[1] L. Akcelrud, Prog. Polym. Sci. 28 (2003) 875e962.
[2] A. Facchetti, Chem. Mater. 23 (2011) 733e758.
[3] J.B. Schlenoff, L.J. Wang, Macromolecules 24 (1991) 6653e6659.
[4] V. Massardier, A. Guyot, V.H. Tran, Polymer 35 (7) (1994) 1561e1563.
[5] D.A. Halliday, P.L. Burn, R.H. Friend, D.D.C. Bradley, A.B. Holmes, Synth. Met.
55e57 (1993) 902e907.
[6] C. Zhang, D. Braun, A.J. Heeger, J. Appl. Phys. 73 (10) (1993) 5177e5180.
[7] C.A. Olivati, R.M. Faria, R.F. Bianchi, R.K. Onmori, A.M. de Andrade, Synth. Met.
121 (1e3) (2001) 1579e1580.
[8] R.F. Bianchi, D.T. Balogh, D. Gonçalves, R.M. Faria, E.A. Irene, Mol. Cryst. Liq.
Cryst. 374 (2002) 457e462.
[9] D. Gonçalves, E.A. Irene, Quim. Nova 25 (5) (2002) 794e800.
[10] I. Murase, T. Ohnishi, T. Noguchi, M. Hirooka, S. Murakami, Mol. Cryst. Liq.
Cryst. 118 (1985) 333e336.
[11] S. Son, A. Dodabalapar, A.J. Lovinger, M.E. Galvin, Science 269 (1995) 376e378.
[12] H. Goto, T. Miyazawa, K. Tomishige, K. Kunimori, R.H.L. Kiebooms, Y. Akiyama,
K. Akagi, J. Appl. Polymer Sci. 107 (1) (2008) 438e443.
[13] M. Losurdo, G. Bruno, E.A. Irene, J. Appl. Phys. 94 (8) (2003) 4923e4929.
[14] A. Djurisic, E.H. Li, Appl. Optics 37 (2) (1998) 5291e5296.
[15] H. Arwin, R. Jansson, Electrochem. Acta 39 (2) (1994) 211e215.
[16] R.F. Bianchi, D.T. Balogh, M. Tinami, R.M. Faria, E.A. Irene, J. Polym. Sci. B:
Polym. Phys. 42 (2004) 1033e1041.
[17] K. Seki, S. Asada, T. Mori, H. Inokuchi, I. Murase, T. Ohnishi, T. Noguchi, Solid
State Commun. 74 (7) (1990) 677e680.
[18] K. Yoshino, T. Takiguchi, S. Hayashi, D.H. Park, R. Sugimoto, Jpn. J. Appl. Phys.
25 (1986) 881e884.
[19] H. Eckhardt, L.W. Shacklette, K.Y. Jen, R.L. Elsenbaumer, J. Chem. Phys. 91
(1989) 1303e1311.
[20] P.G. da Costa, E.M. Conwell, Phys. Rev. B 48 (3) (1993) 1995e1996.
[21] R. Giro, M.J. Caldas, D.S. Galvão, Int. J. Quantum Chem. 105 (2005) 588e596.
Fig. 9. ParametersA,E0,ε
Nandnobtained for PPV (converted at 200C), MH-PPV and