AR
TIGO
AR
TICLE
1 Departamento de Nutrição e Saúde, Universidade Federal de Viçosa. Av. PH Rolfs s/n, Campus Universitário. 36570-000 Viçosa MG Brasil. [email protected]
Impact of rice fortified with iron, zinc, thiamine
and folic acid on laboratory measurements
of nutritional status of preschool children
Impacto do arroz fortificado com ferro, zinco, tiamina
e ácido fólico sobre as medidas laboratoriais
do estado nutricional de crianças pré-escolares
Resumo A fortificação de alimentos constitui im-portante estratégia para o controle da deficiência de micronutrientes e apresenta como vantagens a alta cobertura populacional e o fato de não alterar hábitos alimentares. O presente estudo teve como objetivo avaliar o impacto do uso de arroz
fortifi-cado (Ultra Rice® - UR®) sobre o estado nutricional
de pré-escolares. Noventa e nove crianças matri-culadas em duas creches filantrópicas participa-ram do estudo. Para crianças de uma creche foi
oferecido UR® misturado com arroz polido, como
parte das refeições escolares (grupo teste) e para as da outra foi oferecido somente arroz polido (grupo controle). Avaliações bioquímicas foram realiza-das antes e após 4 meses de intervenção.
Avalia-ções dietética e sensorial do UR® misturado com
arroz polido foram realizadas durante o estudo. O arroz fortificado melhorou as concentrações de zinco (p < 0,001), tiamina (p < 0 ,001), ácido fóli-co (p = 0,003), hemoglobina fóli-corpuscular média (p < 0,001) e hemoglobina corpuscular média (p < 0,001). O arroz fortificado mostrou boa aceitação entre os pré-escolares. Este estudo demonstrou a eficácia do uso de arroz fortificado com ferro, zin-co, tiamina e ácido fólico sobre o estado
nutricio-nal das crianças.
Palavras-chave Avaliação bioquímica, Ingestão alimentar, Anemia, História alimentar, Ultra rice Abstract Fortification of food constitutes an
im-portant strategy for the control of micronutrient deficiency and has advantages such as high popu-lation coverage and maintenance of eating habits. This study aimed to assess the impact of using
for-tified rice (Ultra Rice® - UR®) on the nutritional
status of preschoolers. Ninety-nine children en-rolled in two philanthropic preschools participa-ted of the study. Children of one of the preschools
were offered UR® mixed with polished rice, as part
of school meals (test group) and the children of another preschool were offered pure polished rice (control group). Biochemical evaluations were performed before and after 4 months of interven-tion. Dietary assessment and sensory evaluation
of UR® mixed with polished rice were performed
during the study. The fortified rice improved the concentrations of zinc (p < 0.001), thiamine (p < 0.001), folic acid (p = 0.003), mean corpuscular hemoglobin (p < 0.001) and mean corpuscular he-moglobin concentration (p < 0.001). The fortified rice showed good acceptability among preschoo-lers. This study demonstrated the effectiveness of using rice fortified with iron, zinc, thiamine and
folic acid on the nutritional status of children.
Key words Biochemical assessment, Dietary in-take, Anemia, Food history, Ultra rice
D
el
la L
ucia CM
Background
Disturbances in nutritional status, particularly those related to micronutrient deficiency, may be caused by multiple factors1. These deficiencies
are risk factors for health and survival of vulner-able groups, such as preschool children2,3.
Miner-als and vitamins deficiency may Miner-also be present in overweight individuals, interfering in the entire development process, with physical, social and economic consequences4.
Micronutrient deficiencies may occur simul-taneously5 and have serious consequences on
children’s health. Nutritional status influences learning ability and performance of children in school, since a qualitatively and quantitatively adequate diet is essential for the maturation of neurological structures that favor the learning process. Because children in developing coun-tries generally reach school age with problems of chronic malnutrition, the school should guide to increase micronutrients intake, reducing their deficiency6.
Therefore, it is necessary to use strategies to prevent nutritional disorders, such as food for-tification, which is the first alternative interven-tion recommended for localities of greatest prev-alence7.
Rice is a staple food and fortification vehicle in countries where people suffer from micronu-trient deficiencies because it is one of the most popular cereals around the world8. Therefore,
rice fortified with micronutrient based on the Ultra Rice® technology (UR®) may prevent
nutri-tional deficiencies in many age groups, because its grains can be fortified with one or more nutri-ents and used by specific populations according to their most urgent needs7. Thus, this study
eval-uated the effect of UR® fortified with iron, zinc,
thiamine and folic acid on the nutritional status of preschool children.
Subjects and Methods
Test Food
Rice grains extruded from rice flour (Ultra Rice®(UR®)), produced and provided by a pasta
manufacturer after authorization by the Program for Appropriate Technology in Health (PATH), were used. The grains contained iron (in the form of micronized ferric pyrophosphate), zinc (in the form of zinc oxide), thiamine (in the form of thi-amine mononitrate) and folic acid. The grains
were mixed with polished rice, at a proportion of 1:100 and served at lunch.
Dosage of the micronutrients in UR® took
into account factors such as losses in process-ing, transport, storage and cookprocess-ing, as well as bioavailability of the compounds used in forti-fication. These losses are considered in the for-mulation, so that the target levels are reached in cooked rice. The children received, in means, 50 g portion of this preparation that contains 0.5 g of UR® and meets, after cooking, approximately one
third (33.33%) of the Recommended Dietary Al-lowances (RDA) of these micronutrients for this population group9. In this case, 0.5 g of raw UR®
contain 4.2 mg of iron, 2.1 mg of zinc, 0.36 mg of thiamine (vitamin B1) and 72 mg of folic acid.
Sample
The sample size was calculated according to Mera et al.10, considering ferritin as the main
variable11. A statistical power of 80%, a
signifi-cance level of 5% and an expected difference of 17% in the baseline values were adopted, totaling a sample of 45 individuals in each experimental group.
The study was conducted in two philan-thropic preschools in Brazil. One hundred and forty-three children between 2 and 6 years old, of both genders, were considered eligible to participate in the study. Children whose hemo-globin (Hb) levels were equal to or greater than 11.0 g/dL were included in the study. Children diagnosed with iron deficiency anemia, who re-ceived ferrous sulfate supplementation or other nutritional supplements after evaluation by a qualified doctor of the city Health Department, were excluded from the study for ethical reasons since the fortified rice is a food testing. A total of 131 children were selected, of which blood was taken from 112 after obtaining parental consent. Of those, 13 did not return for the dietary assess-ment, yielding a total of 99 children who partic-ipated in all sessions of the study (Figure 1). The preschools were randomly selected as “control” or “test”.
Experimental design
This is a four months intervention study, in which children of the selected preschools re-ceived, as part of school meals, polished rice (control group) or UR® mixed with polished rice
sub-aúd
e C
ole
tiv
a,
22(2):583-592,
2017
mitted to laboratory tests before and after the intervention period (Figure 2). Laboratory tests
were conducted at Laboratory of Clinical Anal-yses, Division of Health of the Federal Universi-ty of Viçosa (UFV). Before initiating the study, children were dewormed with Albendazole (oral suspension, 40 mg), as medically indicated.
Laboratory tests
Laboratory tests were conducted at the be-ginning and end of the intervention period. Samples containing approximately 12 mL of blood were collected in syringes by venipuncture. About 4 mL of the sample were transferred to a tube containing anticoagulant ethylene diamine tetraacetic (EDTA) to perform full blood count and erythrocyte thiamine; 4 mL were transferred to a serum-gel tube for analysis of serum folate and ferritin ultrasensitive CRP, and the remain-ing blood (4 mL) was transferred to a draw tube for determination of serum zinc.
Analysis of folic acid and ferritin were per-formed by chemiluminescence method and serum zinc by atomic absorption spectrophotometry. Erythrocyte thiamin (thiamine diphosphate) was analyzed by High Performance Liquid Chroma-tography (HPLC) according to Mancinelli et al.12.
Mean corpuscular volume (MCV), mean corpuscular hemoglobin (MCH) and mean cor-puscular hemoglobin concentration (MCHC) were calculated as the ratio between hemoglobin and red blood cells.
Figure 1. Scheme of sample selection of children enrolled in two philanthropic preschools.
143 children enrolled in the two philanthropic preschool (66 in test preschool and 77 in control preschool)
112 children underwent biochemical assessment
13 did not attend the dietetic and anthropometric assessment
12 non-eligible (10 presented anemia and 2 used nutritional suplement)
99 children completed all stages of the study (49 in test preschool and 50
in control preschool) 131 eligibile
19 did not show parental permission to participate
Figure 2. Experimental design of the intervention study with preschool children. Baseline
Baseline Treatment: Polished rice Treatment: Ultra Rice®
mixed with polished rice
Biochemical assessment
Dietetic assessment
Biochemical assessment
Biochemical assessment
Dietetic assessment
Biochemical assessment
Control preschool Test preschool
Intervention period
D
el
la L
ucia CM
Dietary assessment
Meals offered at preschools were directly weighed (weighing the ingested food = weigh of food provided – food actually consumed) and the food intake analysis was complemented with a 24 h recall. This analysis happened at the mid-dle of the time of the study. For standardization of data one interviewer were trained, and a stan-dard form was used for application of the food record method.
The average of three samples of the served UR® was obtained to increase precision. Food
was weighed on a calibrated digital scale with a capacity of 5 kg and precision of 1 g. Solid foods were weighed on a pre-weighed plate and liq-uid foods (soups, juices) were weighed in plastic cups. The preparation method was recorded and the ingredients weighed for all foods served to the children.
To control the intrapersonal variability of di-etary intake of children in school, a second intake assessment was performed by randomly reweigh-ing 25% of the children evaluated. This was per-formed at an interval of at least one day between collections, repeating the collection procedure of the first assessment. Contents of iron, zinc, vita-mins B1, C and folic acid were calculated using Avanutri software, version 2.0.
Evaluation of UR® acceptance
by preschool children
To evaluate the acceptance of UR® by
pre-school children the “Rest-Ingestion” test was applied13. Acceptability of the foods and the
re-spective preparations were also evaluated by the Acceptability Index (AI), which relates the amount of the meal consumed with the amount of the meal distributed according to the follow-ing equation:
AI = (2)
Where:
Surplus: Quantity of the preparation not dis-tributed to the children;
Leftovers: Quantity of the preparation dis-tributed to the children that was not ingested, leftover on the plate.
The rice was prepared following the menu used in the preschool. Rice was weighed, placed on individual plates and offered to the children. After ingestion, the containers were collected and the leftovers gathered and weighed. The surplus was also weighted.
Statistical analyses
The database was developed with the help of the Excel (Microsoft Excel 2007) software. Statis-tical tests were performed using the program Sig-maPlot - Scientific Data Analysis and Graphing Software, version 11.0.
The Kolmogorov-Smirnov test was used to assess the normality of the data. To evaluate po-tential differences between the medians of the variables in the two groups, the Mann-Whitney test was used, adopting a 5% significance level (p < 0.05). To analyze the effect of intervention with UR®, and biochemical data collected at the
beginning and end of the intervention was com-pared using the Wilcoxon test when there was no normal distribution of data, and by the paired t-test when the distribution was normal, using a significance level of 5 % (p < 0.05).
Ethical Aspects
The protocol of this study was approved by the Ethics Committee on Research with Hu-man Beings of the Federal University of Viçosa (UFV). Those responsible for the children were informed about the study and the confidentiality of the information, and signed the Statement of Informed Consent, authorizing participation of the child.
Clarifications were made in accessible lan-guage and free consent to participate in the re-search was guaranteed to all individuals, as rec-ommended by the Guidelines and Rules of Re-search Involving Human Subjects of the National Health Council14.
Parents or guardians received a summary of the laboratory tests of the child. For children presenting malnutrition, Nutrition counseling was provided to the children and their parents. At the end of the study, parents received nutri-tional guidance with respect to feeding of their children, in the form of seminars, with utilization of posters and brochures. After completion of the study, children enrolled in the control group also received the fortified rice, as part of school meals, during the same period in which it was received by children of the test group.
total weight of the preparation – (surplus + leftovers)
aúd
e C
ole
tiv
a,
22(2):583-592,
2017
Results
Characterization of the sample
More than half of the participants (53.5%, n = 53) were female, 47.5% (n = 47) of them were 2-3 years old and 52.5% (n = 52) were 4-6 years old (median age was 4 in the test preschool and 3 in the control preschool).
Laboratory tests
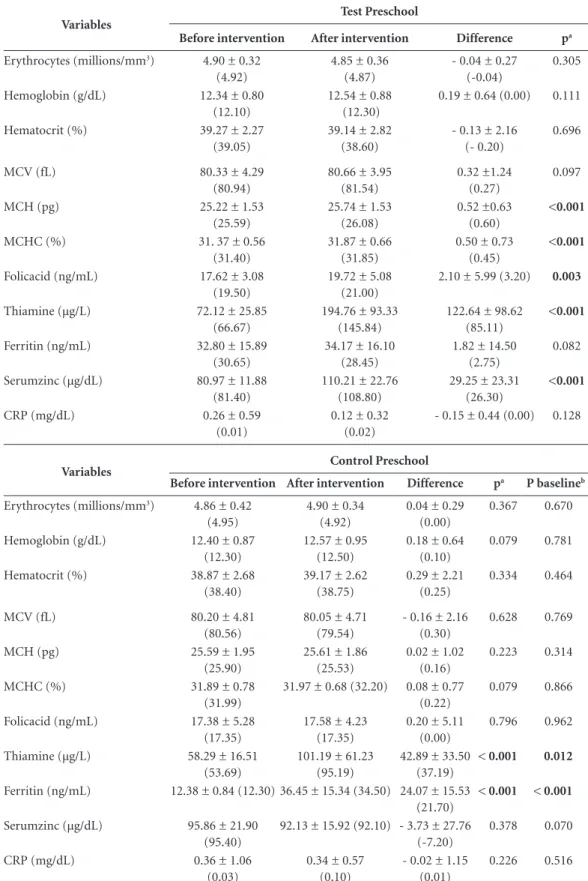
At baseline, children in both groups were homogeneous in relation to concentrations of erythrocytes, hemoglobin, hematocrit, mean corpuscular volume (MCV), mean corpuscular hemoglobin (MCH), mean corpuscular hemo-globin concentration (MCHC), folic acid, thia-mine, serum zinc and C-reactive protein (CRP) (p > 0.05).
At the end, the values of MCH (p < 0.001), MCHC (p < 0.001), folate (p < 0.003) and se-rum zinc (p < 0.001) increased when compared to the beginning of the study in the test group (Table 1). In both groups erythrocyte thiamine concentration increased at the end of the study (p < 0.001). Serum ferritin concentration was higher at the end of the study in control group (p < 0.001). At the beginning of the study, children in the test group showed higher concentrations of erythrocyte thiamin (p = 0.012) and ferritin (p < 0.001) (Table 1).
Dietary assessment
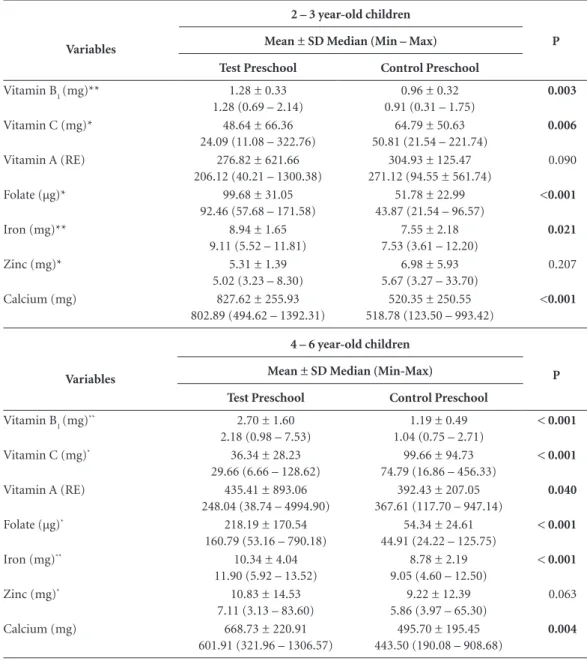
Vitamin B1, folate, calcium and iron intakes was higher in the test preschool when compared to the control preschool, which presented high-er vitamin C intake in both age groups studied (Table 2).
Evaluation of the acceptance of UR®
by preschool children
The acceptance index (AI) was high (98%). Acceptance values greater than 85% indicate that preparations or foods may successfully be pro-vided on a continuous basis13.
Discussion
The UR® improved the nutritional status of
pre-school children in relation to the concentrations of zinc, thiamin, folic acid, MCH and MCHC.
Test group showed higher intake of vitamin B1, folate, calcium and iron when compared to the control group, which presented higher vitamin C intake in both age groups. Greater intake of vita-min B1, iron and folate in the test group may be attributed to the fortified rice (UR®)
consump-tion, since this product is enriched with these micronutrients. Although the UR® is also
forti-fied with zinc, there was no difference regarding mean intake of this mineral between the test and control groups, due to greater consumption of foods considered sources of zinc by children of the control group. It is important to note that only the intake of fortified rice was monitored, and the school menus and home meals were not controlled during the intervention period.
Erythrocytes, hemoglobin and hematocrit were similar in both groups between the begin-ning and end of the intervention period. This can be explained by children adequate nutrition-al iron status, i.e., they did not present anemia at the beginning of the experiment. When iron levels absorbed by the diet are adequate, the in-testinal mucosa regulates its absorption to main-tain a constant amount of iron in the body, which would explain the similarity in values of the vari-ables described previously15. However, values of
MCH and MCHC increased after consumption of fortified rice by children of the test group, in-dicating a possible reduction of hypochromic red blood cells, and therefore any effect of fortified rice on the nutrition state of iron among these children.
At the beginning of the study, thiamine con-centrations of the control group were lower than those of the test group. Thus, even without the use of fortified rice in school meals of the con-trol preschool, improved nutritional status of this nutrient was observed possibly due to its in-creased uptake at the intestinal level.
These findings corroborate with the results observed in the dietary assessment, since the children of the test group showed greater intakes of vitamin B1, folate and iron. Although children of the test group presented improved nutritional status of zinc at the end of the intervention peri-od, the intake of this mineral did not appear dif-ferent between the evaluated preschools.
Al-D
el
la L
ucia CM
Table 1. Biochemical variables of preschool children in the test and control groups, before and after the intervention.
Variables
Test Preschool
Before intervention After intervention Difference pa
Erythrocytes (millions/mm3) 4.90 ± 0.32 (4.92)
4.85 ± 0.36 (4.87)
- 0.04 ± 0.27 (-0.04)
0.305
Hemoglobin (g/dL) 12.34 ± 0.80
(12.10)
12.54 ± 0.88 (12.30)
0.19 ± 0.64 (0.00) 0.111
Hematocrit (%) 39.27 ± 2.27
(39.05)
39.14 ± 2.82 (38.60)
- 0.13 ± 2.16 (- 0.20)
0.696
MCV (fL) 80.33 ± 4.29
(80.94)
80.66 ± 3.95 (81.54)
0.32 ±1.24 (0.27)
0.097
MCH (pg) 25.22 ± 1.53
(25.59)
25.74 ± 1.53 (26.08)
0.52 ±0.63 (0.60)
<0.001
MCHC (%) 31. 37 ± 0.56
(31.40)
31.87 ± 0.66 (31.85)
0.50 ± 0.73 (0.45)
<0.001
Folicacid (ng/mL) 17.62 ± 3.08
(19.50)
19.72 ± 5.08 (21.00)
2.10 ± 5.99 (3.20) 0.003
Thiamine (µg/L) 72.12 ± 25.85
(66.67)
194.76 ± 93.33 (145.84)
122.64 ± 98.62 (85.11)
<0.001
Ferritin (ng/mL) 32.80 ± 15.89
(30.65)
34.17 ± 16.10 (28.45)
1.82 ± 14.50 (2.75)
0.082
Serumzinc (µg/dL) 80.97 ± 11.88
(81.40)
110.21 ± 22.76 (108.80)
29.25 ± 23.31 (26.30)
<0.001
CRP (mg/dL) 0.26 ± 0.59
(0.01)
0.12 ± 0.32 (0.02)
- 0.15 ± 0.44 (0.00) 0.128
Variables Control Preschool
Before intervention After intervention Difference pa P baselineb
Erythrocytes (millions/mm3) 4.86 ± 0.42 (4.95)
4.90 ± 0.34 (4.92)
0.04 ± 0.29 (0.00)
0.367 0.670
Hemoglobin (g/dL) 12.40 ± 0.87
(12.30)
12.57 ± 0.95 (12.50)
0.18 ± 0.64 (0.10)
0.079 0.781
Hematocrit (%) 38.87 ± 2.68
(38.40)
39.17 ± 2.62 (38.75)
0.29 ± 2.21 (0.25)
0.334 0.464
MCV (fL) 80.20 ± 4.81
(80.56)
80.05 ± 4.71 (79.54)
- 0.16 ± 2.16 (0.30)
0.628 0.769
MCH (pg) 25.59 ± 1.95
(25.90)
25.61 ± 1.86 (25.53)
0.02 ± 1.02 (0.16)
0.223 0.314
MCHC (%) 31.89 ± 0.78
(31.99)
31.97 ± 0.68 (32.20) 0.08 ± 0.77 (0.22)
0.079 0.866
Folicacid (ng/mL) 17.38 ± 5.28
(17.35)
17.58 ± 4.23 (17.35)
0.20 ± 5.11 (0.00)
0.796 0.962
Thiamine (µg/L) 58.29 ± 16.51
(53.69)
101.19 ± 61.23 (95.19)
42.89 ± 33.50 (37.19)
< 0.001 0.012
Ferritin (ng/mL) 12.38 ± 0.84 (12.30) 36.45 ± 15.34 (34.50) 24.07 ± 15.53 (21.70)
< 0.001 < 0.001
Serumzinc (µg/dL) 95.86 ± 21.90
(95.40)
92.13 ± 15.92 (92.10) - 3.73 ± 27.76 (-7.20)
0.378 0.070
CRP (mg/dL) 0.36 ± 1.06
(0.03)
0.34 ± 0.57 (0.10)
- 0.02 ± 1.15 (0.01)
0.226 0.516
aúd
e C
ole
tiv
a,
22(2):583-592,
2017
though calcium has a negative influence on iron bioavailability, the mechanism by which dietary calcium reduces iron absorption is still poorly understood. There is some competitive inhibi-tion between calcium and iron in the final trans-port of intestinal mucosa to the plasma, which occurs for heme and non-heme iron16.
Vitamin A intake was higher among children between 4-6 years old in the test group, which
may be another possible explanation for the high-er iron stocks in these children at the end of the study. Vitamin A has an effect on iron metabo-lism; however, this mechanism is not completely understood. It is possible that this vitamin inter-feres with the mobilization of available iron stocks and the use of iron to form hemoglobin17, i.e., the
concentrations of ferritin may be reduced in chil-dren with greater consumption of vitamin A.
Table 2. Nutrients intakes of the preschool children (n = 99).
Variables
2 – 3 year-old children
P Mean ± SD Median (Min – Max)
Test Preschool Control Preschool
Vitamin B1(mg)** 1.28 ± 0.33
1.28 (0.69 – 2.14)
0.96 ± 0.32 0.91 (0.31 – 1.75)
0.003
Vitamin C (mg)* 48.64 ± 66.36
24.09 (11.08 – 322.76)
64.79 ± 50.63 50.81 (21.54 – 221.74)
0.006
Vitamin A (RE) 276.82 ± 621.66
206.12 (40.21 – 1300.38)
304.93 ± 125.47 271.12 (94.55 ± 561.74)
0.090
Folate (µg)* 99.68 ± 31.05
92.46 (57.68 – 171.58)
51.78 ± 22.99 43.87 (21.54 – 96.57)
<0.001
Iron (mg)** 8.94 ± 1.65
9.11 (5.52 – 11.81)
7.55 ± 2.18 7.53 (3.61 – 12.20)
0.021
Zinc (mg)* 5.31 ± 1.39
5.02 (3.23 – 8.30)
6.98 ± 5.93 5.67 (3.27 – 33.70)
0.207
Calcium (mg) 827.62 ± 255.93
802.89 (494.62 – 1392.31)
520.35 ± 250.55 518.78 (123.50 – 993.42)
<0.001
Variables
4 – 6 year-old children
P Mean ± SD Median (Min-Max)
Test Preschool Control Preschool
Vitamin B1(mg)
** 2.70 ± 1.60
2.18 (0.98 – 7.53)
1.19 ± 0.49 1.04 (0.75 – 2.71)
< 0.001
Vitamin C (mg)* 36.34 ± 28.23
29.66 (6.66 – 128.62)
99.66 ± 94.73 74.79 (16.86 – 456.33)
< 0.001
Vitamin A (RE) 435.41 ± 893.06
248.04 (38.74 – 4994.90)
392.43 ± 207.05 367.61 (117.70 – 947.14)
0.040
Folate (µg)* 218.19 ± 170.54
160.79 (53.16 – 790.18)
54.34 ± 24.61 44.91 (24.22 – 125.75)
< 0.001
Iron (mg)** 10.34 ± 4.04
11.90 (5.92 – 13.52)
8.78 ± 2.19 9.05 (4.60 – 12.50)
< 0.001
Zinc (mg)* 10.83 ± 14.53
7.11 (3.13 – 83.60)
9.22 ± 12.39 5.86 (3.97 – 65.30)
0.063
Calcium (mg) 668.73 ± 220.91
601.91 (321.96 – 1306.57)
495.70 ± 195.45 443.50 (190.08 – 908.68)
0.004
D
el
la L
ucia CM
Consumption of vitamin C, which was high-er in children of the control group, is also a fac-tor that may explain the higher ferritin concen-trations in these children. When this vitamin is present in adequate amounts, its rapid effect on iron absorption percentage is noted18.
Serum ferritin concentrations were higher before intervention among children in the test group, which may also explain the more evident increase in relation to this variable in children of the control group, whose ferritin levels were lower.
This is the first study to assess the effective-ness of UR® on biochemical variables in
non-ane-mic children. Although all children were within the limits of normality for all variables analyzed, there was improvement in the nutritional status relative to the micronutrients in the fortified rice.
Studies evaluated the effect of using UR® on
the nutritional status of iron in different popula-tion groups. In a study, UR® and a placebo
solu-tion were administered to a group of children with mild anemia (n = 175) (test group: UR®).
After 5 months, the serum ferritin and hemo-globin concentrations increased in both groups, although change in the test group was higher (p < 0.05)19. These children had mild anemia, unlike
the present study, in which no difference was ob-served in hemoglobin concentrations at the end of the intervention period.
Others studies also demonstrated that rice fortified intake reduced the prevalence of iron deficiency anemia in children and adults20,21. In
the present study, it was not possible to assess the impact of UR® on reducing the prevalence of
anemia, since anemic or iron deficient children did not participate in the study.
The UR® added to polished rice showed an
excellent acceptance. Although the facial hedonic scale is the most recommended method to evalu-ate the acceptability of preparations, being fit for illiterate children22, for children of this age group
the AI may be in a better parameter to evaluate acceptance of a preparation, because very young children may have difficulty understanding small differences in facial expression on the five-point hedonic scale.
Reports encountered in literature deal only with studies of acceptability for fortified rice in adults, so this is the first study in which children assess acceptance of UR® mixed with polished
rice. As an example, when using a 7-point hedon-ic scale applied to 37 untrained adult judges, the authors of a study19 obtained average scores of
acceptance between 5 and 6 for the attributes ap-pearance, color, odor and taste, ranging between the hedonic terms “liked” and “really liked”, in-dicating that iron and the other micronutrients used in this rice fortification process did not cause changes in the sensory characteristics of the final product. In a study conducted in India, 24 women assessed rice fortified with ferric pyro-phosphate, containing 3 to 5 mg of iron/100 g of rice, by means of triangular tests and could not distinguish the fortified rice from conventional rice, both in its raw and cooked form20.
Conclusions
Greater intake of vitamin B1, iron and folate in the test preschool may be attributed to the con-sumption of fortified rice (UR®). The UR®
im-proved the nutritional status of preschool chil-dren in relation to the concentrations of zinc, thiamin, folic acid, MCH and MCHC.
Sensory acceptance of UR®, evaluated by the
aúd
e C
ole
tiv
a,
22(2):583-592,
2017
Collaborations
CMD Lucia wrote the project, collected and an-alyzed the data and wrote the manuscript; LLM Santos, BP Silva e PC Anunciação analyzed the data and wrote the manuscript; SCC Franceschi-ni, HS Duarte Martino and RCG Alfenas helped to wrote and correct the manuscript; HMP Sant’Ana oriented the students, helped to write the project and corrected the manuscript.
Acknowledgments
The authors thank PROBIC/FAPEMIG, PIBIC/ CNPq and FAPEMIG for the financial support and PATH for the donation of the fortified rice.
References
1. Mariath AB, Giachini RM, Lauda LG, Grillo LP. Es-tado de ferro e retinol sérico entre crianças e adoles-centes atendidos por equipe da Estratégia de Saúde da Família de Itajaí, Santa Catarina. Cien Saude Colet
2010; 15(2):509-516.
2. Martins MC, Oliveira YP, Coitinho DC, Santos LMP. Panorama das ações de controle da deficiência de vita-mina A no Brasil. Rev Nutr 2007; 20(1):5-18.
3. Leal LP, Osório MM. Validação e reprodutibilidade de sinais clínicos no diagnóstico de anemia em crianças Validity and reproductibility of the clinical signs for the diagnosis of anemia in children. Cad Saude Publica. 2005; 21(2):565-572.
4. Nutti MR, Carvalho JLV, Watnabe E. A biofortificação como ferramenta para combate a deficiências em micro-nutrientes. Brasília: Embrapa; 2006.
5. Sena KCM, Pedrosa LFC. Efeitos da suplementação com zinco sobre o crescimento, sistema imunológico e diabetes. Rev Nutr 2005; 18(2):251-259.
6. Costa EQ, Ribeiro VMB, Ribeiro ECO. Programa de al-imentação escolar: espaço de aprendizagem e produção de conhecimento. Rev Nutr 2001; 14(3):225-229. 7. Zancul MS. Fortificação de alimentos com ferro e
vita-mina A. Medicina 2004; 37:45-50.
8. Dexter PB. Rice Fortification For Developing Coun-tries [database on the Internet]. USAID. 2012. [cited 2016 Mar 1]. Avaliable from: http://pdf.usaid.gov/ pdf_docs/Pnacd279.pdf
9. National Research Council. Committee on Dietary Al-lowances. National Research Council, Food and Nutri-tion Board. Recommended dietary allowances. Washing-ton: National Academy Press; 1980.
10. Mera R, Thompson H, Prasad C. How to calculate sam-ple size for an experiment: a case-based description.
Nutr Neurosci 1998; 1(1):87-91.
11. Radhika MS, Nair KM, Kumar RH, Rao MV, Ravinder P, Reddy CG, Brahmam GN. Micronized ferric pyro-phosphate supplied through extruded rice kernels improves body iron stores in children: a double-blind, randomized, placebo-controlled midday meal feeding trial in Indian schoolchildren. Am J Clin Nutr 2011; 94(5):1202-1210.
12. Mancinelli R, Ceccanti M, Guiducci MS, Sasso GF, Se-bastiani G, Attilia ML, Allen JP. Simultaneous liquid chromatography assessment of thiamine, thiamine monophosphate and thiamin diphosphate in human erythrocytes: a study on alcoholics. J Chromat B 2003; 789(2):355-363.
13. Centro Colaborador em Alimentação e Nutrição Es-colar CECANE-UNIFESP. Manual para aplicação dos testes de aceitabilidade no Programa Nacional de Ali-mentação Escolar – PNAE. São Paulo: CECANE-UNI-FESP; 2010.
14. Conselho Nacional de Saúde (CNS). Diretrizes e nor-mas regulamentadoras de pesquisa envolvendo seres hu-manos. Brasília: CNS; 1997.
15. Carvalho MC, Baracat ECE, Sgarbieri VC. Anemia fer-ropriva e anemia de doença crônica: distúrbios do me-tabolismo de ferro. Segur alim nutr 2006;13(2):54-63. 16. Gleerup A, Rossander-Hulthén L, Gramatkovski E,
D
el
la L
ucia CM
17. Osório MM. Fatores determinantes da anemia em cri-anças. J pediatr 2002; 78(4):269-278.
18. Lynch SR. Interaction of iron with other nutrients. Nu-trition Reviews 1997; 55(4):102-110.
19. Beinner MA, Velasquez-Meléndez G, Pessoa MC, Greiner T. Iron-fortified rice is as efficacious as supple-mental iron drops in infants and young children. J nutr
2010; 140(1):49-53.
20. Moretti D, Zimmermann MB, Muthayya S, Thank-achan P, Lee T-C, Kurpad AV, Hurrell RF. Extruded rice fortified with micronized ground ferric pyrophos-phate reduces iron deficiency in Indian schoolchildren: a double-blind randomized controlled trial. Am J clin nutr 2006; 84(4):822-829.
21. Hotz C, Porcayo M, Onofre G, García-Guerra A, Elliott T, Jankowski S, Greiner T. Efficacy of iron-fortified Ul-tra Rice in improving the iron status of women in Mex-ico. Food Nutr Bull 2008; 29(2):140-149.
22. Kimmel SA, Guinard J. Sensory testing with young children. Food technol 1994; 48(3):92-94.
Artigo apresentado em 17/11/2015 Aprovado em 22/07/2016