A comparative study of manual vs. computerized
cephalometric analysis
Priscila de Araújo Guedes*, July Érika Nascimento de Souza*, Fabrício Mesquita Tuji**, Ênio Maurício Nery***
Abstract
Objective: To conduct a comparative analysis between manual and computerized tracings using specific software, in order to define inter- and intraobserver results. Methods: A sample was used consisting of 50 standardized lateral cephalometric radiographs, of male and female patients of vari-ous age groups. The radiographs were analyzed by two observers, who each performed the manual and computerized tracings of all 50 radiographs. Angular and linear measurements were obtained, which were later submitted to the Mann-Whitney test in order to compare the inter- and intrao-bserver results between the two types of tracings. Results and Conclusions: the study concluded that confidence can be increased in tracings obtained from computer-assisted cephalometric analy-sis, as the discrepancies found between inter- and intraobserver tracings, both manual and comput-erized, were mostly not statistically significant.
Keywords: Radiography. Cephalometrics. Craniometry.
* Master’s candidate in Orthodontics, Centro de Pesquisas Odontológicas São Leopoldo Mandic, Campinas/SP.
** Specialist in Dental Radiology, UFSC. Master and Doctorate in Dental Radiology, FOP-Unicamp. Assistant professor of Integrated Diagnosis, Centro Universitário do Pará. Assistant professor of Introductory Odontology, UFPA.
*** Specialist in Orthodontics and Facial Orthopedics, Uniararas-SP. Master’s in Dentistry, Unicastelo/SP.
INTRODUCTION AND LITERATURE REVIEW
The works of Broadbent and Hoffrat in 1931 pioneered the development of cephalometrics2 and its application in dentistry, especially ortho-dontics. It has since become essential in the di-agnosis, planning10 and result evaluation of cases treated with orthodontics.
When performing a cephalometric analysis, it is necessary to define precisely the manner in which the many different cephalometric land-marks will be determined, so that the exams
have universal application—which is, in fact, one of its main qualities. Indeed, it was the wide standardization of analysis methods that made possible the development of cephalometric radi-ography as a diagnostic tool.19
and in the study of immediate and long-term defects of these treatments. More recently, it has gained increased relevance in the evolution of orthognathic surgery.
Currently, cephalometric radiography can be regarded as a product of the evolution in anthro-pometric and archeological studies. With regard to the study of bones, the need emerged to stan-dardize the communication between the fields of archeology and anthropometrics, so that de-scriptions became more precise and made possi-ble objective comparisons of bone morphology. This led to the creation of bone measurement procedures, which became known as osteom-etry, while the specific measurement of cranial bones was named craniometry. Cephalometrics, meanwhile, consists of measuring the entire head, including the surrounding soft tissue.
Image thickness and resolution, anatomical complexity and superimposition of hard and soft tissue, and the experience of the observers when looking for a particular landmark are im-portant factors that can influence the identifica-tion of the landmark.17
Traditional cephalometric analysis is pre-formed by tracing radiographic landmarks on an acetate sheet and using the landmarks to mea-sure the desired linear and angular values. This traditional method using manual tracing can take time and the linear and angular cephalo-metric measurements obtained manually using a ruler and protractor can lead to errors.5
The objective of using computers was to verify whether there would be a reduction in reproducibility errors of measurements in cephalometric analyses and whether the tracer’s experience had a significant influence. It was observed that there was not a satisfactory re-production of the measurements involving inci-sors, thus demonstrating that experience is not a factor that can in itself significantly reduce the margin of systematic error in computer-assisted Steiner analysis.16
A comparative study between the manual and computerized cephalometric measurement methods was performed by Richardson14 in 1981. He compared 50 lateral cranial radiographs of 12-year-old children, half male and half female. Fourteen landmarks were defined in that study: S, N, anterior nasal spine, subspinal, incisal and zenith of the maxillary incisor, incisal and zenith of the maxillary incisor, supramenton, pogonion, gnathion, molar, pterygomaxillary and articulare. The conclusion was that traditional methods were inferior in comparison to digital procedures, but not alarmingly so, and in some cases traditional methods produced more precise results.
As the use of computers in assisting cepha-lometric analysis gained popularity, both in research and in clinical applications, Nimkarn and Miles12 studied the reliability of computer-assisted cephalometrics in 1995. Forty radio-graphs from the same x-ray machine were used and chosen at random. Each radiograph was traced in acetate paper, and the images of the radiographs and tracings were captured in a vid-eo camera, projected onto a monitor, where the landmarks were digitized. The cephalometric measurements were obtained using Quick Ceph 5.1 software (Quick Ceph Systems, USA). The program performed the calculations for all 40 measurements, from 22 marked landmarks. In order to assess methodology errors and identify the source of errors, the study consisted of five parts: 1) Reproducibility of computerized mea-surement technique; 2) Video imaging, digitali-zation and software; 3) Digitalidigitali-zation and soft-ware; 4) Computer vs. manual measurement; 5) Software calibration and operator digitaliza-tion errors. The results showed that the mea-surements performed in the computer were comparable to manual measurements, with no statistically significant differences.
64
35 119
22 2 6
4 74 98 27
114
-1 78 76 1
1
12
the traditional method and 100 radiographs obtained from digital imaging, demonstrated a coincidence in intraobserver cephalometric landmarks and little interobserver difference.9 The authors also highlighted that the linear and angular measurements were more precise in the digitally obtained radiographs, emphasizing that the quality of digital radiographs facilitates cephalometric measurements.9
The objective of the present work was to compare the measurements made using comput-erized cephalometric tracing software to manual measurements, with the purpose of establishing the level of agreement between them, as well as evaluating intra- and interobserver results.
METHODOLOGY
In order to perform the current study, a sam-ple was used consisting of 50 lateral cephalomet-ric radiographs belonging to patients from the same dental radiology center, selected accord-ing to the followaccord-ing criteria: Random selection,
patients from both genders, patients from several age groups.
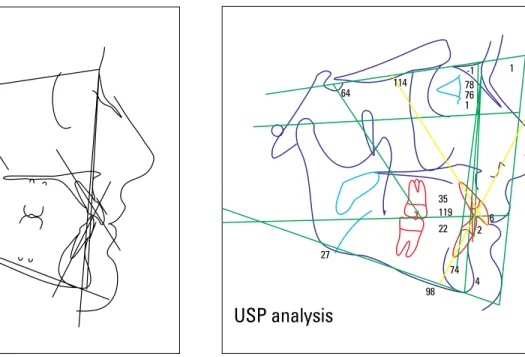
The radiographs were measured with two dif-ferent methods, by two observers, named: Observ-er 1—consisting of 25 latObserv-eral cephalometric radio-graphs, in which linear and angular measurements were made using both the manual method (Fig 1) and computer-assisted method (Fig 2) with Cef-X 2001 software (CDT, Cuiabá, Brazil) under USP analysis; and Observer 2—consisting of 25 lateral cephalometric radiographs, in which linear and angular measurements were made using both the manual method and computer-assisted method with Cef-X 2001 software under USP analysis.
After each observer had measured their 25 radiographs, the x-rays were exchanged between the two observers, so that both inter- and intrao-bserver results could be obtained, totaling an evaluation of 50 radiographs per observer.
After calibration of observers 1 and 2, in order to reduce errors during the study and standardize the procedures, the tracing and
FIGURE 1 - Manual cephalometric tracing. FIGURE 2 - Computerized cephalometric tracing.
STATISTICAL ANALYSIS
The measurements obtained from the man-ual and computerized cephalometric tracings were organized in tables and later subjected to statistical analysis through the Mann-Whitney test, which is a non-parametric test performed to compare two independent and same-size samples, whose scores have been measured or-dinally.1
RESULTS
For each factor of the USP-standard cepha-lometric analysis, the arithmetic mean was ob-tained for the manual and computerized mea-surements of all tables.
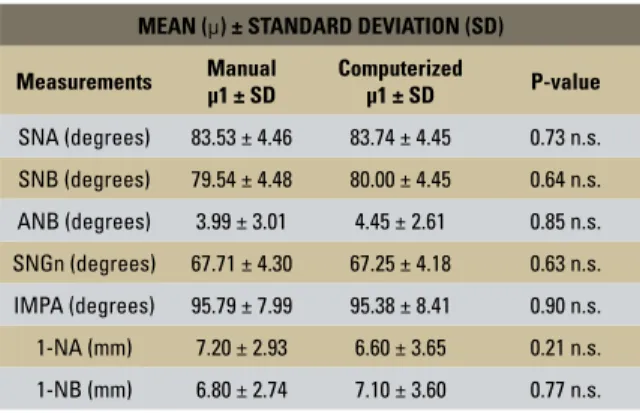
The comparison of measurements between the manual and computerized tracings of Ob-server 1, after the test was applied, did not show significant differences (Table 1).
The comparison of measurements between the manual and computerized tracings of Ob-server 2, after the test was applied, showed that the angular measurements did not show signifi-cant differences, whereas linear measurements (1-NA and 1-NB) showed statistically significant differences (Table 2).
The comparison of the measurements between the manual tracings of observers 1 and 2, after the cephalometric measurements were obtained in
ultraphan paper. The drawings of anatomical structures and cephalometric landmarks, and the USP analysis were made using a light box in a dark room. A maximum of 10 radiographs were evaluated per day by each observer, in order to avoid fatigue leading to casual errors.
Cephalometric measurements were estab-lished as follows: angular and linear measure-ments. In both methods of cephalometric tracing evaluated in this work, the linear measurements defined were 1-NA and 1-NB, and the angular measurements were SNA, SNB, ANB, SNGn and IMPA.
The data were noted on a record sheet and tabulated on a computer for later tests.
The radiographs were later digitized and stored in a computer for computerized cephalo-metric analysis. After that stage, the radiographs were imported into the Cef-X program, where they were calibrated in order to avoid any distor-tion of the program with the original radiograph. Next, computer measurements were made us-ing the Cef-X computer program, by markus-ing the landmarks directly on the screen using the mouse cursor. Next, the data provided by the program were calculated and a report sheet model was issued for each radiograph.
MEAN (µ) ± STANDARD DEVIATION (SD)
Measurements Manual µ1 ± SD Computerized µ1 ± SD P-value
SNA (degrees) 83.53 ± 4.46 83.74 ± 4.45 0.73 n.s.
SNB (degrees) 79.54 ± 4.48 80.00 ± 4.45 0.64 n.s.
ANB (degrees) 3.99 ± 3.01 4.45 ± 2.61 0.85 n.s.
SNGn (degrees) 67.71 ± 4.30 67.25 ± 4.18 0.63 n.s.
IMPA (degrees) 95.79 ± 7.99 95.38 ± 8.41 0.90 n.s.
1-NA (mm) 7.20 ± 2.93 6.60 ± 3.65 0.21 n.s.
1-NB (mm) 6.80 ± 2.74 7.10 ± 3.60 0.77 n.s. TABLE 1 - Mean of the measurements obtained using the different meth-ods, according to the process of Observer 1, and the result of the Mann-Whitney test.
TABLE 2 - Mean of the measurements obtained using the different meth-ods, according to the process of Observer 2, and the result of the Mann-Whitney test.
n.s. = non-significant (p > 0.05); * = significant (p < 0.05). n.s. = non-significant (p > 0.05); * = significant (p < 0.05).
MEAN (µ) ± STANDARD DEVIATION (SD)
Measurements Manual µ2 ± SD Computerized µ2 ± SD P-value
SNA (degrees) 83.44 ± 3.85 84.13 ± 4.77 0.57 n.s.
SNB (degrees) 79.18 ± 4.65 79.97 ± 4.80 0.54 n.s.
ANB (degrees) 4.38 ± 2.47 5.53 ± 3.00 0.83 n.s.
SNGn (degrees) 68.70 ± 4.42 67.30 ± 4.56 0.33 n.s.
IMPA (degrees) 94.82 ± 12.06 95.74 ± 6.49 0.67 n.s.
1-NA (mm) 3.80 ± 0.53 6.71 ± 4.12 0.00001 *
test was applied, showed that the angular mea-surements did not show statistically significant differences, whereas linear measurements (1-NA and 1-NB) showed statistically significant differ-ences (Table 3).
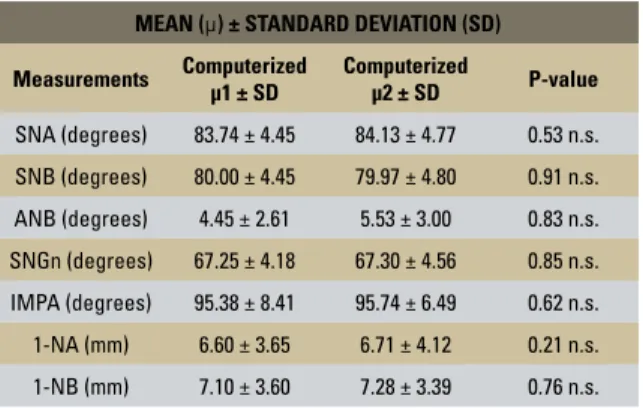
The comparison of measurements between the computerized tracings of observers 1 and 2, after the test was applied, showed that the differ-ences were not significant (Table 4).
The comparison of the measurements be-tween the manual and computerized tracings
of observers 2 and 1, respectively, after the test was applied, showed that the angular measure-ments did not show statistically significant dif-ferences, whereas linear measurements (1-NA and 1-NB) showed statistically significant dif-ferences (Table 5).
The comparison of measurements between the computerized and manual tracings of ob-servers 2 and 1, respectively, after the test was applied, showed that the differences were not significant (Table 6).
TABLE 3 - Mean of the measurements obtained using the Manual meth-od, according to the processes of Observers 1 and 2, and the result of the Mann-Whitney test.
TABLE 4 - Mean of the measurements obtained using the Computerized method, according to the processes of Observers 1 e 2, and the result of the Mann-Whitney test.
n.s. = non-significant (p > 0.05); * = significant (p < 0.05). n.s. = non-significant (p > 0.05); * = significant (p < 0.05).
MEAN (µ) ± STANDARD DEVIATION (SD)
Measurements Manual µ1 ± SD
Manual
µ2 ± SD P-value
SNA (degrees) 83.53 ± 4.46 83.44 ± 3.85 0.94 n.s.
SNB (degrees) 79.54 ± 4.48 79.18 ± 4.65 0.99 n.s.
ANB (degrees) 3.99 ± 3.01 4.38 ± 2.47 0.85 n.s.
SNGn (degrees) 67.71 ± 4.30 68.70 ± 4.42 0.65 n.s.
IMPA (degrees) 95.79 ± 7.99 94.82 ± 12.06 0.46 n.s.
1-NA (mm) 7.20 ± 2.93 3.80 ± 0.53 0.00001 *
1-NB (mm) 6.80 ± 2.74 2.86 ± 0.61 0.00001 *
MEAN (µ) ± STANDARD DEVIATION (SD)
Measurements Computerized µ1 ± SD Computerized µ2 ± SD P-value
SNA (degrees) 83.74 ± 4.45 84.13 ± 4.77 0.53 n.s.
SNB (degrees) 80.00 ± 4.45 79.97 ± 4.80 0.91 n.s.
ANB (degrees) 4.45 ± 2.61 5.53 ± 3.00 0.83 n.s.
SNGn (degrees) 67.25 ± 4.18 67.30 ± 4.56 0.85 n.s.
IMPA (degrees) 95.38 ± 8.41 95.74 ± 6.49 0.62 n.s.
1-NA (mm) 6.60 ± 3.65 6.71 ± 4.12 0.21 n.s.
1-NB (mm) 7.10 ± 3.60 7.28 ± 3.39 0.76 n.s.
TABLE 5 - Mean of the measurements taken using the different methods, according to the processes of Observers 2 and 1, and the result of the Mann-Whitney test.
n.s. = non-significant (p > 0.05); * = significant (p < 0.05).
MEAN (µ) ± STANDARD DEVIATION (SD)
Measurements Manual µ2 ± SD
Computerized
µ1 ± SD P-value
SNA (degrees) 83.44 ± 3.85 83.74 ± 4.45 0.45 n.s.
SNB (degrees) 79.18 ± 4.65 80.00 ± 4.45 0.49 n.s.
ANB (degrees) 4.38 ± 2.47 4.45 ± 2.61 0.65 n.s.
SNGn (degrees) 68.70 ± 4.42 67.25 ± 4.18 0.23 n.s.
IMPA (degrees) 94.82 ± 12.06 95.38 ± 8.41 0.44 n.s.
1-NA (mm) 3.80 ± 0.53 6.60 ± 3.65 0.00001 *
1-NB (mm) 2.86 ± 0.61 7.10 ± 3.60 0.00001 *
TABLE 6 - Mean of the measurements taken using the different methods, according to the process of Observers 2 and 1, and the result of the Mann-Whitney test.
n.s. = non-significant (p > 0.05); * = significant (p < 0.05).
MEAN (µ) ± STANDARD DEVIATION (SD)
Measurements Computerized µ2 ± SD
Manual
µ1± SD P-value
SNA (degrees) 84.13 ± 4.77 83.53 ± 4.46 0.97 n.s.
SNB (degrees) 79.97 ± 4.80 79.54 ± 4.48 0.96 n.s.
ANB (degrees) 5.53 ± 3.00 3.99 ± 3.01 0.86 n.s.
SNGn (degrees) 67.30 ± 4.56 67.71 ± 4.30 0.95 n.s.
IMPA (degrees) 95.74 ± 6.49 95.79 ± 7.99 0.94 n.s.
1-NA (mm) 6.71 ± 4.12 7.20 ± 2.93 0.89 n.s.
DISCUSSION
The studies related to the same theme and with a similar purpose as this research, reviewed in literature, show a lack of criteria with regard to the choice of cephalometric landmarks and the ideal linear/angular measurements to be used in studies of this nature.3,4,6,7,12,16
Justifications can be made with regard to the selection of landmarks and cephalometric mea-surements in this type of work, as exemplified in the ease of locating the landmarks, provid-ing higher reliability and precision, which can directly influence the measurement,13,17,18 as the reproducibility of the measurement is part of different types of cephalometric analysis pro-posed by several authors.2,5,7,8,11,16
The manual method required higher time ex-penditure, but it is the most common method for tracing, identifying landmarks, measuring dis-tances and angles between the locations of the landmarks,15 in addition to having a high possibil-ity of error. The authors recommended the repli-cation of tracings as a good measure to diminish the possibility of error with this method.16
With the advent of the computer-assisted method, a decrease in the differences of cepha-lometric measurements began to be observed, as the precision of the measurements became significantly more accurate due to the intrinsic characteristics of measuring computer pixels.7
The computer reduced, although discretely, the possibility of differences, as it is more secure than the manual method. When locating land-marks defined as being more inferior or deep in a given bone contour—for instance, points A, B and N—the computerized method proved to be more reliable than the manual method.13
However, in order to obtain a computer-as-sisted cephalometric tracing, it is important to have anatomical/radiographic knowledge of the cephalometric structures required for marking the landmarks, even though it becomes easier and faster to identify anatomical structures and
mark the landmarks, as different features of the software can be used—such as zoom, contract and brightness.
With respect to marking the cephalometric landmarks related to the location of N, B and A vertically, we verified that the difficulty in adequately reproducing them is similar in the manual and computerized methods.14,16
With regard to angular measurement SNGn, although it is a measurement that involves the landmark N, which is difficult to locate in both methods, it is not statistically different in both methods of cephalometric tracing.8,18
The angular measurement IMPA is easily mea-surable, as it does not involve hard-to-find land-marks described in this study. It also did not show statistically significant changes in both methods.8
Linear measurements 1-NA and 1-NB, which require the location of points A and B (which in turn are equally difficult to reproduce both in the manual and computer-assisted methods), did not show statistically significant differences in this study when comparing the measurements of the manual and computerized tracings of Observer 1, when comparing interobserver computerized tracings, and when comparing the computerized tracing measurements of Observer 2 with the manual tracing measurements of Observer 1.8
However, for linear measurements 1-NA and 1-NB, when comparing the manual and comput-erized tracings of Observer 2, there were statisti-cally significant differences in this study.16 When comparing interobserver manual tracings and when comparing the manual tracing of Observ-er 2 with the computObserv-erized tracing of ObsObserv-ervObserv-er 1, there were also statistically significant differ-ences in this study.4
CONCLUSION
According to the results obtained through the methodology used in this research, it is con-cluded that:
1) The confidence can be increased in the results of cephalometric tracings obtained from computers, as the discrepancies found between the measurements of manual and computerized tracings were, in their majority, statistically non-significant.
2) Intraobserver linear measurements showed statistically significant differences between manual
and computerized tracings for one of the observers. 3) Interobserver linear measurements showed statistically significant differences both in manual tracing and between manual and computerized tracings. However, there was no statistical differ-ence in the results of computer-assisted tracings. 4) The time spent to perform manual tracing was greater than for computerized tracing.
Submitted: February 2007 Revised and accepted: July 2007
Contact address
Priscila de Araujo Guedes
Rua dos Mundurucus Conj. Régia Danin, 2781 – 07 CEP: 66.040-270 - Belém / PA – Brazil
E-mail: [email protected]
REFERENCES
1. Ayres M. BioEstat, aplicações estatísticas nas áreas das ciências biológicas e médicas. Manaus: Sociedade Civil Mamirauá; 1998. 2. Baskin HN, Cisneros GJ. A comparison of two computer
cephalometric programs. J Clin Orthod. 1997 Apr;31(4):231-3. 3. Chen YJ, Chen SK, Yao JC, Chang HF. The effects of
differences in landmark identification on the cephalometric measurements in traditional versus digitized cephalometry. Angle Orthod. 2004 Apr;74(2):155-61.
4. Chen YJ, Chen SK, Chang HF, Chen KC. Comparison of landmark identification in traditional versus computer-aided digital cephalometry. Angle Orthod. 2000 Oct;70(5):387-92. 5. Chen SK, Chen YJ, Yao CC, Chang HF. Enhanced speed
and precision of measurement in a computer-assisted digital cephalometric analysis system. Angle Orthod. 2004 Aug;74(4):501-7.
6. Dana JM, Goldstein M, Burch JG, Hardigan PC. Comparative study of manual and computerized cephalometric analysis. J Clin Orthod. 2004 May; 38(5):293-6.
7. Davis DN, Mackay F. Reliability of cephalometric analysis using manual and interactive computer methods. Br J Orthod. 1991 May;18(2):105-9.
8. Ferreira JT, Telles C de S. Evaluation of the reliability of computerized profile cephalometric analysis. Braz Dent J. 2002;13(3):201-4.
9. Hagemann K, Vollmer D, Niegel T. Prospective study on the reproducibility of cephalometric landmarks on conventional and digital lateral headfilms. J Orofac Orthop. 2000;61(2):91-9. 10. Morgan R. Computer-aided cephalometric tracing and analysis.
Funct Orthod. 1992 Jan-Feb;9(1):15-7,19-20.
11. Vargas NJV, Pinzan A, Henriques JFC, Freitas MR, Janson GRP, Almeida RR. Avaliação comparativa entre a linha sela-násio e o plano horizontal de Frankfurt como parâmetros para o diagnóstico das posições antero-posterior e vertical das bases ósseas, em jovens brasileiros leucodermas com más oclusões de Classe I e II de Angle. Rev Dental Press Ortod Ortop Facial. 1999 mar-abr;4(2):13-22.
12. Nimkarn Y, Miles PG. Reliability of computer-generated cephalometrics. Int J Adult Orthodon Orthognath Surg. 1995;10(1):43-52.
13. Richardson A. An investigation into the reproducibility of some points, planes, and lines used in cephalometric analysis. Am J Orthod. 1966 Sep;52(9):637-51.
14. Richardson A. A comparison of traditional and computerized methods of cephalometric analysis. Eur J Orthod.
1981;3(1):15-20.
15. Rudolph DJ, Sinclair PM, Coggins JM. Automatic computerized radiographic identification of cephalometric landmarks. Am J Orthod Dentofacial Orthop. 1998 Feb;113(2):173-9. 16. Trajano FS, Pinto AS, Ferreira AC, Kato CMB, Cunha RB,
Viana FM. Estudo comparativo entre os métodos de análise cefalométrica manual e computadorizada. Rev Dental Press Ortod Ortop Facial. 2000 nov-dez;5(6):57-62.
17. Trpkova B, Major P, Prasad N, Nebbe B. Cephalometric landmarks identification and reproducibility: a meta analysis. Am J Orthod Dentofacial Orthop. 1997 Aug;112(2):165-70. 18. Vasconcelos MHF. Avaliação de um programa de traçado