ISSN 0104-6632 Printed in Brazil
www.abeq.org.br/bjche
Vol. 24, No. 04, pp. 477 - 486, October - December, 2007
Brazilian Journal
of Chemical
Engineering
A MATHEMATICAL MODEL DESCRIBING THE
KINETIC OF CATIONIC LIPOSOME PRODUCTION
FROM DRIED LIPID FILMS ADSORBED IN A
MULTITUBULAR SYSTEM
L. G. Torre, A. L. Carneiro, R. S. Rosada, C. L. Silva and M. H. A. Santana
*Department of Biotechnological Processes, School of Chemical Engineering, State University of Campinas, Cx. P. 6066, 13081-970,
Phone: +(55) (19) 35213921, Fax: +(55) (19) 3521-3910, Campinas, SP, Brazil Email: [email protected]
(Received: February 01, 2007 ; Accepted: September 4, 2007)
Abstract - Cationic liposomes are an alternative to DNA non-viral carrier in gene therapy, promoting higher efficiency for DNA transport and delivery into the cells. Liposome production in large scale is still a challenge. Among many processes, the liposome production from a dried film adsorbed inside a multitubular system is promising due to its operational simplicity. In this field, engineering contributions are scarce and no mathematical treatment in the literature describing the liposome production in this type of process is available. A mathematical formulation is proposed to describe the kinetic of liposome production considering the wetting and disintegration of the dried lipid film followed by lipids aggregation into bilayers generating liposomes. The proposed model has fitted the experimental kinetic data of lipid mass disintegration and the lipid film thickness, being useful for predictions of the scaling up of liposome production as well as contributing to the development of pharmaceutical products.
Keywords: Liposomes; Scale-up; Mathematical modeling.
INTRODUCTION
Liposomes are colloidal aggregates composed of self-assembled phospholipid molecules, which form one or various concentric bilayers delimiting an aqueous central nucleous. Those aggregates also named vesicles, mimetize the cell structure in composition and function, allowing the incorporation of hydrophilic, hydrophobic or amphiphilic compounds, including nucleic acids (Lasic, 1997). Aiming to reach a specific targeting or to enhance the interactions between the cell surface and the internalization of compounds, functional liposomes have been designed and constructed, increasing the therapeutic efficiency of drugs. Transfection, is a biological event in which DNA molecules are internalized into the cells, delivered in the
engineering studies and different approaches have been proposed in order to circumvent this problem (Kikuchi, 1991; Lasic, 1993, 1997).
Tournier et al. (1999), based on the Bangham method (Bangham et al., 1965), proposed that dried lipid films formed in the inner walls of tubes could be hydrated allowing the self-assembling of lipids generating liposomes. Carneiro and Santana (2004) demonstrated experimentally the potentialities of the liposome production in a multitubular system, useful for scaling up of process. They used neutral lipids, such as soy lecithin, constructed the adsorption isotherm of lipids in the inner wall of glass tubes and monitored the kinetic profiles of liposome generation.
Although both previous studies focused the experimental approaches, no mathematical treatment was proposed for describing this process. The mathematical modeling of the kinetic for the liposome generation from the disintegration of an adsorbed dried film and subsequent liposome generation in aqueous solution, provides elements to design the multitubular system for a required production. Considering the physical phenomena occurring in only one tube are the same for a set of similar tubes, the scaling up of the process is determined by the number, length and inner diameter of tubes.
Mortha et al. (1993) derived a mathematical model to describe the penetration of water in a fast disintegrating tablet. The principle of the model was that a wetting capillarity front is in movement from the surface towards the interior of the tablet and is followed by a disintegrating front at the surface of the tablet. Such model allows describing the relative influence of parameters inherent to the porous structure, in terms of external mass transfer at the surface and the internal resistance related to the capillary water penetration.
Even though there are differences between Mortha`s and the multitubular systems, the dissolution of a dried lipid film is also fast and controlled by resistances due to water penetration in the film as well as the transferring of lipids from the surface to the bulk of the solution. In this case, the capillarities in the film could be provided by the packing of the hydrophilic moieties of the lipid molecules, and a model similar to that proposed by Mortha could be derived.
This work proposes a model for describing the lipid film disintegration from the inner walls of tubes, and subsequent liposome generation in water solution. The first steps of film disintegration and lipid solubilization were described by the Mortha’s model. An additional term was included to the Mortha’s formulation for description of the lipid self- aggregation and liposome generation at the final step of the process. The liposome concentration in
the medium was written as a nonlinear function of time, following the behavior of the experimental profile with the kinetic parameters previously adjusted. The adsorption of the lipids from a mixture was considered non-competitive and the disintegration was expressed as a total mass of lipids.
This model was fitted to the kinetic experimental data of lipid mass disintegration and the experimental thickness of the adsorbed lipid film was used as a validation parameter of the model.
MATERIAL AND METHODS
Experimental Set Up
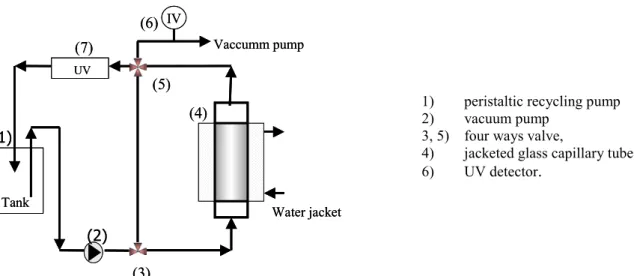
The flow sheet of the experimental unit used for the liposome production is shown in Figure 1. It was composed basically by a jacketed glass capillary tube of 1.6 mm inner diameter and 11.5 cm height (4), a lipid solution tank (1), peristaltic recycling pump (2) vacuum pump (6) and a UV detector working at 340nm (7) for absorbance measurements of lipid dispersion. The basic production steps were: (i) Adsorption of the lipids inside the capillary tube; (ii) Vacuum drying of the adsorbed lipid film; (iii) Hydration to allow lipid dissolution and liposome formation.
Materials and Experimental Methods
UV
Tank
Vaccumm pump IV
(1)
(2)
(3)
(4) (5) (6)
(7)
Water jacket
UV
Tank
Vaccumm pump IV
(1)
(2)
(3)
(4) (5) (6)
(7)
Water jacket
1) peristaltic recycling pump
2) vacuum pump
3, 5) four ways valve,
4) jacketed glass capillary tube
6) UV detector.
Figure 1: Process flow sheet for the cationic liposome production, based on the adsorption of lipids and subsequent formation of dried film in the inner wall of the tube. The hydration of the
dried film allows the self-assembling of lipids generating liposomes.
Lipid Film Thickness
The lipid film thickness was experimentally measured by scanning electron microscopy. After adsorption and drying of the lipid film, the capillary was removed from the system and subsequently cut in different heights. Micrographs of the pieces were done by scanning electron microscopy (Leica, LEO 440i) and the thickness of the dried lipid film was determined using the software Leica Qwin500.
Model Formulation
The prediction of disintegration of the dried lipid film adsorbed in a capillary tube was based on the work of Mortha et al. (1993) that described a tablet disintegration in aqueous media. The principle of the model is that a wetting capillary front in movement from the surface towards the interior of the tablet and followed by a disintegrating front at the surface of the tablet. The rate of capillary penetration can be described by the well verified Washbourn’s relation, (Washburn, 1921) (Equation 1).
H 2
.cos .d
L . t
4. .
V T
W K (1)
Where L is the length of penetration of the liquid in the capillary at time t; V is the surface tension of the liquid, T is the solid-liquid contact angle, dH is the hydraulic diameter of the porous contained in the solid, W is the tortuosity parameter, Kis the viscosity of the liquid and t is the time.
The Equation 1 is not valid in many cases due to non-stationary conditions of the liquid flow. Thus, the penetration constant (K) is introduced as described in Equation 2.
m(t)
L K.t (2)
Where m(t) may vary from 1 at the early time of penetration to 0 as the total penetration is achieved. K is the penetration constant.
The disintegration or solubilization mechanism of the lipids from the film was considered similar to the tablet disintegration proposed by Mortha et al. (1993). The criterion for similarity was the fast disintegration imparted by the capillary penetration of the water in the porous structure of the dried film.
The modifications on the film thickness and in the aqueous media occur as far as the components are being dissolved, indicating that K is not a constant value but depends on time. A kinetics behavior may be considered according to Equation 3.
m
L K(t).t (3)
The differentiation of Equation 3 leads to a modified equation for the penetration rate (Equation 4).
1 m 1
m m
dL L dK
. m.K .L dt K dt
(4)
The film disintegration is a consequence of the dissolution reaction that occurs inside the pores when the lipids interact with the liquid. This process is limited by the reaction rate, internal and external mass transfer.
d ext s ext
dM
k .S . C C
dt (5)
Where kd is the mass transfer coefficient, Cs is the concentration of the specie in the liquid layer near the solid surface, Cext is the concentration of the specie in the external liquid medium, Sext is the external area which is calculated by Equation 6.
ext 0
S S §¨1H·¸
W
© ¹ (6)
Where His thesolid porosity and S0 is the external total surface (solid + void).
The solubilized mass of lipids depends on the wet surface of the film , the reaction rate and the solubility of the lipids in the aqueous media. This phenomenon may be described by Equation 7, where Kint is a complex rate constant, proportional to the solid disintegration, and Sint is the internal pore area that is penetrated by the liquid. Sint is a linear function of the penetrated length L, for a isotopic medium of porosity H and capillary diameter dH,
according to Equation 8. The adsorption of the cationic and neutral lipids from the mixture was considered non-competitive, and the disintegration was expressed as a total mass of lipids.
int int
dM
K .S (t)
dt (7)
0 int
H
S . S (t) 4. .L(t)
d
H
(8)
The Kint value is difficult to predict and it is assumed that it has the same magnitude as the rate of transport of dissolved species multiplied by a surface concentration.
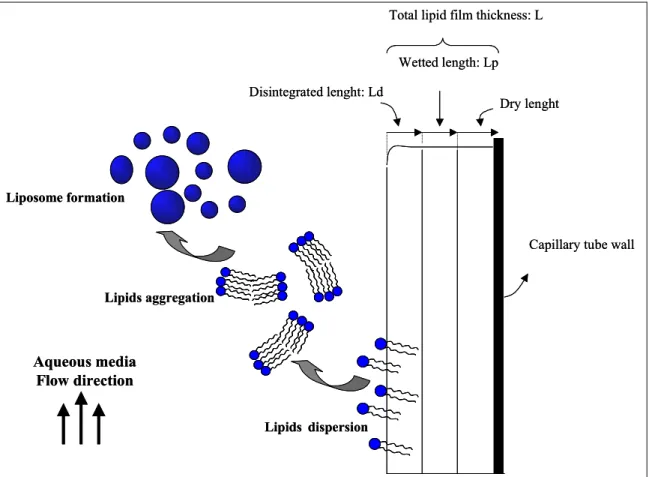
The solubilization of the amphiphilic lipids leads to the aggregation in bilayers followed by vesiculation or liposome formation. The steps from the film disintegration and vesiculation are illustrated in the Figure 2, as well as the lengths of the liquid penetration (Lp) and lipid dissolution (Ld) fronts. Both, Lp and Ld vary with time and tend to reach the initial lipid film thickness L.
Capillary tube wall Total lipid film thickness: L
Disintegrated lenght: Ld
Dry lenght Wetted length: Lp
Lipids dispersion Lipids aggregation
Liposome formation
Aqueous media Flow direction
Capillary tube wall Total lipid film thickness: L
Disintegrated lenght: Ld
Dry lenght Wetted length: Lp
Lipids dispersion Lipids aggregation
Liposome formation
Aqueous media Flow direction
Figure 2: One-dimensional representation of liposome formation from a dried lipid film at the inner of a capillary tube. Lp: length penetrated by the liquid at the time t; Ld:
Equation 9 defines the liquid penetration depth at the time t in the non-disintegrated portion of the film.
L = Lp- Ld (9)
The velocity of the penetration front is obtained from a differentiation of Equation 9 and described in Equation 10:
p d p d
1 m 1
m p d m
dL dL L L dK .
dt dt K dt
m.K . L L
(10)
In the case of lipids in aqueous solution, an additional term may be introduced in the Mortha equations, describing the vesiculation phenomenon. That term represents a consumption of the individual molecules of lipids from the solution due to the self aggregation generating liposomes. Thus, the velocity of disintegrated mass is a contribution from the internal and external mass transfer phenomena and the consumption rate of the individual lipid molecules necessary to generate liposomes. Assuming that the consumption rate follows a first order kinetics, which depends on the liposome concentration, Cv, the mass variation can be defined by Equation 11.
ext 0 int 0
p d v v
H
dM
K .S . 1 K .S . dt
4.
L L K C d
H
§ ·
¨ W¸
© ¹
H (11)
Where Cv is the vesicles concentration and Kv is the reaction rate for liposome generation.
According to the experimental profile shape for the changes of the lipid concentration along time, Equation 12 was proposed for describing the vesicle
concentration changes as a non-linear function of time.
t v
t
K .t C (t)
K ' t (12)
Where Kt and Kt’are the kinetic parameters of the proposed model.
The lipid film dissolution rate is also proportional to the disintegration front dLd/dt according to Equation 13.
d0
dL dM
.S . 1 .
dt U H dt (13)
Where Uis the solid specific mass.
The mathematical model for water penetration into the lipid film, the subsequent disintegration and massive liposome generation is the combination of Equations 11, 12 and 13. The penetration constant K can be represented by an empiric model described in Equation 14.
n0
K K . 1 a.t (14)
RESULTS AND DISCUSSION
The Thickness of the Dried Lipid Film Formed Inside the Capillary Glass
The micrographs obtained through scanning electron microscopy, Figure 3, show clearly the dried lipid film formed inside the capillary tube.
As it can be observed in the Figure 3, there is a great variation of lipid film thickness along the tube. This effect is due to the drying process, which may be optimized in order to get homogeneous thickness. Thus, microphotographs along different capillary tube heights were taken and a weight average thickness was calculated from the histogram distribution shown in Figure 4. The calculated average thickness was 0.47 ± 0.29 Pm.
(a) (b)
0.0 0.2 0.4 0.6 0.8 1.0 1.2 1.4 1.6 1.8 0
50 100 150 200
Ev
en
ts
Lipid film thickness (Pm)
Figure 4: Histogram of the thicknesses of the dried lipid films adsorbed. The total lipid concentration in the alcoholic adsorption dispersion was 50 mM.
Liposomes Formation Kinetic
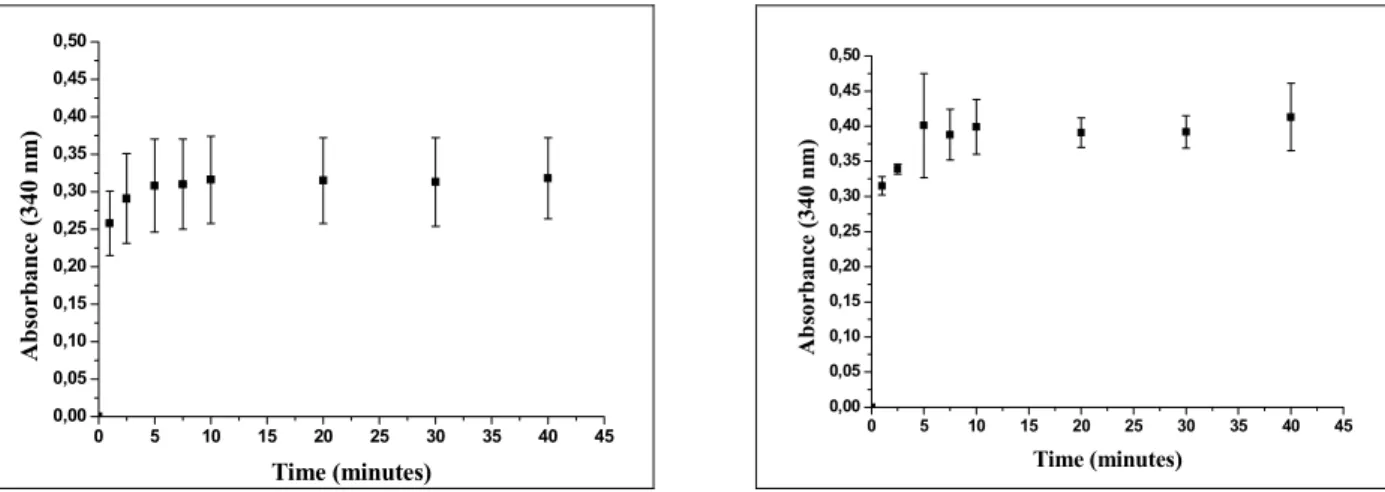
The kinetic of liposome formation was evaluated in two initial concentrations of total lipids in the alcoholic dispersion used in the adsorption step: 50 and 60 mM. Absorbance measurements along time were performed during the hydration step. The obtained kinetic profiles
are shown in the Figures 5a and 5b.
The results show a plateau of absorbance developed at the initial instants, demonstrating the fast formation of liposomes through the hydration of the dried lipid film. The data indicate that the lower the initial lipid concentration, the faster the liposome formation.
0 5 10 15 20 25 30 35 40 45 0,00
0,05 0,10 0,15 0,20 0,25 0,30 0,35 0,40 0,45 0,50
A
b
sorbance (340
nm)
Time (minutes)
(a)
0 5 10 15 20 25 30 35 40 45 0,00
0,05 0,10 0,15 0,20 0,25 0,30 0,35 0,40 0,45 0,50
Ab
so
rb
a
n
ce (3
40
n
m
)
Time (minutes)
(b)
Figure 5: Absorbance profiles at 340 nm along time during liposome formation by hydration of the dried film lipid adsorbed in the inner wall of the capillary glass tube. Lipid composition: EPC/DOPE/DOTAP,
50/25/25% molar. Total lipids concentration in the alcoholic dispersion used in the adsorption step: a) 50mM and b) 60 mM. Standards from n=3.
Mathematical Simulation for Massive Liposome Production
The mathematical simulation for liposome production in the capillary system was obtained solving differential equations 11 to 13 using the Euler method and applying a developed calculation routine using the software Excel 2000 for Windows, Microsoft Corporation, for the determination of the profiles for
the massive liposome production along time.
Table 1: Physico-chemical properties of the aqueous lipid dispersions, film and the capillary system
Capillary tube:
Inner surface area (S0): 5.78 cm2
Aqueous Media
Viscosityҏ (K0.01 g/cm.s (i) Surface tension (V72.8 g/s2 (i)
Solid phase:
Specific mass (U 6.82 g/cm3 (ii) Contact angle (T: 91.2 ± 3.6o (iii)
(i)Reference temperature of 25oC (Perry, 1997)
(ii)Specific mass estimated considering the inner surface area, lipid film thickness and total mass adsorbed on the capillary tube.
(iii)The contact angle was considered similar to the skin surface (composed by an external layer of lipids) (Elkhyat et al., 2004 e Sheu et al., 1999).
The Number of Lipid Molecules Per Liposome (N)
The total number of lipid molecules per liposome (N) was calculated by Equation 15, where DH is the hydrodynamic diameter obtained by measurements of dynamic light scattering (considering spherical geometry and unimodal size distribution), (e) is the thickness of the lipid membrane, considered as 4nm for small unilamellar liposomes, according to Lasic, 1997, and aPL is the cross-sectional area of the polar head of lipids, calculated as a weighted average of the individual lipid cross-sectional areas. The total number of lipid molecules per liposome (N) is the total cross-sectional area of the vesicle divided by the average area of one lipid molecule. The mean diameter of the produced liposomes, 280r29 nm, allowed they were considered as small unilamellar vesicles in the calculations. The cross-sectional area for the individual lipids DOTAP, DOPE and EPC were 0.7, 0.55 and 0.71 nm2, respectively (Lasic, 1997 and Israelachvili & Mitchell, 1975). In this specific case, aPL was 0.67 nm2. The value DH considered was the experimentally measured value
described before (280r29 nm). In these conditions, aPL was 0.67 nm2 and the N value was 7.2x10⁵ lipid molecules per liposome.
2 2
H H
PL
D D
4 . 4 e
2 2
N
a
§ · § ·
S¨ ¸ S¨ ¸
© ¹ © ¹ (15)
Determination of Kt e Kt’ Parameters
The parameters Kt e Kt’ from Equation 12 depend on the vesicles concentration (Cv), that was obtained from the total lipid concentration divided by the aggregation number N. The total lipid concentration was obtained from the calibration curve of absorbance versus total lipid concentration, as described before.
According to Equation 12, Kt e Kt’ were obtained through the linear, 1/Kt, and angular, Kt’/Kt, coefficients from the linear fitting of 1/Cv versus 1/t. The obtained Kt e Kt’ values are presented in Table 2.
Table 2: Calculated parameters Kt, K’t , Kv and Kext for the initial total lipid concentrations in the
alcoholic dispersion used in adsorption step, 50 and 60 mM
Total lipid concentration in the alcoholic phase (mM)
Kt
(mM x 10-6)
K’t
(s)
Kv
(g/mM.s x 10-2)
Kext
(g/cm2.s x 10-8)
50 1.18 14.69 0.02 1.73
Determinations of Kv and Kext
The parameter related to the reaction rate for vesicle production, Kv, described by Equation 11, was determined at the initial instants of vesicles formation, or by the derivation of Equation 12, as shown on Equations 16 and 17.
v t t
2 2
t t
dC K .K '
dt K ' 2K '.tt (16)
v t
v v
t
t 0
dC K
K .C
dt o K ' (17)
The vesicle concentration (Cv) to be considered in Equation 17 corresponds to the initial time of liposome formation. In this case, it was considered 5% of the maximum Cv value previously calculated.
It is known that at the final hydration step of liposomes formation there is no lipid mass variation along time (dm/dt = 0) and the whole extension of the lipid film is already penetrated and disintegrated by the liquid (Lp – Ld = 0). In these conditions, Equation 11 can be simplified, and Kext can be obtained as a function of Kv and Cv, according Equation 18.
v v
ext 0
K C K
S . 1§¨ H·¸
W
© ¹
(18)
The values of the parameters Kt e Kt’, Kv and Kext are presented in Table 2.
The values for the other parameters of the model were considered based on the physical criteria and adjusted in order to fit the experimental data. Table 3 shows the adjusted values.
Table 3: Adjusted parameters from the simulation of liposomes formation.
H W Kint
(g/cm2s x 10-8)
dH
(nm x 10-7) a n
Total lipid concentration in the alcoholic phase (mM)
(i) (ii) (iii) (iv) (v) (vi)
50 0.2 1.2 1.62 5 -0.00035 1
60 0.2 1.2 1.83 5 -0.00035 1
(i) solid porosity; (ii) tortuosity parameter;
(iii) Internal mass transfer coefficient;
(iv) Hydraulic diameter of the porous contained in the solid (v) (vi) Parameter from Equation 14.
Mathematical Simulation of Massive Liposome Formation
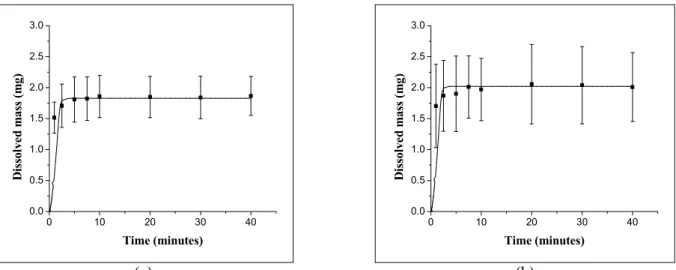
The liposome production model and the estimated parameters allowed the mathematical simulation of massive liposome production and the comparison with experimental data, as shown in Figure 6. The kinetic experimental data for dissolved lipid mass were obtained considering a calibration curve of absorbance at 340 nm versus total lipid concentration in aqueous media. The absorbance at 340 nm is proportional to the diameter and concentration of vesicles in the aqueous dispersion. The mean hydrodynamic diameter of the produced liposomes was 280r29 nm.
The results show that the model fits well the experimental data at the final hydration time, when all liposomes were formed. The deviations of the model at the initial hydration time are due to the variation of liposome diameter, which were not considered in the simulation at the initial instants
of hydration.
Figure 7 shows the model prediction for the penetrated and dissolved lengths profiles.
The similarity between the Lp and Ld profiles indicate that the lipid dissolution occurs in a fast way with no significant wet length. This behavior can be associated with the high capacity of hydration that these lipids present, due to the low phase transition temperatures (lower than the room temperature).
In addition, the model predicted the lipid film thickness adsorbed inside the capillary tube. This thickness corresponds to the maximum value achieved by Lp and Ld in the simulated profiles (Figure 7) and can be compared to the experimental thickness. The simulated values of the lipid film thickness are presented in Table 4.
0 10 20 30 40 0.0
0.5 1.0 1.5 2.0 2.5 3.0
D
isso
lv
ed
m
a
ss (m
g
)
Time (minutes)
(a)
0 10 20 30 40
0.0 0.5 1.0 1.5 2.0 2.5 3.0
D
isso
lv
ed
m
a
ss (m
g
)
Time (minutes)
(b)
Figure 6: Comparison between experimental data ( Ŷ ) and mathematical simulation (straight line) of massive liposome formation in two cases: Total lipid concentration in the alcoholic dispersions of lipids used for
adsorption (a) 50 and (b) 60 mM. Standard deviation refers to n=3.
0 10 20 30 40
0,0 0,1 0,2 0,3 0,4 0,5 0,6 0,7
Le
n
g
th
(
P
m)
Time (minutes)
(a)
0 10 20 30 40
0.0 0.1 0.2 0.3 0.4 0.5 0.6 0.7
Le
n
g
th
(
P
m)
Time (minutes)
(b)
Figure 7: Penetrated (Lp, ņņ) and dissolved (Ld, ---- ) lenghts profile for the total lipid concentration in the alcoholic phase of (a) 50 and (b) 60 mM.
Table 3: Simulated lipid film thickness obtained by the proposed model.
Total lipid concentration in the alcoholic phase (mM)
Lipid film thickness (Pm)
50 0.59 60 0.65
CONCLUSIONS
The proposed mathematical model described the kinetic of massive liposome production from a dried film of lipids adsorbed at the inner walls of a capillary tube. In addition, the model was validated by comparison between the predicted and experimental thickness of the lipid film. The model can also be extended to the design of a scaled up multitubular system for a required liposome production.
ACKNOWLEDGEMENTS
The authors are grateful to FAPESP for the financial support of this work.
NOMENCLATURE
aPL Lipid cross-sectional area
Cs Concentration of the specie in the liquid layer near the solid surface
Cv Vesicle concentration
dH Hydraulic diameter of the porous contained in the solid
DH Liposome average hydrodynamic diameter DOPE
1,2-dioleoyl-sn-Glycer-3-Phosphoethanlamine
DOTAP 1,2-Dioleoyl-3-Trimethylammonium-Propane, Chloride salt
EPC L-D-Phosphatidylcoline K penetration constant kd mass transfer coefficient
Kt parameter of the kinetic model for vesicles concentration
Kt’ parameter of the kinetic model for vesicles concentration;
Kv Reaction rate for the vesicle production
l Liposome shell thickness
L Length of penetration of the liquid in the capillary at time t
Ld Lipids dissolution length Lp Liquid penetration length
m Parameter that may vary from 1 (early time of penetration) to 0 (penetration is
completed)
M Total mass of lipids
N The total number of lipid molecules per liposome
Sext External area that is calculated by Equation 6 S0 external total surface (solid + void) t Time
V I- Vacuum indicator
Greek Letters
V surface tension of the liquid
T solid-liquid contact angle
W tortuosity parameter
K liquid viscosity
H solid porosity
U solid specific mass
REFERENCES
Bangham, A.D., Standish, M.M., Watkins, J.C.; Diffusion of univalent ions across lamellae of swollen phospholipids, J. Mol. Biol., 13, 238 (1965).
Carneiro, A.L.; Santana, M.H.A. Production of liposomes in a multiubular system useful for scaling-up of processes. Progress in Colloid and Polymer Science, v. 108, 273, 2004.
Elkhyat, A.; Courderot-Masuyer, C.; Gharbi, T.; Humbert, P.; Influence of the hydrophobic and hydrophilic characteristics of sliding and slider surfaces on friction coefficient: in vivo human skin friction comparison. Skin Research and Technology, 10, 215-221 (2004).
Israelachvili, J.N.; Mitchell, D.J. M. A model for the packing of lipids in bilayer membranes. Biochimica et Biophysica Acta, 389, 13-19 (1975).
Kikuchi, H., Yamauchi, H., Hirota, S.; Chemistry and Physics of Lipids; 39, 3-18 (1991).
Lasic, D.L.; Liposomes: from Physics to Applications; Elsevier, Amsterdam (1993)
Lasic, D.L.; Liposomes in Gene Delivery; CRC Press, Boca Raton (1997).
Mortha, G., Masson, N., Deperraz, P., The derivation of a mathematical model based on physics in order to describe tablet wetting and disintegration, The Pharmaceutical Technology Conference, 264-285 (1993).
Perry, J.H.; Perry's Chemical Engineers' Handbook, 7th Edition, New York, McGraw-Hill (1997). Sheu, H.M., Chao, S.C., Wong, T.W., Lee, J. Y.Y.,
Tsai, J.C., Human skin surface lipid flim: an ultrastructural study and interaction with corneocytes and intercellular lipid lamellae of the stratum corneum. British Journal of Dermatology, 140, 385-391 (1999).
Tournier, H., Schneider, M., Guillot, C., Liposomes with enhanced entrapment capacity and their use in imaging; United States Patent, no. 5.980.937 (1999). Washburn, E.W.; The Dynamics of Capillary Flow;