ISSN 1517-7076 artigo 11567, pp.377-381, 2014
Corresponding Author: Ting Chen Received on: 07/08/14 Accepted on: 24/11/14
Modeling the nanofiber fabrication with
the melt blowing annular die
Li-Li Wu 1, 2, Dong-Hui Huang 1 Ting Chen 1
1
College of Textile and Clothing Engineering, National Engineering Laboratory for Modern Silk – Soochow University
– 1 Shizi Street – 215006, Suzhou, China
2 Jiangsu Sunshine Group – Sunshine Industry Park – Xinqiao Town – 214426, Jiangyin, China e-mail: [email protected]
ABSTRACT
Melt blowing is commonly used to convert polymer resin directly into nonwoven fabrics of superfine fibers. Further decrease of the fiber diameter will improve the filtration and adsorption properties remarkably and thus has been appealing to the researchers. Besides the dual slot die, the annular die is utilized to manufacture superfine fibers in the melt blowing process as well. In the dual slot die, the high velocity air flow from both sides of the polymer melt. However, the air encircles the polymer melt entirely in the annular die, which is in favor of the polymer drawing and thus manufacture of nanofibers. In this paper, the air flow field model of the annular die is established and solved numerically. The polymer drawing with the melt blowing annular die is modeled and simulated by introducing the simulation results of the air flow field. The predicted fiber diameters coincide with the experimental data. Effects of the polymer flow rate and initial air velocity on the fiber diameter are also explored. The results show good perspective of using melt blowing technology to manufacture nanofibers materials because melt blowing has a higher output than electrospinning.
Keywords: melt blowing; annular die; nanofiber; model.
1. INTRODUCTION
Melt blowing is commonly used to convert polymer resin directly into nonwoven fabrics of superfine fibers. In this process, high velocity hot air impacts upon the polymer melt extruded from a spinneret and the polymer melt is then quickly drawn into superfine fibers. Further decrease of the fiber diameter will improve the filtration and adsorption properties remarkably and thus has been appealing to the researchers. Besides the dual slot die, the annular die shown in Figure 1 is utilized to manufacture superfine fibers in the melt blowing process as well. In the case of the dual slot die, the high velocity air flows from both sides of the polymer melt. However, the air encircles the polymer melt entirely in the case of the annular die, which is in favor of the polymer drawing and thus manufacture of nanofibers. Because nanofibers have excellent filtration and adsorption properties and melt blowing has a higher output than electrospinning, melt blowing has good perspective in the manufacture of nanofibers. The fiber diameter of nonwoven fabrics is affected by the air flow field produced by the die. In our previous paper [1, 2], the polymer drawing model based on the numerical simulation results of the air flow field in the melt blowing process was established. The predicted fiber diameters agreed well with the measured results. However, our previous researches mainly focused on the air flow field produced by the dual slot dies (both blunt and inset) [1, 2]. In this paper, the air flow field model of the annular die will be established and solved numerically. The polymer drawing with the melt blowing annular die will be modeled and simulated by introducing the simulation results of the air flow field. Effects of the polymer flow rate and initial air velocity on the fiber diameter will also be studied.
2. AIR JET FLOW FIELD MODEL
378 Figure 1: Annular die of melt blowing process
At first, the standard k- model is used for simulation. Constants of the standard k- model are C = 0.09, C1 = 1.44, C2 = 1.92. Turbulent Prandtl numbers are as follows: t = 0.85, k = 1.0, = 1.3, where t, k, and are Prandtl numbers of turbulence, of turbulent kinetic energy and of turbulent dissipation rate. However, it is found that the standard k- model yields poor simulations because of the complicated air flow field. So the k- model of revised constants is utilized for simulation. During the simulations, it is found that the simulation results are very sensitive to C and the turbulent viscosity t is very small in a region just below the die. Trial calculations show that 0.025 of C in the near region and 0.09 of Cout of this region are appropriate.
The boundary conditions are as follows.
Because the air flow field is symmetrical along the system centerline (x-axis), half of the plane is selected as the simulation area. The upstream boundary is on the nosepiece of the die. The downstream boundary is assumed to be far enough from the die. The boundaries far enough from the system centerline are the outer boundaries in y direction. The boundary conditions are given below.
(1) The conditions of upstream sections without inlet are: 0
a
u va 0 0
x a
0
a
k a 0
where ua is the x-component of air velocity, va is the y-component of air velocity, a is the air temperature, ka is the turbulent kinetic energy of air, a is the turbulent dissipation rate of air.
The conditions of upstream sections with inlet are:
0 j
u
ua va vj0 a j0
2 0 j 2 0 j 06 .0 u v
ka
e v u a 3 0 j 3 0 j 06 . 0
where uj0 is the x-component of initial air velocity, vj0 is the y-component of initial air velocity, j0 is the
initial air temperature.
(2) Downstream section:
0 x x k x x
ua a a a v a = 0 (3) Centerline condition:
0 y y k y y
ua a a a va = 0
(4) Outer boundaries:
ua = ka = a = 0 a = am 0
y va
379
The computational domain is a rectangle where the coordinate origin is at the center of the die head. The x direction is along the system centerline. The length (x-direction) and width (y-direction) of the computational domain are 200 mm and 80 mm, respectively. There are 200 grids in x direction and 150 grids in y direction.
The melt blowing nonwoven equipment with the annular die in Shanghai JR Filtration Materials Corporation Limited is employed in this research. The die parameters are as follows. The outside diameter, h, is 2.40 mm. The inside diameter, f, is 1.28 mm. The die length, l, is 28 mm. The initial air velocity is 400 m/s. The initial air temperature is 350°C.
The velocity vectors of the air flow field are shown in Figure 2. It can be seen that the air velocity in the annular exit is very large and the air flow direction parallels the annular exit on the whole. Then the air streams converge along the system centerline and reach its maximum. With the increase of the distance along the x-axis, the air velocity decreases gradually.
Figure 2: Velocity vectors of the air flow field
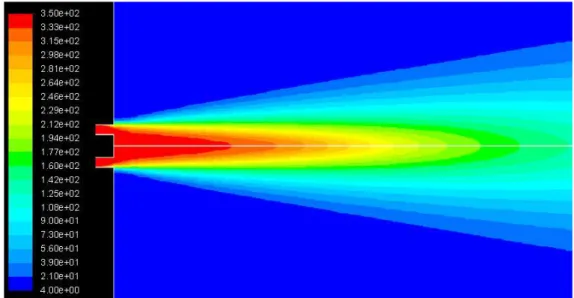
Figure 3 gives the temperature contours of the air flow field. It can be found from the figure that there is a region of high air temperature just near the die, which is in favor of the polymer drawing. The maximum temperature can be seen on the annular die. The air temperature decreases along the x-axis similar with the evolution of the air velocity.
380
3. SIMULATION OF THE POLYMER DRAWING
The polymer drawing model in the melt blowing process established in our previous paper [1] is employed to predict the fiber diameter of melt blown nonwoven fabrics produced by the annular die. The numerical simulations of the air flow field give the distribution of the x-component of air velocity ua and air temperature a along the x-axis. The polymer drawing model is solved using the Runge-Kutta method. The spinneret whole diameter is 0.35 mm. The polymer used is polypropylene with the melt flow rate of 1200 g/10 min. The initial polymer temperature is 320°C. The initial air temperature is 350°C. Effects of the polymer flow rate and initial air velocity on the fiber diameter are also studied. The polymer flow rates are 0.0005, 0.0010 and 0.0015 g/s. The initial air velocities are 300, 400 and 500 m/s. The image analysis method is employed to measure the fiber diameter. Nonwoven images are acquired using a XTL-1 video frequency microscope. Please find details of the diameter measurement in our previous research [3]. Diameters of one hundred fibers are measured and averaged to obtain the mean fiber diameter of the nonwoven sample.
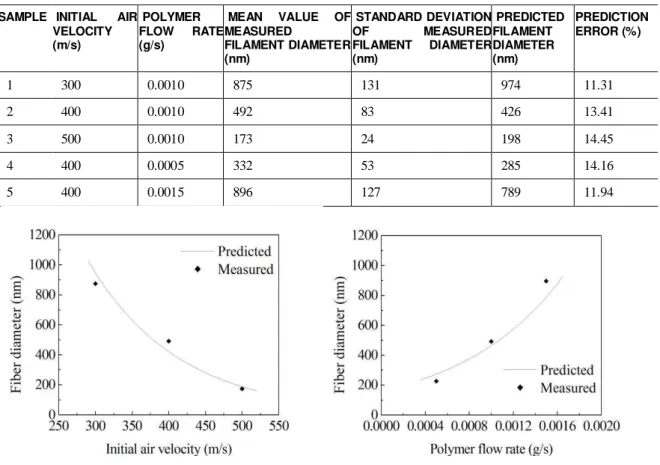
The varied processing parameters, mean values and standard deviations of measured fi ber diameters, predicted fiber diameters and prediction errors are shown in Table 1. From Table 1, it can be found that Sample 3 has the maximum prediction error of 14.45% and Sample 1 has the minimum prediction error of 11.31%. The mean prediction error is 13.05% indicating that the predicted fiber diameters fit with the measured fiber diameter, which proves the effectiveness of the polymer drawing model in predicting fiber diameters produced by the melt blowing annular die.
Table 1: Varied processing parameters, measured and predicted fiber diameters.
SAMPLE INITIAL AIR VELOCITY (m/s)
POLYMER
FLOW RATE
(g/s)
MEAN VALUE OF MEASURED
FILAMENT DIAMETER (nm)
STANDARD DEVIATION
OF MEASURED
FILAMENT DIAMETER (nm)
PREDICTED FILAMENT DIAMETER (nm)
PREDICTION ERROR (%)
1 300 0.0010 875 131 974 11.31
2 400 0.0010 492 83 426 13.41
3 500 0.0010 173 24 198 14.45
4 400 0.0005 332 53 285 14.16
5 400 0.0015 896 127 789 11.94
Figure 4: Effects of the initial air velocity Figure 5: Effects of the polymer flow rate
381
rate (0.0015 g/s). To achieve a higher output of nanofibers, the technology combination of a larger initial air velocity with a larger polymer flow rate will be preferred in practical productions. The predicted fiber diameters are also given in Figure 4 and Figure 5. Both figures show that the predicted diameters tally well with the measured diameters, which confirms the effectiveness of the polymer drawing model for predicting the nanofiber fabrication with the melt blowing annular die. By the use of this model, the fabrication technology of nanofiber with the annular die can optimized and thus achieved finer nanofibers. This will be our future research subject.
4. CONCLUSIONS
The annular die is utilized to manufacture nanofibers in the melt blowing process. The air flow field model of the annular die is established and solved numerically. Simulation results show the distributions of air velocity and air temperature are in favor of the polymer drawing. Then the polymer drawing with the melt blowing annular die is modeled and simulated by introducing the simulation results of the air flow field. The fiber diameters of nonwoven fabrics are measured with an image analysis technique. Model predictions of fiber diameters are compared with the measured fiber diameters. The mean prediction error is 13.05% indicating that the predicted fiber diameters fit with the measured fiber diameter. Effects of the polymer flow rate and initial air velocity on the fiber diameter are explored. It is found that both larger initial air velocity and smaller polymer flow rate can produce finer nanofibers. But to achieve a higher output of nanofibers, combination of a larger initial air velocity with a larger polymer flow rate will be the preferred technology. The results show good perspective of using melt blowing technology to manufacture nanofibers and the established model can be employed to optimize the fabrication technology of nanofiber with the melt blowing annular die.
5. ACKNOWLEDGMENTS
This work is supported by the National Natural Science Foundation of China under Grant No. 51303121, Specialized Research Fund for the Doctoral Program of Higher Education under Grant No. 20123201120015, Project for Jiangsu Scientific and Technological Innovation Team (2013) and Priority Academic Program Development of Jiangsu Higher Education Institute.
6. BIBLIOGRAPHY
[1] CHEN, T., ZHANG, C., CHEN, X., et al., “Numerical computation of the fiber diameter of melt blown nonwovens produced by the inset die”, Journa l of Applied Polymer Science, v. 111, n. 4, pp. 1775-1779, Feb. 2009.
[2] WU, L.L., CHEN, T., “Effect of oscillating air jets on polymer drawing in the melt blowing process”, Hea t Transfer Resea rch, v. 44, n. 5, pp. 483-492, Jun. 2013.