DO:
D 10.1590/S1516-14392011005000070
*e-mail: [email protected]
Sulfonated Polyaniline: Influence of Sulfonation Routes on its
Thermal and Structural Characteristics
Luis Claudio Mendesa,*, Ana Paula Santiago Falcob, Magali Silveira Pinhob, Priscila Oliveira Marquesa
a
Instituto de Macromoléculas Professora Eloisa Mano-IMA,
Centro de Tecnologia, Universidade Federal do Rio de Janeiro – UFRJ,
Av. Horácio Macedo, 2030, Bloco J, CP 68525, CEP 21941-598, Rio de Janeiro, RJ, Brazil
b
Instituto Pesquisa da Marinha – IPqM, Ilha do Governador, Rio de Janeiro, RJ, Brazil
Received: November 26, 2010; Revised: August 1, 2011
In order to study the inluence of different sulfonation routes on its thermal and structural properties sulfonated polyaniline (SPAni) was prepared. FT-IR revealed that the formation of PAni salt or ring sulfonation depends on the route. UV-visible spectra pointed out that the level of the PAni protonation was dependent on the sulfonation route. A new approach was given for TG/DTG and DSC results correlating different energy levels with the distinguished sulfonation routes. The TG/DTG degradation steps and the amount of the released material corroborated the structural differences of the polyanilines. For each DSC irst regime of heating, a broad and intense peak (from –30 to 250 °C) with different level of energy was noticed. That peak could be ascribed to the multiple relaxations and breaking of the PAni intra and inter hydrogen bonds after sulfonation.
Keywords: SPAni, TG/DTG, DSC, FT-IR, UV-vis
1. Introduction
Target polymer materials have been receiving extensive research due to their unique physical properties and potential applications in micro/nanoelectronics, electromagnetics and biomedical devices. Among these polymers, a great number of researches have been addressed to polyaniline (PAni). Similar to metals, it owns unusual electronic, magnetic, electrochemical and optical properties jointly with high environmental stability, easy polymerization and low cost of monomer. However, its processability by melting is not practical since the polymer decomposes at temperatures below its softening or melting point1-4. Basically, in the previous published articles, the presence, absence and type of dopant agent besides the thermal treatment on its behavior have been highlighted. Due to its cation exchange properties, voltammetric analysis of metals in water was performed by Fungaro5 using sulfonated polyaniline coated mercury ilm electrodes. As PAni is considered a material with poor mechanical properties, Lenz et al.6 prepared its blend with low density polyethylene (LDPE) in order to match the unusual conductive characteristics and the remarkable mechanical resistance intrinsic of each polymer. In recent study, MacDiarmid and collaborators7 showed that conductometric devices integrated with HCl-doped PAni nanoibers and subject to different thermal treatments could exhibit different transduction behaviors when exposed to 1% hydrogen
carried by nitrogen. According to them, the controversy in hydrogen
storage studies, involving conducting polymers, may be related to the ambiguous thermal treatments on HCl-treated PAni samples. In their investigation on PAA/PAni blends, Chen and co-authors8 registered the drop of PAni conductivity in the glass transition region correlating this behavior to its partial deprotonation. Microwave absorbing sheet was achieved by Folgueras et al.9 when blended doped polyaniline with silicone rubber. Thermal stability and glass transition temperature were found to be dependent on the type and amount of the inorganic nanoparticles in composites containing aluminium
oxide and multi-walled carbon nanotube10-12. PAni nanoibers doped with several inorganic/organic acids were synthesized by interfacial polymerization being the morphology, thermal stability and electrical conductivity dependent on the dopant chemical nature13. Dendrimers modiied polyaniline nanotubes as biosensor for detecting glucose at low voltage was prepared by Queiroz and his group14. This research deals with the sulfonation of PAni-EB at different time and temperature conditions. Structural changes due to the aromatic ring sulfonation and formation of the emeraldine salt were monitored by FT-IR, UV-vis., TG/DTG and DSC. The presence of sulfonic group as acid or ion, sulfonation degree, degradation steps, thermal stability and the correlation of DSC endothermic peak with level of sulfonation were assessed.
2. Experimental
2.1. Materials
Aniline was distilled twice under vacuum and stored in a refrigerator. Analytical grade chloridric acid [HCl] (37% - 10 M), ammonium peroxydisulfate [(NH4)2S2D8], ammonium hydroxide [NH4OH] (28% - 8 M), concentrated sulfuric acid [H2SO4] (98% - 10 M) and fuming sulfuric acid (SO3 content = 20%) were used without puriication.
2.2. PAni and sulfonated PAni syntheses
The PAni hydrochloride powder was synthesized by the oxidative polymerization of aniline in 1M aqueous HCl with (NH4)2S2D8 as
oxidant, as described in a previous work15. The powder was converted to PAni-EB (emeraldine base) by treatment with 0.3 M aqueous
NH4OH followed by drying under dynamic vacuum, until constant
In a glass lask, 40 mL of concentrated sulfuric acidwas cooled to 5 °C and 0.5 g of PAni-EB was added, kept for 15 minutes, under magnetic stirring. After that, the lask was removed from the cooled bath, heated to 100 °C and maintained under stirring, for 24 hours. In the next step, the resultant solution was slowly poured into a cooled methanol bath (10 °C) being the precipitate iltered and washed with distilled water until neutral pH. Finally, the solid was dried in vacuum oven, until constant weight. The same procedure was performed to sulfonate PAni-EB at 150 °C. The synthesis of sulfonated PAni with fuming sulfuric acid followed the above procedure with some alterations. The reactional temperature was kept at 25 °C and the reaction times were 1/2, 1 and 2 hours. The reaction products and their acronyms were arranged in Table 1.
2.3. Fourier-transform infrared spectroscopy (FTIR)
The effect of the sulfonation conditions on the PAni-EB were monitored with a Varian FT-IR spectrophotometer model Excalibur 3100, using KBr disk of each sample. The spectra were recorded from
4000 to 400 cm-1, with 20 scans at a resolution of 4 cm-1.
2.4. Ultraviolet and visible spectroscopy (UV-vis)
In order to check the effect of the sulfonic group on the PAni iminequinoid and benzenoid groups, a Varian UV-visible spectrophotometer, model Cary 100 was used. The dimetilformamide and ammonium hydroxide were the solvents for emeraldine base and sulfonated PAni, respectively. The UV-vis. spectra were recorded between 200-900 nm from solution concentration in the range of 0.005 to 0.01% (w/v).
2.5. Thermogravimetry/derivative thermogravimetry (TG/DTG)
Thermal stability of the PAni-EB and sulfonated PAni was conducted in a TA thermogravimetric analyser model Q500, in the range of 30-700 °C, at 10 °C /min, under nitrogen atmosphere. The onset temperature (Tonset), maximum degradation temperature (Tmax), end temperature (Tend) and residue content were determined.
2.6. Differential scanning calorimetry (DSC)
The calorimetric parameters were assessed using a TA calorimeter model Q1000. Three scans were performed. The irst scan was concerned with heating from –80 to 250 °C, at 10 °C /min, being the sample kept for two minutes at 250 °C in order to eliminate the thermal history; after that, the sample was cooled (2nd scan) from 250 to –80 °C, at 200 °C/min. Finally, the sample was re-heated (3rd) at the same protocol used for the irst scan.
3. Results and Discussion
3.1. Fourier-transform infrared spectroscopy (FTIR)
The FT-IR spectra of the PAni - emeraldine base (EB) - and polyaniline synthesized with both acids are arranged in Figure 1. In the PAni-EB spectrum, the region of 4000-3000 cm-1 showed poor resolution and the N-H and C-H stretching of the aminebenzenoid rings were not assigned with reliability. The characteristic bands around 1591 and 1500 cm-1 were ascribed to C=N and C=C stretching vibration of iminequinoid and benzenoid rings, respectively, also detected by Su et al.13,16. The C-N stretching vibration of aromatic secondary amines was pointed out at 1309 and 1253 cm-1, according to Colthup17. Similarly to mentioned by Chen et al.8, there is a peak
at 1147 cm-1 which was associated to the electronic-like absorption of N=Q=N where Q denotes the iminequinoid rings. The vibration bands situated around 829 and 507 cm-1 were attributed to the
benzenoid rings 1,4 disubstituted C-H and N-H out of plane bending, respectively. The FT-IR spectrum of SPAniF2 showed two bands around – 3390 and 3250 cm-1 - which, according to Colthup17 and Pretsch18, could be attributed to N-H stretching of the benzenoid rings and O-H stretching of the sulfonic acid group [O=S(=O)-OH]. Their assignment, as free or hydrogen bonds, is not easy to estabilish. For SPAniF½ and SPAniF1, those bands merged as a unique and broad band. It is interesting to notice that all PAni produced with fuming acid showed two very weak peaks around 2600 and 2500 cm-1 which could be emerged from intra and inter H-bonded between O=S(=O)-OH and amine groups17. In the spectral region of 2000-500 cm-1 the spectra resembled each other. All of them showed C=N and C=C sharp and deined bands around 1600 and 1500 cm-1 which could be assigned to the stretching of the benzenoid and iminequinoid rings, respectively, as reported by Lenz et al.6 in an article on blends of polyaniline synthesized with dodecil benzenesulfonic acid (DBSA) and camphorsulfonic acid (CSA). A band around of 1290 cm-1 and a shoulder in the vicinity of 1230 cm-1 were concerned with the stretching of the C-N bond16. The sulfonyl (O=S=O) asymmetric and symmetric stretching of the sulfonic group linked to the benzenoid
ring16 were detected around 1320 and 1178 cm-1. The sulfonic group as protonation agent (HSO4
-↔ OH-SO3- ion) showed the sulfonyl
asymmetric and symmetric stretching at 1170 and 1010 cm-1 while the S-O-H stretching appeared as a sharp and intense band around 850 cm-1 all of them associated to the emeraldine salt17. Meanwhile the band nearby of 820-830 cm-1 concerned with the C-H 1,4 disubstituted Table 1. Reaction products and their acronyms.
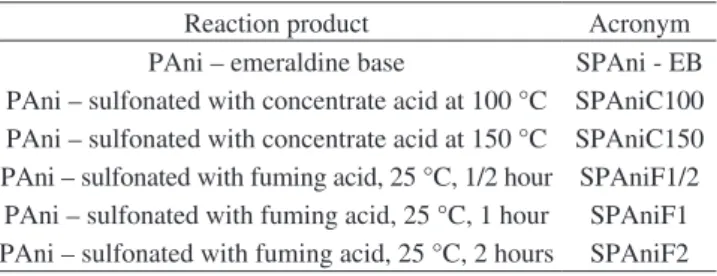
Reaction product Acronym
PAni – emeraldine base SPAni - EB
PAni – sulfonated with concentrate acid at 100 °C SPAniC100 PAni – sulfonated with concentrate acid at 150 °C SPAniC150 PAni – sulfonated with fuming acid, 25 °C, 1/2 hour SPAniF1/2 PAni – sulfonated with fuming acid, 25 °C, 1 hour SPAniF1 PAni – sulfonated with fuming acid, 25 °C, 2 hours SPAniF2
aromatic ring stretching decreased its intensity the vibrations at 887 cm-1 – C-S-OH stretching – and around 700 cm-1 – C-S stretching
- emerged on account of the ring sulfonation reaction17,19. Two strong, sharp and intense peaks around 615 and 576 cm-1 came out in the sulfonated polyanilines. Using Raman resonance spectroscopy, Temperini et al.20 detected these bands in redox process of polyaniline secondarily doped with camphorsulfonic but their attribution was not estabilished sharply. Herein, these bands could be ascribed to the formation of the emeraldine salt along the backbone of the PAni
chains and could be associated to additional vibrational modes of the
nitrogen-hydrogen and oxygen-hydrogen bonds of the sulfonic and amine groups. The IR spectrum of polyaniline yielded with 10 M
concentrated H2SO4 (SPAniC100) were similar to that of the PAni-EB but some absorptions were shifted. The band ascribed to the C=N vibration was shifted to higher wavenumber (1598 cm-1) while that of the C=C stretching was dislocated to lower wavenumber (1490 cm-1). The C-N vibrational mode appeared at lower wavenumbers (1303 and
1222 cm-1). The absorption of the iminequinoid rings (N=Q=N) was shifted to higher wavenumber (1153 cm-1). The vibration band
at 829 cm-1 remained indicating that the aromatic ring sulfonation did not occur. A new band was detected at 1024 cm-1 which was attributed to the vibrational mode of the sulfonyl group in its ionic form (HSO4
-↔ OH-SO3-). The shift of the PAni absorptions was
reported in a study on polyaniline nanoibers doped with acids13 such as HAc, HClO4, H3PO4 and HCl. It might conclude that the
unsuccessful attempt of sulfonating PAni-EB with 10M concentrated
H2SO4 could be correlated with a probable reversibility of the
reaction. The activation energy for the ring desulfonation could be lower than its sulfonation due to the extreme reactional conditions21. Nevertheless, the new band at 1028 cm-1 indicated that the emeraldine salt was achieved.
3.2. Ultraviolet and visible spectroscopy (UV-vis)
Figure 2 shows the UV-vis spectra of the PAni-EB and those yielded with both acids. There are two well sharp and deined absorption peaks around 323 and 610 nm in the PAni-EB UV-visible spectrum which were ascribed to the π–π* transition of the aminebenzenoid rings and the exciton absorption of the iminequinoid rings, respectively. It is expected that when the imine groups are doped by acids they are protonated; the nitrogen atom and its neighboring
iminequinoid ring become a semiquinoid radical cation and the
exciton absorption band intensity decreases. For fully protonated imine groups, the exciton absorption band of the PAni tends to disappear8. It can be noticed that in the spectrum of our PAni yielded at 100 °C both absorptions shifted to lower wavenumbers which means that both the aminic and iminic nitrogens would be protonated. The acid dopant action seems to be greater in the PAni synthesized at 150 °C since the exciton absorption band effectively vanished while that one attributed to the aminebenzenoid rings seems to be decreasing its intensity. The spectra of the PAni prepared with fuming acid showed the same features. As the reaction time increased the absorption peaks moved towards lower wavenumbers. For the highest time, the exciton absorption peak practically disappeared. All PAni yielded with both acids showed a band around 280 nm which could be correlated with the partial formation of the oxidized PAni base – pernigraniline – reported by Kang et al.22 using NMP as solvent. The results were corroborated by those found in FT-IR section.
3.3. Differential scanning calorymetry (DSC)
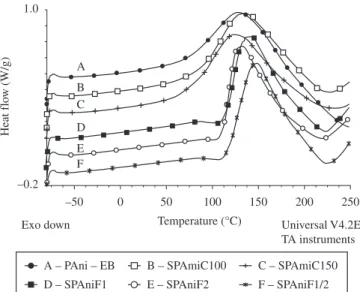
The DSC curves of the PAni-EB and those synthesized with both acids are arranged in Figure 3. Those yielded with concentrated acid showed the similar pattern to that of the PAni-EB and it is in
Figure 2. PAni-EB and PAni synthesized with both acids UV-Vis. Spectra.
Figure 3. PAni-EB and PAni synthesized with both acids DSC curves.
a transition immediately preceding the glass transition temperature (Tg) was reported. They guessed that its origin is correlated with a particular water/NMP composition, but its nature is still unknown. We could conjecture that the broad peak observed in all DSC curves is considered to be polyanilne Tg and some sub-Tg transitions. For comparing, the peak area of each calorimetric curve was calculated
in order to evaluate the effect of the sulfonation routes on the thermal
behavior of each sample (Table 2). Pani-EB exhibited the highest value of energy. Besides the Tg and sub-Tg transitions, in this amount
of energy, could be included that necessary to breaking the intra and inter hydrogen bond between the aminic and iminic nitrogens during the irst regime of heating. For polyalnilines synthesized with concentrated acid, the energy dropped on account of the emeraldine
salt decreased the amount of iminic nitrogens available to lead intra
and inter hydrogen bonds along the PAni backbone. The lowest energy values were noticed for polyanilines prepared with fuming acid. This behavior could be taken into consideration the combined
decreasing effect of the free iminic nitrogens and the steric hindrance
of the sulfonic group attached to the aminebenzenoid rings. Both playing together could release the segmental mobility of the molecules through the increasing of the free volume among the polymer chains. For all samples, the second regime of heating did not show any change of the DSC baseline which could relect the chains crosslinking during the heating process as approached by Espe et al.24 in their article on the effect of elevated temperature on the reactivity and structure of polyaniline. The results are in agreement with those found in the
structural analyses.
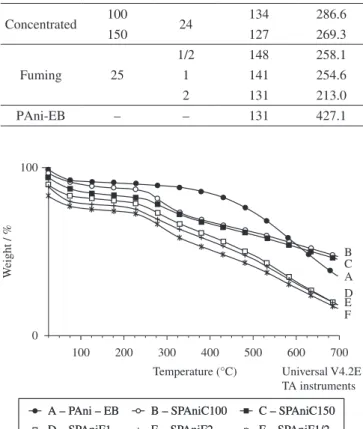
3.4. Thermogravimetry/derivative thermogravimetry (TG/DTG)
Figures 4 and 5 show the TG and DTG curves of the undoped and polyanilines obtained by acids. In Table 3 are arranged the onset temperature (Tonset), maximum degradation temperature (Tmax), end temperature (Tend), residue content for all samples. The undoped PAni TG/DTG curves showed that its loss of mass happened in two steps. The irst one occurred before 100 °C concerning the release of water (8%). The second one started around 440 °C, reached a maximum at 586 °C and burned continuously until 700 °C representing the degradation of the polymer backbone (56%). A coal (36%) remained which needs further heating to burn completely. Regarding the TG/DTG curves of the polyanilines synthesized with concentrated acid, they presented similar patterns and three degradation steps as was reported by Ansari and collaborators1. That step below 100 °C was related to the loss of water (9 and 11%). The intermediate one was located between 250 and 400 °C with maximum around 290 °C which might be associated to the sulfonic groups release (19 and 16%) of the emeraldine salt and PAni low molar mass. Around 400 °C, the curve dropped progressively with temperature until 700 °C which was regarded as the degradation of the PAni backbone (22%). At the end, a residue (50%), which consists of coal and sulfate ion, was left. The polyanilines synthesized with fuming acid also exhibited TG/DTG curves similar to each other and three decays of degradation, although different from those obtained by concentrated acid. There is a peak below 100 °C which was also attributed to the release of water (≈10% for all). The second peak, started around 240 °C, reached a maximum at 280 °C and ended around 400 °C. That decay might be also correlated with the loss of the sulfonic group attached to the aminebenzenoid ring, the sulfonic ion of the emeraldine salt and PAni molar mass which percentages were 24, 20 and 19% for sulfonation time of ½, 1 and 2 hours, respectively. It is interesting to notice that the content of sulfonic group has been decreasing as the reaction time increased. This could be attributed to the changes of the planarity (aromatic ring sulfonation) and the conformation of the PAni chains
Table 2. Polyanilines peak temperature and area.
Reactional condition Peak
temperature (ºC)
Peak
area
(J.g–1)
H2SO4 Reaction
temperature (ºC)
Reaction time
(h)
Concentrated 100 24 134 286.6
150 127 269.3
Fuming 25
1/2 148 258.1
1 141 254.6
2 131 213.0
PAni-EB – – 131 427.1
A – PAni – EB B – SPAniC100 C – SPAniC150
D – SPAniF1 E – SPAniF2 F – SPAniF1/2
Figure 4. PAni-EB and PAni synthesized with both acids TG curves.
Table 3. Polyanilines thermal parameters.
Reactional condition Tonset (°C) Tmax (°C) Tend
(°C)
Residue
(%)
H2SO4 Reaction
temperature (°C)
Reaction
time (h)
Step Step
1st 2nd 3rd 1st 2nd 3rd
Concentrated 100 24 30 255 425 45 286 – 700 50
150 30 255 425 56 293 552 700 51
Fuming 25
1/2 30 239 425 43 285 564 700 33
1 30 238 400 44 279 560 700 29
2 30 225 400 45 277 556 700 30
PAni-EB – – 30 449 – 46 586 – 700 36
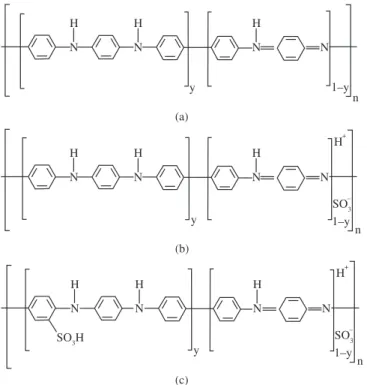
Figure 6. Schematic representation of the suggested structure for: a) PAni-EB; b) protonated PAni; and c) protonated and sulfonated PAni.
time increased. The losses concerning the polymer backbone were 34, 41 and 38% according to the increase of the sulfonation time. The amount of residue was 33, 29 and 30% and followed the duration of the sulfonation. The percentage polymer backbone degradation and residue of the synthesized polyaniline with fuming acid was lower than that of the parent PAni. It could suggest that for PAni synthesized with the acids the intermediate degradation step comprises both the release of the sulfonic group and the degradation of some PAni low molar mass. Then, the thermal analysis was itted for conirming structural changes of the PAni using distinguished sulfonation routes.
The results indicated that the concentrated acid mainly played a role as protonating agent of the imine groups of the PAni. Additionally, the fuming acid also acted as a sulfonating agent of the amine groups. The suggested structures are showed in Figure 6.
4. Conclusions
A systematic study of sulfonation of PAni was performed with concentrated and fuming sulfuric acid. The type of acid and reaction routes regulated the changes along the PAni chains. FT-IR and
UV-Visible analyses showed that both acids were able to form salt of PAni. The benzene ring sulfonation was only achieved with fuming acid. On account of the amount of sulfonic groups as a salt and/or as a group attached to the amine ring the intra and intermolecular hydrogen bonds between aminic and iminic nitrogens decreased leading to the drop of the energy at the glass transition region and different degradation steps.
Ackcknowledgements
The authors thank Conselho Nacional de Desenvolvimento Científico e Tecnológico (CNPq), Fundação Coordenação do Aperfeiçoamento de Pessoal de Nível Superior (CAPES) and Universidade Federal do Rio de Janeiro (UFRJ) for supporting this
investigation.
References
1. Ansari R and Keivani MB. Polyaniline conducting electroactive polymers: thermal and environmental stability studies. E-Journal of Chemistry. 2006; 3:202-217.
2. Li GC and Zhang ZK. Synthesis of dendritic polyaniline nanoibers in a surfactant gel. Macromolecules. 2004; 37:2683-2685. http://dx.doi. org/10.1021/ma035891k
3. Wang Y, Liu ZM, Han BX, Sun ZY and Yang GY. Facile synthesis of polyaniline nanoibers using chloroaurate acid as the oxidant. Langmuir. 2005; 21:833-836. http://dx.doi.org/10.1021/la047442z
4. Dustyn DS, Randy MV, Russel AL and Alan RH. Interfacial polymerization of polyaniline nanoibers grafted to Au surfaces. Chemistry of Materials. 2004; 16:1606-1608. http://dx.doi.org/10.1021/cm0352908
5. Fungaro DA. Sulfonated polyaniline coated mercury ilm electrodes for voltammetric analysis of metals in water. Sensors. 2001;1:206-214. http://
dx.doi.org/10.3390/s10600206
6. Cardoso MJR, Lima MFS and Lenz DM. Polyaniline synthesized with functionalized sulfonic acids for blends manufacture. Materials Research. 2007; 10:425-429. http://dx.doi.org/10.1590/S1516-14392007000400017 7. Wang P-C, Dan Y, Somers LA, MacDiarmid AG and Johnson ATC. Effect
of thermal treatments on the transduction behaviors of conductometric hydrogen gas sensors integrated with HCl-doped polyaniline nanoibers.
Materials Research Society Symposium Proceedings. 2008; 1042:S06-06. 8. Chen S-A and Lee H-T. Structure and properties of poly(acry1ic acid)-doped Polyaniline. Macromolecules. 1995; 28:2858-2866. http://dx.doi.
org/10.1021/ma00112a035
9. Folgueras LC, Alves MA and Rezende MC. Dielectric properties of microwave absorbing sheets produced with silicone and polyaniline.
Materials Research. 2010; 13:197-201. http://dx.doi.org/10.1590/S1516-14392010000200013
17. Colthup NB, Daly LH and Wiberley SE. Introduction to Infrared and Raman Spectroscopy. New York: Academic Press; 1975.
18. Prestch E, Buhlmann P and Affolter C. Structure Determination of Organic Compounds. Berlin: Spring-Verlag; 2000.
19. Silvertein RM and Webster FX. Spectroscopy of Organic Compounds. New York: John Wiley; 1998.
20. Silva JEP, Torresi SIC and Temperini ML. Redox behavior of crosslinked polyaniline ilms. Journal of the Brazilian Chemical Society. 2000; 11:91-94. http://dx.doi.org/10.1590/S0103-50532000000100016 21. Allinger NL, Cava MP, Jongh DC, Johnson CR, Lebel NA and Stevens
CL. Química Orgânica. Rio de Janeiro: LTC; 1976.
22. Kang ET, Neoh KG and Tan KL. Poplyaniline: a polymer with many interesting intrinsic redox states. Progress in Polymer Science. 1998; 23:211-324. http://dx.doi.org/10.1016/S0079-6700(97)00030-0 23. Rodrigues PC, Souza GP, Motta Neto JD and Akcelrud. Thermal treatment
and dynamic mechanical thermal properties of polyaniline. Polymer. 2002; 43:5493-5499. http://dx.doi.org/10.1016/S0032-3861(02)00401-9 24. Mathew R, Yang D, Mattes BR and Espe MP. Effect of elevated temperature
on the reactivity and structure of polyaniline. Macromolecules.2002; 35:7575-7581. http://dx.doi.org/10.1021/ma020876l
Analysis and Calorimetry. 2008; 94:553-557. http://dx.doi.org/10.1007/ s10973-007-8626-2
11. Qi Y-N., Xu F and Sun L-X. Thermal stability and glass transition behavior of Pani/MWNT composites. Journal of Thermal Analysis and Calorimetry. 2008; 94:137-141. http://dx.doi.org/10.1007/s10973-008-8978-2
12. Qi Y-N, Xu F, Ma H-J, Sun L-X, Zhang J and Jiang T. Thermal stability and glass transition behavior of Pani/γ-Al2D3 composites. Journal of Thermal Analysis and Calorimetry. 2008; 91:219-223. http://dx.doi.org/10.1007/ s10973-006-8298-3
13. Sun B, Tong Y, Bai J, Lei Z, Wang K, Mu H et al. Acid doped polyaniline nanoibers synthesized by interfacial polymerization. Indian Journal of Chemistry. 2007; 46A:595-500.
14. Santos AN, Soares DAW and Queiroz AAA. Stable glucose detection at dendrimers modiied polyaniline nanotubes. Materials Research. 2010; 13:5-10. http://dx.doi.org/10.1590/S1516-14392010000100003 15. Pinho MS, Gorelova MM, Dezzoti M, Soares BG and Pertsin AJ.
Conductive polyaniline-polychloroprene blends. Journal of Applied Polymer Science. 1998; 70:1543-1549.