ABSTRACT: In this work we report numerical simulations of the contaminant dispersion and photochemical reactions of rocket exhaust clouds at the Centro de Lançamento de Alcântara (CLA) using the CMAQ modeling system. The simulations of carbon monoxide (CO), hydrogen chloride (HCl) and alumina (solid Al2O3) pollutants emission represent an effort in the construction of a computational tool in order to simulate normal and/or accidental events during rocket launches, making possible to predict the contaminant concentrations in accordance with emergency plans and pre and post-launchings for environmental management. The carbon monoxide and the alumina concentrations showed the formation of the ground and contrail cloud. The results also showed that hydrogen chloride concentrations would be harmful to human health, demonstrating the importance of assessing the impact of rocket launches in the environment and human health.
KEYWORDS:Centro de Lançamento de Alcântara, Rocket launch, CMAQ, Dispersion modeling.
Simulation of Rocket Exhaust Clouds at
the
Centro de Lançamento de Alcântara
Using the WRF-CMAQ Modeling System
Erick Giovani Sperandio Nascimento1, Davidson Martins Moreira2,3, Gilberto Fisch2,
Taciana Toledo de Almeida Albuquerque1
INTRODUCTION
An important and singular air pollution problem is related to rocket launches. he burning of rocket engines during the irst few seconds prior to and immediately after vehicle launchings results in the formation of a large cloud of hot, buoyant exhaust products near ground level, which subsequently rises and entrains ambient air until the temperature and density of the cloud reach an approximate equilibrium with ambient conditions. he United States’ space activities are conducted by military personel (Air Force) and civilians (NASA). he US Air Force has 2 rocket launching centers, being one at the east coast at Cape Canaveral Air Force Base (AFB), in Florida, and another one at the west part, at Vandenberg AFB, California. hese launching centers are close to big and populated region/cities which may be afected by the gases released during the launchings. In order to estimate the risks and environmental impacts associated to the launchings (either normal or failed ones), a special model named Rocket Exhaust Eluent Difusion Model (REEDM) was developed by Bjorklund et al. (1982). his model assumes a constant wind proile and Gaussian plume turbulence to access the movement of the clouds derived from the exhausted gases. According to Nappo and Essa (2001), despite the fact that the REEDM model was operationally used for a long time (since the 1980s), it may not be fully checked using ield data collected over the US launching centers. During the period from 1995 up to 1997, a Model Validation Program (MVP) was established to address these concerns and several ield experiments with special tracers made at Cape Canaveral AFB and Vandenberg AFB. Furthermore, regarding the numerical simulations for the prediction of rocket exhaust low ields, we can cite the works of Reis et al. (1970) and Rao et al. (2001).
1.Universidade Federal do Espírito Santo– Vitoria/ES – Brazil 2.Instituto de Aeronáutica e Espaço– São José dos Campos/SP – Brazil 3. Centro Integrado de Manufatura e Tecnologia – Salvador/BA – Brazil
Author for correspondence: Davidson Martins Moreira | Instituto de Aeronáutica e Espaço | Praça Marechal Eduardo Gomes, 50, São José dos Campos/SP | CEP: 12.228-901 | Brazil | Email: [email protected]
Centro de Lançamento de Alcântara
Alcântara
Raposa
São Luís
São José de Ribamar D04
Centro de Lançamento de Alcântara
Alcântara
Raposa
São Luís
São José de Ribamar D04
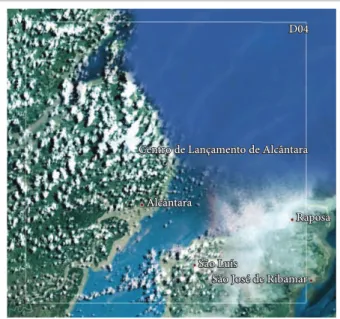
Figure 1. The location of the domain used in CMAQ to model the rocket launch case.
Unfortunately, there is no model fully ready to meet these demands in Brazil, or some experimental data dispersion of contaminants related to the Centro de Lançamento de Alcântara (CLA). herefore, researches are very important as well as the developing of a modeling system designed to calculate peak concentrations, dosage and deposition (resulting from both gravitational settling and precipitation scavenging), downwind from normal and aborted launchings, to be used in mission planning activities and environmental assessments, pre-launch forecasts of the environmental efects of launch operations and post-launch environmental analysis in the Brazilian site. To this end, this paper aims at providing a framework which will allow the development of a model that considers the Brazilian site’s characteristics. herefore, the main purpose of this study is to report a numerical study (numerical experiment) of the contaminant dispersion and photochemical reactions for the pollutants HCl, Al2SO3 and CO in CLA using the Community Multi-scale Air Quality (CMAQ) modeling system. he paper describes the main CMAQ changes needed to incorporate rocket launches in this modeling system. In fact, CMAQ is a multi-pollutant, multiscale air quality model that contains state-of-science techniques for simulating all atmospheric and land processes which afect the transport, transformation, and deposition of atmospheric pollutants and/or their precursors on both regional and urban scales (Byun e Ching, 1999). hese simulations represent an efort in the construction of a computational tool for normal and/or accidental events during rocket launches, making it possible to both predict and simulate the concentration needed, in accordance to emergency plans and pre and post-launchings for environmental management.
THE MODELING SYSTEM
he CMAQ model is a fully 3-dimensional modeling system consisting of three main components (meteorology, emissions and a chemical model) and various interfaces. herefore, with this modular structure, the CMAQ has enough lexibility to change other meteorological models and emissions modeling systems (Byun and Ching, 1999). It is important to mention that the CMAQ model is a state-of-the-art modeling tool in air quality problems.
SITE DESCRIPTION
he CLA is the space gate of Brazil and it is located at the North part of Brazil (2 degrees south), close to Equator (Fig. 1).
More information about the CLA, its topography and climate can be found at Pires et al. (2009).
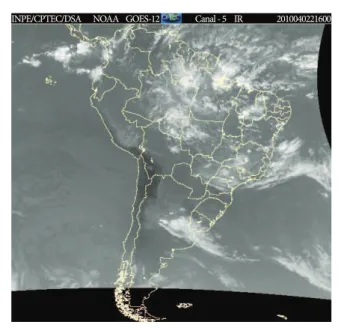
Climatologically, there is a very distinctive rainfall characteristic: a wet season from January up to June, with highest rainfall in March and April (monthly rainfall about 300 mm/mo) and a dry season from July up to December (rainfall almost null or very low – less than 30 mm/mo). he winds follow this climatic behavior presenting high wind speed during the dry season (winds around 7-8 m/s at 70 m height) and a moderate winds (winds around 5-6 m/s) during the wet season. To represent this behavior, it was released a radiosonde in the CLA on April 2nd, 2010. he radiosonde uses a Vaisala Oy system (sonde RSV92G), which is the state-of-art in terms of upper air measurements. he winds (wind speed and direction up to 5,000 m) are presented at Fig. 2 and they are quite characteristic for the wet season: there is a linear increase of the wind speed from the surface up to a maximum value of approximately 16 m/s at 3,000 m. Between 2,000 and 4,000 m, the winds are very persistent, ranging from 14-16 m/s. he direction of the wind is NE/E (around 60º at 500 m) and then rotating southward (around 100-110º). he synoptic pattern is typical from the wet season, with the intertropical convergence zone (ITCZ) reaching the north part of Brazil, with a large cloud cluster over the ocean and inland at the CLA (Fig. 3).
0 1000 2000 3000 4000 5000
0 2 4 6 8 10 12 14 16 18
Wind Speed (m/s)
H
ei
g
h
t
(m
)
0 1000 2000 3000 4000 5000
0 20 40 60 80 100 120
Wind Direction (degree)
H
ei
g
h
t
(m
)
Figure 2. The wind proile at CLAfor April 2nd, 2010.
INPE/CPTEC/DSA NOAA GOES-12 Canal - 5 IR 2010040221600
Figure 3. The synoptic pattern for April 2nd, 2010. resolutions of the nested grid were 27 km, 9 km, 3 km and 1 km,
and the horizontal dimensions, in grid cells, were 36 x 36, 54 x 54, 84 x 84 and 66 x 66, for domain 1 to 4, respectively. Recently, Silva and Fisch (2014) did a detailed analysis about the use of WRF for the CLA using radiosonde data collected during dry (2008) and wet season (2010) as a comparison. hey found that the WRF, using the default parameterizations, can represent the wind speed at the site reasonably well (diference between the model and the observed is less than 2.0 m/s). he innermost domain, highlighted in Fig. 1, was used in order to model a hypothetical average rocket launch event in CLA using the CMAQ model, version 5.0.1 (Byun and Schere, 2006).
In order to run the WRF model to properly generate the meteorological ields, we used inal analysis data from the Global Forecast System (GFS) with a resolution of 1 arc degree. Figure 5 presents the surface wind ield simulated by the WRF model at the time of the launch (April 2nd, 2010 – 2-5PM). It is possible to note that the wind is predominantly blowing in the opposite direction of the large city of São Luís and in the direction of an inhabited area, and it keeps on until later in the same day, at 9PM local time,
when the wind ield entirely changes and it starts blowing in the direction of the city of São Luís. his situation, which is presented in Fig. 6, shows that a major concern is to determine when launching operations should be released, in order to prevent the environmental impact and air contamination of a metropolitan area, due to the large cloud of hazardous pollutants generated by the launch. In this simulation, the pollutants were already been dispersed to out of the domain at the time when the wind ield changed, meaning that there were no more environmental risk of the cloud reaching the city of São Luís, as observed in the “Results and Discussion” section.
D01
D02
D03 D04
Maranhão
Ceará D01
D02
D03 D04
Maranhão
Ceará
39 37 35 33 31 29 27 25 23
CLA
São Luís City 21
19 17 15 13 11 9 7 5 3 1
21 22 23 24 25 26 27 28 29 30 31 32 33 34 35 36 37 38 39 40 41
Figure 5. The surface wind ield on April 2nd, 2010, at the time of the launching.
39 37 35 33 31 29 27 25 23
CLA
São Luís City 21
19 17 15 13 11 9 7 5 3 1
21 22 23 24 25 26 27 28 29 30 31 32 33 34 35 36 37 38 39 40 41
Figure 6. The surface wind ield in domain 4 at 9PM, when it changed to the direction of São Luís.
BUILDING THE EMISSIONS FILE
he emission ile is the critical point in the air quality context. To this end, it was developed the Sparce Matrix Operator Kernel System (SMOKE), which is used in order to generate the input information from emissions compatible with the model (Borge et al., 2008). In this study we did some adaptations in the SMOKE system to work with rocket launching emissions, which has some particularities that we had to address to in the system. he system has been applied to the CLA to process a hypothetical emission inventory for a test.
Figure 7 shows the launching of Titan IV, in Cape Canaveral, USA, and the formation of the so called ground-cloud and contrail-cloud (Nyman, 2009). It has been a practice in USA to consider only the emissions from ground to 3000 m in simulations, and the emission rate of a normal rocket launch is 5,2x10⁵ g/s (Bjorklund et al., 1982).
Contrail Cloud
Ground Cloud
Figure 7. Illustration of the formation of the ground and contrail clouds, during a rocket launch (Nyman, 2009).
Table 1. Hypothetical distribution of the total emissions along the levels represented by their corresponding virtual stack.
Virtual Stack Id
Stack Height (m)
Distribution of Total Emissions (%)
0 11 20
1 53 30
2 81 10
3 120 7
4 180 6
5 233 5
6 285 5
7 524 4
8 704 4
9 1446 3
10 2195 3
11 2788 3
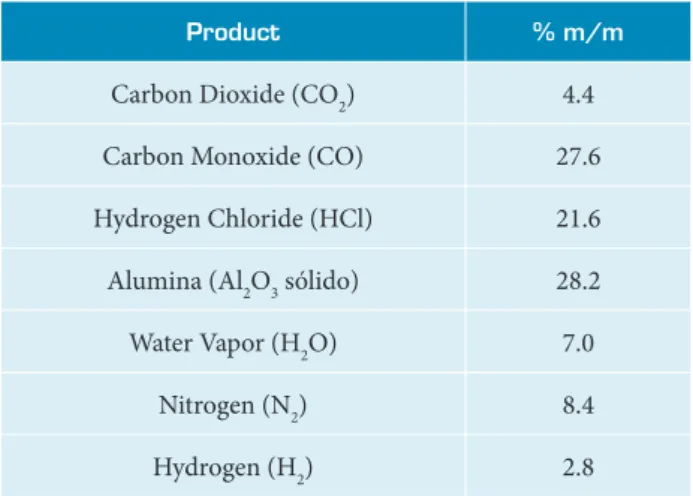
Table 2. Basic composition of the combustion gases of the propellant.
Product % m/m
Carbon Dioxide (CO2) 4.4
Carbon Monoxide (CO) 27.6
Hydrogen Chloride (HCl) 21.6
Alumina (Al2O3 sólido) 28.2
Water Vapor (H2O) 7.0
Nitrogen (N2) 8.4
Hydrogen (H2) 2.8
Table 3. List of the options used in Community Multi-scale Air Quality, for this work.
Property Selected Option
Gas Chemistry cb05tucl_ae6_aq
Aerosol Chemistry aero6
Advection vwrf
Vertical Difusion acm2
Solver ebi_cb05tucl
Cloud Module cloud_acm_ae6
he emissions inventory was composed of only one pollutant, representing the combustion gases of the propellant. Table 2 shows the distribution of compounds that are emitted during the combustion, and their corresponding species in the chosen chemical mechanism (Bjorklund et al., 1982). For this simulation, we considered the three major emitted compounds: carbon monoxide (CO), hydrogen chloride (HCl) and alumina (solid Al2O3). It is
important to mention that only the emissions from the rocket launch were considered in this work. Regarding temporal allocation the temporal proiles were setup in SMOKE, in order to have the entire emissions only at noon (time of the hypothetical launch).
CONFIGURING THE COMMUNITY
MULTI-SCALE AIR QUALITY (CMAQ) MODEL
PM 2.5 57
4,000E5
2,000E5
1,000E4
1,000E3
1,000E2
1,000E1
1,000E0
53 49 45 41 37 33 29 25 21 17 13 9 5 1
1 8 15 22 29
April 2. 2010 14:00:00 UTC
m
icr
o
g
ra
m
s/m**3
36 43 50 57
PM 2.5 57
4,000E5
2,000E5
1,000E4
1,000E3
1,000E2
1,000E1
1,000E0
53 49 45 41 37 33 29 25 21 17 13 9 5 1
1 8 15 22 29
April 2. 2010 15:00:00 UTC
m
icr
o
g
ra
m
s/m**3
36 43 50 57
PM 2.5 57
4,000E5
2,000E5
1,000E4
1,000E3
1,000E2
1,000E1
1,000E0
53 49 45 41 37 33 29 25 21 17 13 9 5 1
1 8 15 22 29
April 2. 2010 16:00:00 UTC
m
icr
o
g
ra
m
s/m**3
36 43 50 57
PM 2.5 57
4,000E5
2,000E5
1,000E4
1,000E3
1,000E2
1,000E1
1,000E0
53 49 45 41 37 33 29 25 21 17 13 9 5 1
1 8 15 22 29
April 2. 2010 17:00:00 UTC
m
icr
o
g
ra
m
s/m**3
36 43 50 57
Figure 8. Sequential tile plot for PM 2.5, representing the concentrations of alumina, for the irst layer.
RESULTS AND DISCUSSIONS
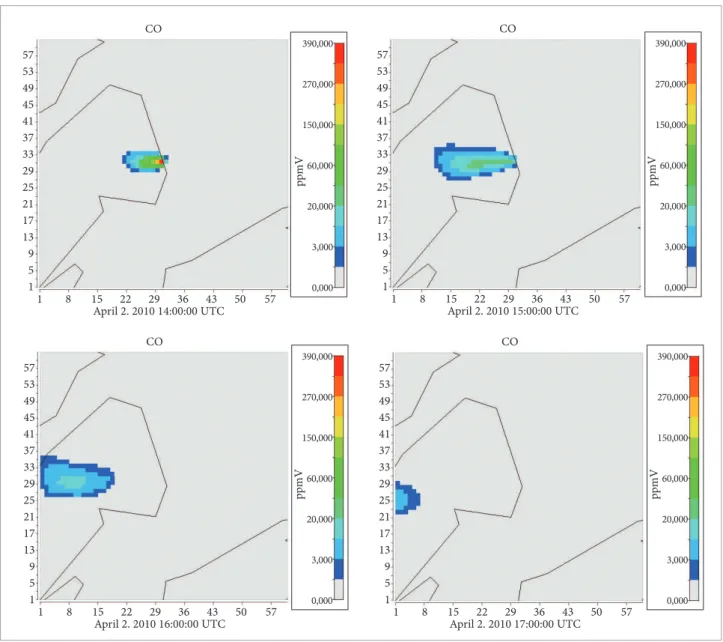
Figure 8 shows a sequential tile plot for alumina, which was modeled as fine particulate matter (PMFINE), and Fig. 9 shows a sequential tile plot for carbon monoxide, both at the first level, at an approximate 20 m height. In these figures, we can see how the ground cloud behaviors after the rocket launch. Initially, it presents high concentrations at the location where the launching occurred, and after the first hour it presents a sensible decrease in the concentrations.
Six hours later the ground cloud was totally dispersed from the domain.
Figures 10 and 11 show a sequential 3D plot for both alumina and carbon monoxide, respectively. As it can be observed, these figures shows the same behavior, where we can easily identify the ground cloud and contrail cloud formed ater the launching. In the subsequent hours, most of the concentrations remain near the ground.
CO
57
390,000
270,000
150,000
60,000
20,000
3,000
0,000
53 49 45 41 37 33 29 25 21 17 13 9 5 1
1 8 15 22 29
April 2. 2010 14:00:00 UTC
p
pm
V
36 43 50 57
CO
57 390,000
270,000
150,000
60,000
20,000
3,000
0,000
53 49 45 41 37 33 29 25 21 17 13 9 5 1
1 8 15 22 29
April 2. 2010 15:00:00 UTC
p
pm
V
36 43 50 57
CO
57
390,000
270,000
150,000
60,000
20,000
3,000
0,000
53 49 45 41 37 33 29 25 21 17 13 9 5 1
1 8 15 22 29
April 2. 2010 16:00:00 UTC
p
pm
V
36 43 50 57
CO
57
390,000
270,000
150,000
60,000
20,000
3,000
0,000
53 49 45 41 37 33 29 25 21 17 13 9 5 1
1 8 15 22 29
April 2. 2010 17:00:00 UTC
p
pm
V
36 43 50 57
Figure 9. Sequential tile plot for CO for the irst layer.
PM 2.5 Abril 02, 2010 14:00 UTC 350
300 250 200
m (x10) 150
100 50 0
1 11 21 31 41 51
PM 2.5 Abril 02, 2010 16:00 UTC 350
300 250 200
m (x10) 150
100 50 0
1 11 21 31 41 51
CO Abril 02, 2010 14:00 UTC 350
300
250
200
m (x10)150
100
50
0
1 11 21 31 41 51
CO
Abril 02, 2010 15:00 UTC 350
300
250
200
m (x10)150
100
50
0
1 11 21 31 41 51
CO
Abril 02, 2010 16:00 UTC 350
300
250
200
m (x10)150
100
50
0
1 11 21 31 41 51
Figure 11. Sequential 3D plot for CO.
HCL - Clumn 30
2238,222
1875,000
750,000
625,000
500,000
mo
les
/s
375,000
250,000
125,000
0,000
20 19 18 17 16 15 14 13 12 11 10 9 8 7 6 5 4 3 2 1
1 3 5 7 9 11131517192123252729313335373941434547495153555759
Domain Row Abril 02, 2010 14:00:00 UTC
L
ay
er
Figure 12. Vertical cross section plot of the emissions of hydrogen chloride. The emissions near ground are in the order of 2,000 moles/s.
Table 4. Health effects of respiratory exposure to hydrogen chloride (HCl).
Exposure
Limits (ppm) Health Effects
5 < Coughing
35 hroat irritation occurs ater only a short time
35 < Severe breathing diiculties and skin inlammation or burns
10-50 Maximum level that can be sustained for several hours
100 < Swelling of the lungs and oten throat spasm
50-1,000 Maximum possible exposure: 1 hour
1,000-2,000 Very dangerous even for a very short exposure
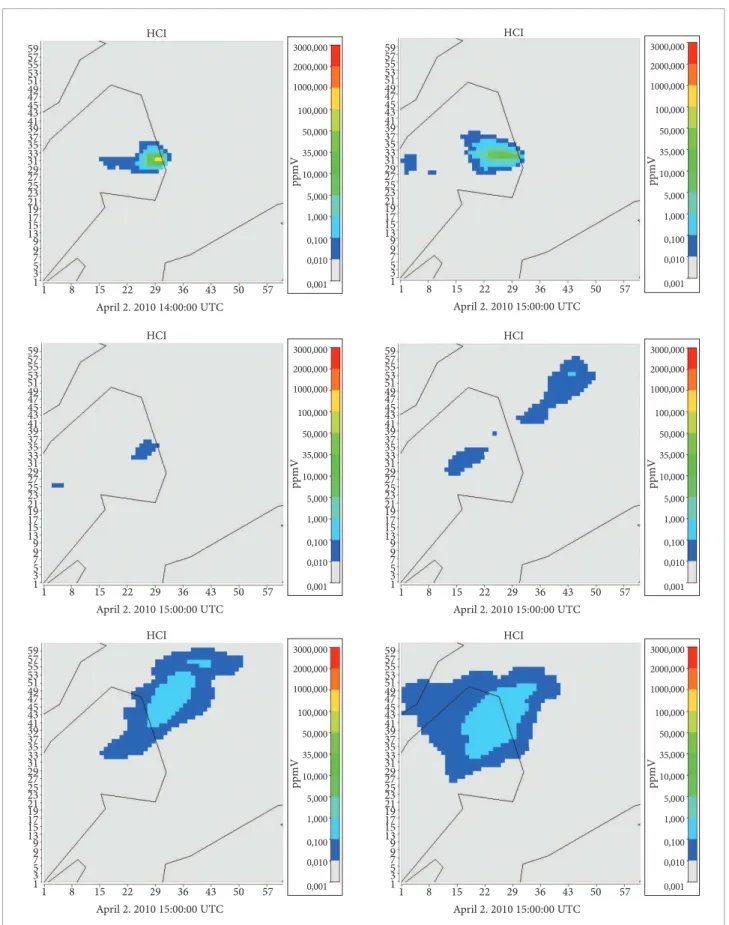
concentration levels in CMAQ. Table 4 (Baxter et al., 2000) presents the hydrogen chloride exposure limits, in ppm, and their impact in human health. HCl is a colourless gas with an irritating pungent odour perceivable at 0.8 ppm (Lide, 2003). Figure 13 presents the sequential tile plot for HCl at the first level. The first hour shows the higher concentrations at the launch site, with concentration levels between 100-1,000 ppm. According to Table 4, at this region, the maximum exposure time is only 1 hour, causing swelling of the lungs, throat spasm and irritation. In the surrounding area, it presents concentration levels between 35-50 ppm, and even at the second hour, the concentration still remains in a dangerous level (5-35 ppm).
Figure 13. Sequential tile plot for HCl for the irst layer. HCI 57 3000,000 1000,000 2000,000 100,000 35,000 5,000 0,100 50,000 10,000 1,000 0,010 0,001 53 49 45 41 37 33 29 25 21 17 13 9 5 1 59 55 51 47 43 39 35 31 27 23 19 15 9 7 3
1 8 15 22 29
April 2. 2010 14:00:00 UTC
p
pm
V
36 43 50 57
HCI 57 3000,000 1000,000 2000,000 100,000 35,000 5,000 0,100 50,000 10,000 1,000 0,010 0,001 53 49 45 41 37 33 29 25 21 17 13 9 5 1 59 55 51 47 43 39 35 31 27 23 19 15 9 7 3
1 8 15 22 29
April 2. 2010 15:00:00 UTC
p
pm
V
36 43 50 57
HCI 57 3000,000 1000,000 2000,000 100,000 35,000 5,000 0,100 50,000 10,000 1,000 0,010 0,001 53 49 45 41 37 33 29 25 21 17 13 9 5 1 59 55 51 47 43 39 35 31 27 23 19 15 9 7 3
1 8 15 22 29
April 2. 2010 15:00:00 UTC
p
pm
V
36 43 50 57
HCI 57 3000,000 1000,000 2000,000 100,000 35,000 5,000 0,100 50,000 10,000 1,000 0,010 0,001 53 49 45 41 37 33 29 25 21 17 13 9 5 1 59 55 51 47 43 39 35 31 27 23 19 15 9 7 3
1 8 15 22 29
April 2. 2010 15:00:00 UTC
p
pm
V
36 43 50 57
HCI 57 3000,000 1000,000 2000,000 100,000 35,000 5,000 0,100 50,000 10,000 1,000 0,010 0,001 53 49 45 41 37 33 29 25 21 17 13 9 5 1 59 55 51 47 43 39 35 31 27 23 19 15 9 7 3
1 8 15 22 29
April 2. 2010 15:00:00 UTC
p
pm
V
36 43 50 57
HCI 57 3000,000 1000,000 2000,000 100,000 35,000 5,000 0,100 50,000 10,000 1,000 0,010 0,001 53 49 45 41 37 33 29 25 21 17 13 9 5 1 59 55 51 47 43 39 35 31 27 23 19 15 9 7 3
1 8 15 22 29
April 2. 2010 15:00:00 UTC
p
pm
V
SUMMARY AND PERSPECTIVES
In this work, our main purpose was to apply CMAQ as a numerical model to simulate the dispersion of the contaminants emitted during a normal rocket launch event and to evaluate the entire CMAQ suite – model and its accessories – for this case. Since it is a irst step towards providing a framework which will allow the development of a more meaningful model considering the Brazilian site characteristics, in CLA, we found that the use of the model for this case is quite promising. hese results show that there is a need for thorough checking of the schemes with experimental observations planned in the region. We focus our attention in the future to evaluate the construction of the cloud released by the rocket, which can be initially deined as a single cloud that grows and moves, but remains the same during the formation of its ascending phase (ground cloud). his will address the diferent spatial and temporal scales of the problem more consistently. For more details about this, see the work of Moreira et al. (2011). For this
purpose, we plan to develop a tool that is capable of calculating the formation of the cloud, from the moment it is released to the moment when it stabilizes in the atmosphere, then to build the emissions file accordingly to the input into the CMAQ. Furthermore, it is important to construct numerical experiments from the CMAQ system model in order to have them compared to the concentration results of the MSDEF model (Moreira et al., 2011), which is a very good and proven tool for a fast screening of the contaminant concentration ield during rocket launch events.
ACKNOWLEDGEMENTS
he authors thank the Conselho Nacional de Desenvolvimento Científico e Tecnológico (CNPq) and the Coordenação de Aperfeiçoamento de Pessoal de Nível Superior (CAPES) for the partial inancial support of this work.
REFERENCES
Baxter, P.J., Adams P.H., Aw, T.-C., Cockcroft, A. and Harrington, J.M., 2000, “Hunter’s Diseases of Occupations”, Arnold, London, Vol. 45, No. 2, pp. 123-178. doi: 10.1016/S0003-4878(00)00067-3.
Borge, R., Lumbreras, J. and Rodrıguez, E., 2008, “Development of a High-Resolution Emission Inventory for Spain Using the SMOKE Modelling System: A Case Study for the Years 2000 and 2010”, Environmental Modelling & Software, Vol. 23, pp. 1026-1044.
Bjorklund, J.R., Dumbauld, J.K, Cheney, C.S. and Geary, H.V., 1982, “User’s Manual for the REEDM (Rocket Exhaust Efluent Diffusion Model) Computer Program”, NASA contractor report 3646. NASA George C. Marshall Space Flight Center, Huntsville, AL.
Byun, D.W. and Ching, J.K.S., 1999, “Science algorithms of the EPA Models-3 Community Multiscale Air Quality (CMAQ) Modeling System”, EPA/600/R-99/030, Ofice of Research and Development, United States Environmental Protection Agency, Washington, DC.
Byun, D. and Schere, K.L., 2006, “Review of the Governing Equations, Computational Algorithms, and Other Components of the Models-3community Multiscale Air Quality (CMAQ) Modeling System”, Appl. Mech. Rev., Vol. 59, pp. 51-77.
Lide, D.R., 2003, “CRC Handbook of Chemistry and Physics”, 84th edition. CRC Press, Boca Raton, Florida.
Moreira, D.M., Trindade, L.B., Fisch, G., Moraes, M.R., Dorado, R.M. and Guedes, R.L., 2011 “A Multilayer Model to Simulate Rocket Exhaust Clouds”. Journal of Aerospace Technology and Management, Vol.
3, pp. 41-52. doi: 10.5028/jatm.2011.03010311.
Nappo, C.J. and Essa, K.S.M., 2001, “Modeling Dispersion from Near-Surface Tracer Releases at Cape Canaveral, Florida”. Atmospheric Environment, Vol. 35, pp. 3999–4010.
Nyman, R.L., 2009, “NASA Report: Evaluation of Taurus II Static Test Firing and Normal Launch Rocket Plume Emissions”.
Pires, L.B.M., Avelar, A.C., Fisch, G., Roballo, S.T., Souza, L.F., Gielow, R. and Girardi, R., 2009, “Studies Using Wind Tunnel to Simulate the Atmospheric Boundary Layer at the Alcântara Space Center”. Journal of the Aerospace and Technology Management, Vol. 1, No. 1, pp. 91-98. doi: 10.5028/jatm. 2009.01019198.
Rao, R.M., Sinha, K., Candler, G.V., Wright, M.J. and Levin, D.A., 2001, “Numerical Simulation of Atlas II Rocket Motor Plumes”, 39th AIAA Aerospace Sciences Meeting and Exhibit, Reno, NV.
Reis, R.J., Aucoin, P.J. and Stechman, R.C., 1970, “Prediction of Rocket Exhaust Flow Fields”, Journal of Spacecraft and Rockets, Vol. 7, No. 2, pp. 155-159. doi: 10.2514/3.29891.
Silva, A.F.G. and Fisch, G., 2014, “Avaliação do Modelo WRF para a Previsão do Peril do Vento no Centro de Lançamento de Alcântara”, Brazilian Journal of Meteorology, In press.